Impact of Irrigation Extension on Malaria Transmission in Simret, Tigray, Ethiopia
Article information
Abstract
Poor subsistence farmers who live in a semi-arid area of northern Ethiopia build irrigation systems to overcome water shortages. However, there is a high risk of malaria transmission when increased standing water provides more favorable habitats for mosquito breeding. This is a serious problem because there are many barriers to malaria control measures and health care systems in the area. Using a causal loop diagram and computer simulations, the author attempted to visually illustrate positive and negative feedbacks between mosquito and human populations in the context of Simret, which is a small village located in northern Ethiopia and is generally considered a malaria-free area. The simulation results show that the number of infectious mosquitos increases to 17,215 at its peak, accounting for 3.5% of potentially dangerous mosquitos. At the same time, the number of sick people increases to 574 at its peak, accounting for 15% of local population. The malaria outbreak is controlled largely because of a fixed number of vulnerable people or local population that acts as an intermediate host.
INTRODUCTION
Simret is a small village located in the Hawzen district of eastern Tigray region in northern Ethiopia (13°58ʹN 39°26ʹE). The surrounding area is mostly plateau and semi-dry with a short rainy season. The average annual rainfall and temperature are respectively 650 mm and 21°C (max. 25°C, min. 17°C). The majority of local population are poor subsistence farmers who cultivate a variety of cereal crops and raise livestock for household consumption and incomes [1]. Water scarcity is a root cause of the low productivity of agriculture that is heavily dependent on the short rainy season between June and September [2]. The area is also severely degraded by soil erosion and nutrient depletion because of high population density: traditionally, many Ethiopians migrated to mid-highlands due to fear of malaria [3]. The population pressure resulted in overgrazing and deforestation, which further aggravated extensive drought and famine in the region [3]. Therefore, villagers built small scale irrigation systems to overcome the low productivity and water shortages; however, there was a high risk of increasing malaria transmission [4,5].
Malaria is a leading public health problem in Ethiopia. About 67% of the population live in malaria-risk areas according to the WHO malaria report in 2014 [6]. It is endemic in western and southeastern lowlands of Ethiopia with varying intensity of transmission, whereas the northern dry highlands receive relatively low rainfall and are generally malaria-free [7]. The density of vectors or mosquito populations tends to decrease with increasing altitude in highland areas [8]. There are many factors affecting malaria prevalence such as climatic, physical, household, and socioeconomic conditions in Ethiopia [9-12]. In particular, malaria prevalence is strongly associated with the amount of rainfall in the Tigray region of northern Ethiopia. It normally coincides with the rainy growing season during which labor requirements are highest [13-15].
Among other factors, human activities can also influence the prevalence of malaria. Agricultural development, deforestation, and construction of dams for hydro-electric power generation lead to ecological changes, which exert considerable influence on the proliferation of mosquito breeding sites and thus malaria transmission [13]. Many farmers build wells and store water in dugouts or bunds to overcome water shortages: these water storage sites and other standing water provide favorable habitats for mosquito larval development [14]. Well-maintained canals and irrigations can prevent mosquitos from breeding extensively, but small standing pools of water, seepage, and improper maintenance can give rise to and sustain breeding opportunities in the dam areas [15]. The Tigray Health Bureau found that malaria and schistosomiasis across the region averaged more than 10% of the population, which was significantly higher than the pre-micro-dam period [15]. Plasmodium falciparum and Plasmodium vivax account for 65% and 35% of the infections, respectively, in the Tigray region [16].
Using computer simulations and mathematical models, many researchers described the life cycle and population dynamics of mosquitos that are interacting with their physical environments and humans, and also examined their behavior in response to climate changes and control policies or interventions [17-21]. The author chose to use system dynamics to evaluate the impact of irrigation extension on malaria transmission. System dynamics modelling is a relatively new technique that utilizes a causal loop diagram and computer simulations to describe dynamic patterns of system behavior over time. System dynamics is useful when one intends to study a feedback between the mosquito and human populations [22,23]. In short, the aim of this study was to illustrate the feedback between mosquitos and human populations in the context of Simret, northern Ethiopia, which is generally considered a malaria-free area. This study neither applies nor estimates precise values to determine mosquito and infected human populations. Rather, the author attempted to present an informative article about host-parasite relationships using simple differential equations and computer simulations. It may provide a better understanding of how a large malaria epidemic can occur and be controlled for readers without a strong foundation in parasitology.
MATERIALS AND METHODS
System dynamics modelling is comprised with 2 parts, namely a causal loop diagram and a stock and flow diagram. A causal loop diagram depicts endogenous relationships among system components and defines the type of feedback structure. A stock and flow diagram defines the underlying physical structure and decision rules in mathematical equations. Stocks describe and provide information about the state of a system. Flows make adjustments in stocks through addition and subtraction over time. A system continuously observes information from stocks and then makes adjustments through in and out flows. The following sections demonstrate how the system dynamic modelling was done.
Causal loop diagram
The feedback relationship between mosquito and human populations is illustrated in Fig. 1. A female mosquito lays eggs on standing water. An adult female mosquito that emerges from the pupa is potentially dangerous. An increase in the number of potentially dangerous mosquitos is likely to increase the number of incubating mosquitos, depending on the chance of biting infectious people. The potentially dangerous mosquito that bites an infectious person undergoes the incubating period and then becomes infectious. An increase in the number of infectious mosquitos is likely to increase the number of incubating people, depending on the chance of biting vulnerable people. A vulnerable person who is bitten by an infectious mosquito undergoes the incubating period and then becomes infectious, increasing the chance of transmitting the parasite to mosquitos. There is a positive feedback loop between the mosquito and human populations at this point. However, there is a balancing force at the same time. As the number of sick people increases as a result of malaria transmission, the number of immune and vulnerable people decreases, given a finite number of local inhabitants. Consequently, the chance of biting vulnerable people quickly decreases at the peak of malaria outbreak.
Feedback between mosquitos and humans.
Model setting and description
The time bound for simulation is 1 year or 365 days. The mosquito population begins to increase on day 152, which marks the onset of rainy season in northern Ethiopia. The model described in this section builds upon Mecoli [22] and Albin [23] who described the dynamic relationship between mosquito and human populations. The model can be represented by the ordinary differential equations, which define a stock and flow diagram of a system dynamics model. Stocks represent mosquito and human populations. Each stock is adjusted by inflows and outflows, which are in turn determined by stocks and exogenous variables or parameters. The parameter definitions and values are provided in Table 1.
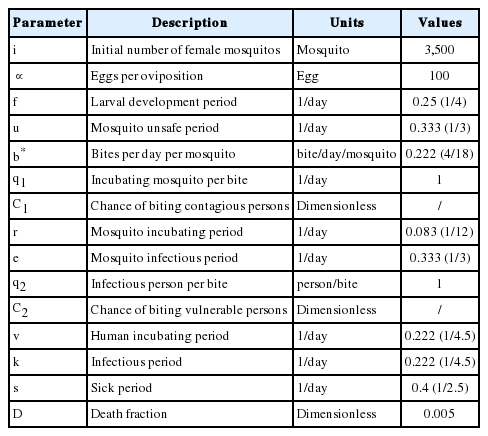
Parameter definitions and values used in model simulations
The mosquito life cycle and infection process
The duration of the larval stage as well as the lifespan of adult mosquitos are influenced by species of mosquitos and physical conditions. Also, adequate larval habitat is an important prerequisite for the proliferation of mosquitos. It is assumed that new irrigation systems increase favorable breeding sites for larval development in Simret. There are 4 compartments for the mosquito population, namely mosquito eggs, potentially dangerous mosquitos, incubating mosquitos, and infectious mosquitos. A female mosquito mates once in its lifetime and must have a blood meal before it can lay eggs. Eq (1) shows that a female mosquito lays about 100 eggs per oviposition. Using the pulse function of Vensim software, it is assumed that 350,000 eggs (i) (calibrated by trial stimulations) are laid by female mosquitos daily starting from day 152 and then enters the stock of mosquito eggs for the next 100 days. Concurrently, a fraction (f) of the mosquito eggs develops into adult mosquitos. Roughly a half of them emerges into female mosquitos and leaves the stock of mosquito eggs. The larval development takes 4 days on average, and then adult mosquitos emerge from the pupa. Eq (2) shows that the fraction of mosquito eggs (
Equations (1) to (4) are as follows:
where,
Human population
Eq (5) shows that infectious mosquitos bite vulnerable people with a probability defined as a ratio of vulnerable people to total population (b ∙ q2 ∙ C2 ∙
Equations (5) to (9) are as follows:
where,
RESULTS
The model estimated that the stock of mosquito eggs increases to 1.4 million during the rainy season between June and August. Consequently, the potentially dangerous mosquito population (female) rises exponentially from day 152 and maintains about half a million during the rainy season as shown in Fig. 2. The simulation results also showed that the incubating and infectious mosquitos begin to rise exponentially on and around day 230. The incubating mosquito population increases to 74,790 on day 261 at its peak, accounting for 15% of the potentially dangerous mosquitos. Concurrently, the infectious mosquito population increases to 17,215 on day 264 at its peak, accounting for 3.5% of the potentially dangerous mosquitos and 23% of the incubating mosquitos. The infectious mosquitos transmit the malaria parasites to vulnerable people after which they bite infectious people. This is the point where the positive feedback loop intensifies. The incubating and contagious (or infectious) people begin to increase exponentially on and around day 234, while the number of vulnerable people decreases proportionally as shown in Fig. 3. The number of incubating people increases to 1,486 on day 258 at its peak, accounting for 38% of the local population. The number of infectious people increases to 1,125 on day 260 at its peak, accounting for 30% of the local population. The number of sick people increases to 574 on day 263 at its peak, accounting for 15% of the local population.
Dynamics of mosquito population at different stages. The baseline simulation assumes zero values for mosquitos and thus is not shown.
Dynamics of local population at different stages.
The majority of sick people recovers from the disease and becomes immune. The mosquito population begins to fall after mid-September, which marks the end of rainy season. At the same time, there are few vulnerable people who can be infected by infectious mosquitos. The malaria epidemic quickly comes to an end.
DISCUSSION
A favorable aquatic habitat as a result of the irrigation extension increases the number of eggs laid by female mosquitos either on damp ground or directly on standing water [5]. The pupae emerge into adult mosquitos whose female population rise exponentially to about half a million at the onset of the rainy season. These mosquitos are potentially dangerous as they begin to bite local inhabitants. However, their chances of finding and biting an infectious person are extremely low despite the pronounced increase in mosquito population. The probability of biting an infectious person is approximately 6.3×10⁻¹⁶. Mosquitos become more active by the end of rainy season in September. Hence, there is about 2-3 months of time delay before malaria transmission begins to escalate. Their chances of biting an infectious person begin to increase dramatically from around day 247.
There is a positive feedback between the human and mosquito populations at this point: as the chance of biting an infectious person increases, the number of infectious mosquitos increases rapidly [23]. The probability of biting an infectious person quickly rises up to nearly 30%. The model estimated that, at its peak, 15% of the potentially dangerous mosquitos bite an infectious person and undergo the incubating period. However, a slightly larger number of the incubating mosquitos die simultaneously due to their limited lifespan and other death factors [19]. Therefore, only 23% of the incubating mosquitos or 3.5% of the potentially dangerous mosquitos have a chance to bite and transmit the malaria parasites to vulnerable people.
As the infectious mosquitos aggressively seek and bite vulnerable people, the number of incubating and contagious (or infectious) people increases rapidly. These people undergo the incubating and contagious periods whose time spans are slightly different from one another, creating a time delay in transition from the stock of incubating people to the stock of contagious people. Therefore, the number of contagious people is a bit smaller than that of incubating people at their peaks, but extends a bit longer period of time. The number of sick people increases to 576 at its peak, which is in line with other findings that malaria incidences average about 10% of local population after the construction of micro-dams in the Tigray region [15]. The number of immune people increases rapidly as the majority of sick people recovers fast and few people die from the disease: the sick period of less than 3 days on average is relatively shorter than the incubating and contagious periods.
The seemingly low risk of malaria in Simret may lead to a conviction among villagers and local authorities that malaria is not a serious problem to be addressed. However, the simulation results suggest that the irrigation extension in Simret is likely to increase malaria transmission because of the increased habitat sites for mosquito breeding. There is a positive feedback between the human and mosquito populations, as the chance of biting an infectious person increases, and the number of infectious mosquitos increases rapidly [23].
The malaria epidemic is controlled largely because of the finite number of vulnerable people or local inhabitants in the model. However, there is an escalating risk of malaria transmission in the region if villagers freely move from one another. The establishment of health facilities, availability of malaria drugs, and implementation of control measures such as insecticide treated bed nets and indoor residual spraying may help curtail malaria outbreak in Simret [16]. Unfortunately, all village areas are not adequately covered by the indoor residual spraying programs, which are only allocated to high malaria risk areas. Therefore, increasing the supply of indoor residual spraying and insecticide treated bed nets should be put into consideration when constructing new irrigation schemes in Simret.
Acknowledgements
This work was supported by the Ministry of Education of the Republic of Korea and the National Research Foundation of Korea (NRF-2016S1A5B8925203)
Notes
We have no conflict of interest related to this work.