Molecular phylogeny of parasitic Platyhelminthes based on sequences of partial 28S rDNA D1 and mitochondrial cytochrome c oxidase subunit I
Article information
Abstract
The phylogenic relationships existing among 14 parasitic Platyhelminthes in the Republic of Korea were investigated via the use of the partial 28S ribosomal DNA (rDNA) D1 region and the partial mitochondrial cytochrome c oxidase subunit 1 (mCOI) DNA sequences. The nucleotide sequences were analyzed by length, G + C %, nucleotide differences and gaps in order to determine the analyzed phylogenic relationships. The phylogenic patterns of the 28S rDNA D1 and mCOI regions were closely related within the same class and order as analyzed by the PAUP 4.0 program, with the exception of a few species. These findings indicate that the 28S rDNA gene sequence is more highly conserved than are the mCOI gene sequences. The 28S rDNA gene may prove useful in studies of the systematics and population genetic structures of parasitic Platyhelminthes.
INTRODUCTION
The interrelationships of the Platyhelminthes have attractive attention from both phylogeneticists restricting their attention to morphological characters and those relying solely on molecular data. Recently a number of authors have utilized partial and complete ribosomal DNA and mitochondrial DNA sequences to resolve parasitic helminths phylogenetic relationships within intraspecies and interspecies (Olson et al., 2001, 2003; Tkach et al., 2001; Vilas et al., 2005).
The first phylogenetic analysis providing explicit character matrices for trematodes was not attempted until Cribb et al. (2001) combined a newly coded morphological matrix with new molecular data from the small subunit ribosomal RNA gene (ssrRNA) from 75 digenean species representing 55 families. Also, recent efforts based primarily on comparative analysis of morphology, and to the lesser extent on molecules, have advanced our understanding of tapeworm systematics and evolution considerably within the phylum Platyhelminthes (Hoberg et al., 1999; Littlewood and Bray, 2001; Olson et al., 2001). However, Platyhelminthes remain still unclear about their morphological features in some species among the experts (Halanych, 2004).
However, PCR technology and DNA sequencing techniques permit the identification of species, strains, and populations from any stage in their life history to distinguish among morphologically similar parasites (Olson et al., 2001, 2003; Lockyer et al., 2003). So far, many nuclear rDNA and mitochondrial DNA (mtDNA) genes have come into a common use in intraspecies or interspecies molecular systematics on Platyhelminthes (Blaxter et al., 1998; Vilas et al., 2005). The nuclear rDNA gene repeat unit harbors different regions that evolve at varying rates, and thus has also been extensively used in the study of variation and phylogeny at a number of different taxonomic levels. The region incorporated into the first 3 variable domains of 28S rDNA (D1-D3) has been extensively utilized in estimation of the relationships existing within and among the Platyhelminthes (Olson et al., 2003). Mitochondrial DNA has proven to be quite useful for discrimination of closely related organisms, and has been utilized in a number of studies to investigate the phylogenetic relationships existing among eukaryotes at many levels, due to its relatively rapid rate of evolution as compared to the nuclear genome (Lee et al., 2004a, 2004b; Vilas et al., 2005). Mitochondrial cytochrome c oxidase subunit I (mCOI) is the most highly conserved among 3 genes coding for cytochrome oxidase, and has been employed in phylogenetic studies.
The molecular sequence analysis and phylogenetic relationships among the parasitic helminths remain still unclear in the Republic of Korea. Here we would like to provide additional resolution for the interpretation of helminths evolution. The objective of this paper is to compare the utility of a prospecting DNA marker of ribosomal 28S rDNA D1 region and the mCOI gene sequence for genetic variation and phylogenetic relationships among 14 parasitic Platyhelminthes.
MATERIALS AND METHODS
Parasites
Table 1 shows a taxonomic listing of 14 species (2 classes, 6 orders, 8 families; 9 species of trematodes and 5 species of cestodes) and a recovery source.

Taxonomic listing of parasites used in this study
Isolation of genomic DNA
Genomic DNA was extracted from the whole adult worms. Each specimen was fixed using 100% ethanol at room temperature or frozen at -80℃ until prepared for DNA extraction. The ethanol in the tissue samples was replaced with 1 M Tris-EDTA buffer (pH 8.0). The frozen worms were lyophilized and lysed with lysis buffer containing 1% SDS, proteinase K (500 µg/ml), and RNase at 37℃ for 2-3 hr or overnight. The DNA was extracted in phenol/chloroform, as reported by Sambrook and Russell (2002).
PCR
The PCR of the 28S rDNA D1 region was conducted in a final volume of 50 µl, consisting of extracted DNA as a 50-100 ng template, 200 µM of each dNTP, 10 pmoles of each primer, and 0.5 unit of Ex Taq enzyme (TaKaRa Ex Taq Kit, TAKARA Shuzo Co., Shiga, Japan). The reactions were conducted in a GeneAmp PCR System 4800 thermal cycler (Perkin Elmer, Foster City, California, USA). The PCR reaction cycles consisted of denaturation for 20 sec at 95℃, 30 sec of annealing at 55℃, and 30 sec of extension at 72℃, followed by a final extension of 6 min at the end of 40 cycles. The forward primer (JB10, 5' GATTACCCGCTGAACTTAAGCATA 3') consisted of the conserved region from the 21st-45th sites of the 28S rDNA sequence of Schistosoma mansoni. The reverse primer (JB9, 5' GCTGCATTCACAAACACCCCGACTC 3') was complementary to the 278th-302nd sites of the same gene. The mCO1 PCR was conducted using the above method. The forward primer was JB3 (5' TTTTTTGGGCATCCTGAGGTTTAT 3') (2575) and the reverse primer was JB4.5 (5' TAAAGAAAGAACATAATGAAAATG 3') (3021). The numbers in brackets refer to the position of the 5' end of the primer from the sequence of Fasciola hepatica (Bowles and McManus, 1994; Lee et al., 2004a, 2004b). The PCR conditions were the same as described above, except that annealing was conducted for 30 sec at 48℃.
Cloning of 28S rDNA D1 and mCOI
The PCR products were purified with a Gel Extraction Kit (QIAGEN Co., Valencia, California, USA) and ligated into a T cloning vector (pT7Blue Perfectly Blunt Cloning Kit, Novagen Co., Madison, Wisconsin, USA). The clones were generated via the transformation of E. coli NovaBlue competent cells, which were provided by the supplier. The positive recombinant clones were selected and grown in 2 ml of LB broth, in the presence of 50 µg/ml ampicillin, overnight at 37℃. The positive plasmids were purified using the QIAprep Spin Plasmid kit (QIAGEN) in accordance with the manufacturer's instructions. The recombinant plasmid was screened using isopropyl-β-thiogalactoside (IPTG) and 5-bromo-4 chloro-3-indolyl-β-D-galactoside (X-gal). Plasmids harboring inserts were digested with the appropriate restriction enzymes for 2 hr at 37℃, and examined with ethidium bromide-stained 1% agarose gels.
Sequencing
DNA sequencing was conducted via the dideoxy chain termination method (Sanger et al., 1977) using the Sequenase kit (ABI Prism Dye Terminator Cycle Sequencing Core Kit, Perkin Elmer) and an automated DNA sequencer (Applied Biosystems model 373A, Perkin Elmer) in accordance with the manufacturer's instructions. The sequencing primers included the T3 and T7 universal primers for both directions. At least 3 clones were sequenced per isolate, with additional clones sequenced as necessary in order to resolve any ambiguous sites.
Sequence analysis and alignment
Sequence analysis was conducted using the nucleotide BLAST program in the NCBI database (National Center for Biotechnology Information, NIH, Bethesda, Maryland, USA) for similarity and nucleotide length (Tatusova and Madden, 1999). We also calculated the fractional GC contents of the nucleic acid sequences, using the EMBOSS GEECEE program provided by Dr. Richard Bruskiewich (Sanger Institute, Wellcome Trust Genome Campus, Hinxton, Cambridge, UK) (http://bioweb.pasteur.fr/seqanal/interfaces/geecee.html). The nucleotide sequences were compared using the Multalign program (Multiple sequence alignment, European Bioinformatics Institute, http://www.ebi.ac.uk/clustalw/) for nucleotide differences and gaps (Corpet, 1988). The resulting aligned output was manually adjusted in order to improve the homology statements. The alignment gaps were treated as missing data. Sequences corresponding to the PCR amplification primers were excluded prior to multiple sequence alignment and phylogenetic analysis, as primer incorporation during amplification masks potential mismatches (substitutions) that might occur within the priming sites. The confirmed sequences were then deposited in the EMBL/GenBank Data Libraries of the NCBI.
Phylogenetic analysis
All phylogenetic analyses were conducted using the PAUP (Swofford, 2001, PAUP; Phylogenetic Analysis Using Parsimony Version 4.0 d81, Sinauer Associates, Sunderland, Massachusetts, USA). Each molecular data partition was analyzed by both maximum parsimony (MP) and neighbor-joining (NJ) analysis (Saitou and Nei, 1987). The analyses were run using a heuristic search strategy (100 search replicates) with tree bisection-reconnection branch swapping, equally weighted characters and gaps treated as missing data. Bootstrap analysis was performed using a fast heuristic search strategy (1,000 replicates where ≥ 50%) for the 28S rDNA D1 and mCOI data. A neighbor-joining analysis was performed using the Kimura 2-parameter model for distance correction; corrected for multiple substitutions (Kimura, 1980).
The 28S rDNA D1 and mCOI sequences used for the analysis and tree construction of Clonorchis sinensis, Plagiorchis muris, Metagonimus takahashii, Metagonimus yokogawai, and Pygidiopsis summa, as determined for comparative purposes, were the same as those previously reported by Lee and Huh (2004) and Lee et al. (2004a, b). In addition, we utilized the 28S rDNA D1 and mCOI sequences of other species, which have not been previously reported. The sequences from Gastrocotyle trachuri (GenBank accession No.: AF131727 for 28S rDNA D1, AY009167 for mCOI) as Monogenea were employed as an outgroup for phylogenetic analysis.
RESULTS
PCR for 28S rDNA D1 and mCO1
We acquired PCR-amplified products from genomic DNA using each of the primer sets. The product length differed between genes or within species. Each of the PCR products was approximately 280-300 base pairs (bp) for 28S rDNA D1 gene and 360-480 bp for mCOI gene in length. No differences in band size between the 28S rDNA D1 and mCOI were observed among the species, with the exception of a few (data not shown).
Sequence analysis
The results of sequence analysis indicate that variation occurs not only in terms of sequence length and G + C percentage, but also in terms of nucleotide differences and gaps (nucleotide insertions, deletions, and substitutions). In the case of 28S rDNA D1 and mCOI, nucleotide differences and gaps were found to be variable within the same class, and several nucleotide insertions, deletions, and substitutions were detected with gaps in the same or different positions (Tables 2-3).

Comparison of aligned sequence analysis for different trematode species

Comparison of aligned sequence analysis for different cestode species
For 28S rDNA D1, the nucleotide sequences ranged from 278 to 313 bp with primer sequences (trematodes; 293-304 bp, cestodes; 278-313 bp) in length among all specimens. The longest nucleotide sequence was 304 bp (P. muris in trematodes) and 313 bp (Taenia saginata in cestodes) (Tables 2-3). The 28S rDNA D1 nucleotide sequences evidenced a GC content of 50-57% (trematodes; 50-55%, cestodes; 53-57%). The highest G + C percent was 55% (C. sinensis in trematodes) and 57% (T. saginata in cestodes) (Tables 2-3). The nucleotide differences among species ranged between 0-60 bp in trematodes and 38-155 bp in cestodes when adjusted for gaps. The largest nucleotide difference observed for the 28S rDNA D1 gene was 60 bp between Gymnophalloides seoi and P. muris in trematodes and 155 bp between Spirometra erinacei and T. saginata in cestodes (Tables 2-3). The gap differences among species ranged between 0-10 bp in trematodes and 10-29 bp in cestodes when adjusted for gaps. Large gaps of the 28S rDNA D1 gene were 10 bp between G. seoi and P. muris in trematodes originally due to nucleotide length, and 29 bp between Diphyllobothrium latum and Hymenolepis diminuta in cestodes (Tables 2-3).
For the mCOI gene sequence, the nucleotide sequences ranged from 366 to 488 bp with the primer sequences (trematodes; 366-488 bp, cestodes; 444-473 bp) in length among all specimens. The longest nucleotide sequence was 488 bp (P. muris in trematodes) and 473 bp (Taenia taeniaeformis in cestodes) (Tables 2-3). The nucleotide sequences evidenced a GC content of 31-48% (trematodes; 35-48%, cestodes; 31-38%). The highest G + C percentages were 48% (Paragonimus westermani and P. muris in trematodes), and 38% (S. erinacei in cestodes) (Tables 2-3).
For the mCOI sequences, the nucleotide differences among species ranged between 3-272 bp in trematodes and 58-131 bp in cestodes when adjusted for gaps. The largest nucleotide difference was 272 bp between P. muris and P. summa in trematodes and 131 bp between T. saginata and T. taeniaeformis in cestodes (Tables 2-3). In addition, gaps among trematode species were more variable than those observed in other cestode species. The gap differences among species ranged from 1-121 bp in trematodes and 0-28 bp in cestodes when adjusted for gaps among classes in proportion to each nucleotide difference. The largest gap was 121 bp between Heterophyes nocens and P. muris in trematodes, and 28 bp between D. latum and T. taeniaeformis in cestodes (Tables 2-3). We deposited each sequence into the GenBank database at NCBI under the accession numbers shown in Tables 2-3.
Phylogenic analysis
The results of the 28S rDNA D1 and mCOI phylogenic trees are provided in Table 4, and Figs. 1-2, respectively. Table 4 shows the results of character status and tree statistics resulting from the individual maximum parsimony analyses. Analyses using the heuristic search algorithm implemented in PAUP 4.0 (Table 4). G. trachuri as Monogenea was utilized as an outgroup for both genes in our phylogenetic analysis.

Character status and tree statistics for phylogenic analysis using PAUP 4.0
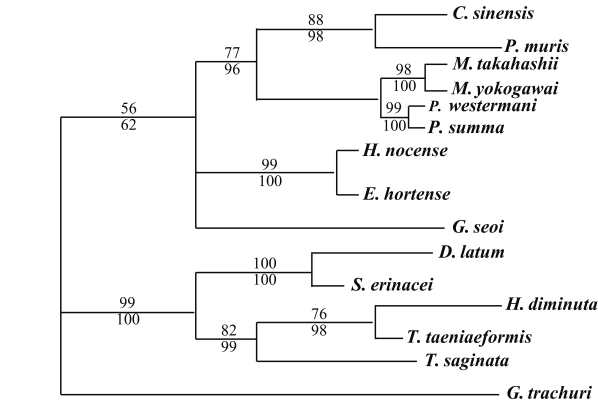
Phylogenetic tree of 28S rDNA D1 gene by maximum parsimony (MP) analysis using the PAUP 4.0 program. Nucleotide sequences were used to construct this tree. Sequences from Gastrocotyle trachuri (GenBank accession No.: AF131727) were employed as an outgroup for phylogenetic analysis. Above branch: MP bootstrap values, below branch: NJ bootstrap values, when 1,000 bootstrap replicates where ≥ 50%, respectively.

Phylogenetic tree of mCOI gene by maximum parsimony (MP) using the PAUP 4.0 program. Nucleotide sequences were used to construct this tree. Sequences from Gastrocotyle trachuri (GenBank accession No.: AFAY009167) were employed as an outgroup for phylogenetic analysis. Above branch: MP bootstrap values, below branch: NJ bootstrap values, when 1,000 bootstrap replicates where ≥ 50%, respectively.
For 28S rDNA D1 gene, in the trematode groups, C. sinensis was in the same clade of the phylogenic tree as P. muris. P. summa was located in the same clade of the phylogenic tree as P. westermani. However, Echinostoma hortense and H. nocens were genetically close, but different clade with other trematode species. In the cestode groups, D. latum was quite closely related to S. erinacei. H. diminuta and T. taeniaeformis were in the same clade of the phylogenic tree as was T. saginata (Fig. 1).
For mCOI gene, in the trematode groups, C. sinensis was closely related to P. summa, P. westermani was in the same clade as the Metagonimus species. E. hortense was closely related to G. seoi, but both of these species were genetically distinct from other trematode groups. H. nocens and P. muris were generically same clade in our phylogenetic tree. However, these 2 species were located in the different clade from other trematode species. In the cestode groups, D. latum was quite closely related to T. taeniaeformis. However, T. saginata, H. diminuta, and S. erinacei were genetically distinct from D. latum and T. taeniaeformis (Fig. 2).
DISCUSSION
So far, only a few is known about the relative divergence rates of nuclear versus mitochondrial DNA in the Platyhelminthes (Morgan and Blair, 1998; Vilas et al., 2005). Therefore, here we established the utility as markers of interspecific variation and phylogenic relationship in the Platyhelminthes. In a comparison of genetic variations of the partial 28S rDNA D1 and mCOI gene sequences, our result suggests that the 28S rDNA D1 gene was mostly conserved relative to the mCOI sequences by each sequence analysis. This reason was that mitochondrial DNA may evolve more rapidly than ribosomal DNA, and found that the majority of the nucleotide indels, substitutions occurred at the same or different sites under a variety of biological or environmental conditions. Our data showed consistent patterns with other researcher groups (Vilas et al., 2005). They reported that mitochondrial DNA sequences of the Platyhelminthes accumulate nucleotide substitutions at a much higher rate than internal transcribed spacer (ITS) gene in comparisons of genetic distances.
From our data, we observed genetic variation among species in parasitic Platyhelminthes. The each variation is very variable based on each gene among species. We think that these differences in the nucleotide lengths, GC percentage, nucleotide differences, and number of gaps of each gene can be attributed largely to varying numbers of repeats, copy numbers, deletions, alignment gaps, and base substitutions and additions. Base substitutions and additions are characterized by very high C content which can, at times, represent pure poly-C structures. In addition, this may be a consequence of mutations in the lineage. Also, we may think that other reasons, which mitochondrial DNA may be error by pseudogenes, frame-shift mutations in environmental conditions. Morgan and Blair (1998) reported that the pseudogenes in mitochondrial and ITS genes have been found in parasitic helminths. Because frame-shift mutations or premature stop codons are common in pseudogenes, protein-coding genes of the mtDNA can be error-checked by translating the nucleotide sequences (Benasson et al., 2001).
The phylogenic patterns of the 28S rDNA D1 gene differed from those of the mCOI. The phylogenic patterns of the 28S rDNA D1 and mCOI regions were quite closely related among classes, with the exception of a few species. According to our 28S rDNA D1 data, in the trematode groups, G. seoi (Gymnophallidae) was separated from other family species among the class. M. takahashii was very closely related to M. yokogawai as previously reported by Lee and Huh (2004) and Lee et al. (2004a, 2004b), and other groups evidenced similar results for the ITS1 gene using the PCR-RFLP technique (Yu et al., 1997). In the cestode groups, H. diminuta was very closely related to Taenia species, due to the smallest nucleotide differences among taxa, despite the disparities in host species and morphology.
The majority of the trematode taxa groups evidenced different patterns for the mCOI gene, with the exception of the Metagonimus species. M. takahashii was quite close to M. yokogawai. This result is consistent with results for the mCOI gene as assessed by PCR-RFLP (Yu et al., 1997). A unique result revealed in the present study is the observation that H. nocens and P. muris were quite divergent from other trematode groups, possibly as the result of their having a shorter nucleotide sequence than other trematode species.
In the cestodes, the majority of taxa groups for mCOI did not evidence identical 28S rDNA D1 patterns. D. latum was in the same clade as the other Taenia species group's taxa, but was not in the same clade as S. erinacei, even though they are both the same Diphyllobothriidae. These observations are inconsistent with the phylogenetic relationship observed between D. latum and S. erinacei in the 28S rDNA D1 tree. T. taeniaeformis was related closely to T. saginata. However, Gasser et al. (1999) showed similarity difference or variations between T. taeniaeformis and T. saginata using the same primers. This mCOI phylogenetic tree did not support the current phylogram on the basis of morphological evidence for within class separation.
We compared both gene sequences by MP and NJ analysis for phylogenic analysis, and then we acquired the same tree pattern. We also analyzed the 28S rDNA D1 gene sequence by likehood method (LM) for phylogenic analysis. This result showed the same tree pattern results, like as MP and NJ methods (data not shown). However, due to the effects of the large number of taxa and high levels of homoplasy of the mCOI data partition, the LM analysis was stopped prior to completion of the initial heuristic search and a consensus was based on the equally parsimonious trees. Also, we could not do combined analyses between 28S rDNA D1 and mCOI genes, because these genes were different in protein non-coding (28S rDNA) or coding (mCOI).
In conclusion, our data revealed that the 28S rDNA D1 genes are conserved to a higher degree relative to the mCOI sequences. The mCOI resultant phylogenetic tree did not support the current hypotheses on the basis of morphological evidence for the separation of classes, in comparison to the 28S rDNA D1 region. Although more work is needed to determine which factors are involved, we carefully suggest that the 28S rDNA gene may prove useful for studies of systematics and population genetic structures of parasitic Platyhelminthes, although the interrelationships of many families were left unresolved. In addition, further studies will be required for a more adequate elucidation of the phylogeny of Platyhelminthes using other ribosomal DNA and full mitochondrial genome sequences in the future. This data will indirectly aid investigations into the dynamics of morphological and developmental evolution, as well as the biology of parasitism.
ACKNOWLEDGMENTS
The authors wish to thank Dr. Jong-Yil Chai Department of Parasitology and Tropical Medicine, Seoul National University College of Medicine, and Dr. Woon-Mok Sohn, Department of Parasitology, Gyeongsang National University College of Medicine, Korea for supplying the specimens.
References
Notes
This work was supported by the Korea Research Foundation Grant (KRF-2003-015-E00113).