RNA-sequencing Profiles of Cell Cycle–Related Genes Upregulated during the G2-Phase in Giardia lamblia
Article information
Abstract
To identify the component(s) involved in cell cycle control in the protozoan Giardia lamblia, cells arrested at the G1/S- or G2-phase by treatment with nocodazole and aphidicolin were prepared from the synchronized cell cultures. RNA-sequencing analysis of the 2 stages of Giardia cell cycle identified several cell cycle genes that were up-regulated at the G2-phase. Transcriptome analysis of cells in 2 distinct cell cycle stages of G. lamblia confirmed previously reported components of cell cycle (PcnA, cyclin B, and CDK) and identified additional cell cycle components (NEKs, Mad2, spindle pole protein, and CDC14A). This result indicates that the cell cycle machinery operates in this protozoan, one of the earliest diverging eukaryotic lineages.
Giardia lamblia is a protozoan pathogen that causes diarrheal outbreaks in humans [1]. The trophozoite is one of the 2 forms comprising the G. lamblia life cycle and represents the multiplication step. Cell cycle regulation in Giardia trophozoites has been primarily investigated by producing synchronized cell cultures using aphidicolin [2] or nocodazol/aphidicolin [3] or by the counterflow centrifugal elutriation [4]. A previous study using in vitro cultures of Giardia trophozoites showed that dominated by cells at the G2-phase [3,5]. The expression of the cyclin B gene was found to be fluctuated periodically and was found to peak at the G2-phase, whereas the expression levels of other histone genes were found to be up-regulated at the G1-phase in Giardia [2]. Using Giardia cells separated by counterflow centrifugation elutriation, several genes were reported to encode stage-specific proteins, including thymidine kinase, minichromosome maintenance 5, polo-like kinase, and proliferating cell nuclear antigen (PcnA) [4]. In the present study, Giardia cells were prepared as enriched cultures at the G1/S- and G2-phase by treatment with nocodazole/aphidicolin. Cells were then analyzed by RNA-sequencing (RNA-seq) to identify Giardia genes that exhibit phase-specific expression.
G. lamblia trophozoites (WB; ATCC30957, American Type Culture Collection, Manassas, Virginia, USA) were grown for 72 hr at 37°C in TYI-S-33 medium (2% casein digest, 1% yeast extract, 1% glucose, 0.2% NaCl, 0.2% L-cysteine, 0.02% ascorbic acid, 0.2% K2HPO4, 0.06% KH2PO4, 10% calf serum, and 0.5 mg/ml bovine bile, pH 7.10) [6]. For synchronization of Giardia, about 5×10⁶ cell/ml of trophozoites were cultured at 37°C in TYI-S-33 medium until reaching 80% confluence. The cultures were then added with 100 nM nocodazole (Sigma, St. Louis, Missouri, USA) and subsequently incubated for 2 hr. A fraction of the cells was harvested as G2-phase cells. For the remaining nocodazole-treated cells, the medium was replaced with TYI-S-33 medium containing 6 μm aphidicolin. After a 6 hr-incubation at 37°C, the cells were harvested as G1/S-phase cells. The growth phases of the resulting Giardia cells were confirmed by flow cytometry using propidium iodide staining (data not shown).
RNAs were extracted from 3 independent G1/S-phase and G2-phase preparations using TRIzol (Invitrogen Life Technologies, Carlsbad, California, USA), and the extracts were treated with the RNase-free DNase (Qiagen, Hilden, Germany) according to the manufacturer’s instructions. The resulting RNA samples were sent to Macrogen (Seoul, Korea) for RNA-sequencing using HiSeq4000 instrument (Illumina Inc., San Diego, California, USA).
The generated reads were mapped against the genomic DNA reference (UCSC mm10) using HISAT2 program (Johns Hopkins University, Baltimore, Maryland, USA). After read alignment, the relative transcript abundance was measured using the String Tie software (Johns Hopkins University, Baltimore, Maryland, USA), which measures the abundance of each transcript as fragments per kilobase of transcript per million mapped reads (FPKM). The 3 samples for each group (G1/S-phase or G2-phase) were analyzed as a single cluster to determine the similarity within the group. The number of clusters was independently assessed using hierarchical clustering (Euclidean method, complete linkage) to construct a heatmap. Differentially expressed transcripts were annotated and automatically annotated using the KEGG pathway analysis tool (http://www.kegg.jp/kegg/pathway.html). The generated in the RNA-seq is available at the Gene Expression Omnibus (GEO) database with the accession number GSE126731.
Three samples were analyzed for each group, and the similarity within the group was monitored (Fig. 1A). Results of one-way hierarchical clustering analyses indicated high similarity of gene expression profiles within each group. Applying strict selection criteria based on an FPKM threshold (i.e., P-value<0.05 and fold change>2 for all genes) identified 30 genes that were up-regulated at the G1/S-phase and 85 genes were up-regulated at the G2-phase (Fig. 1B).
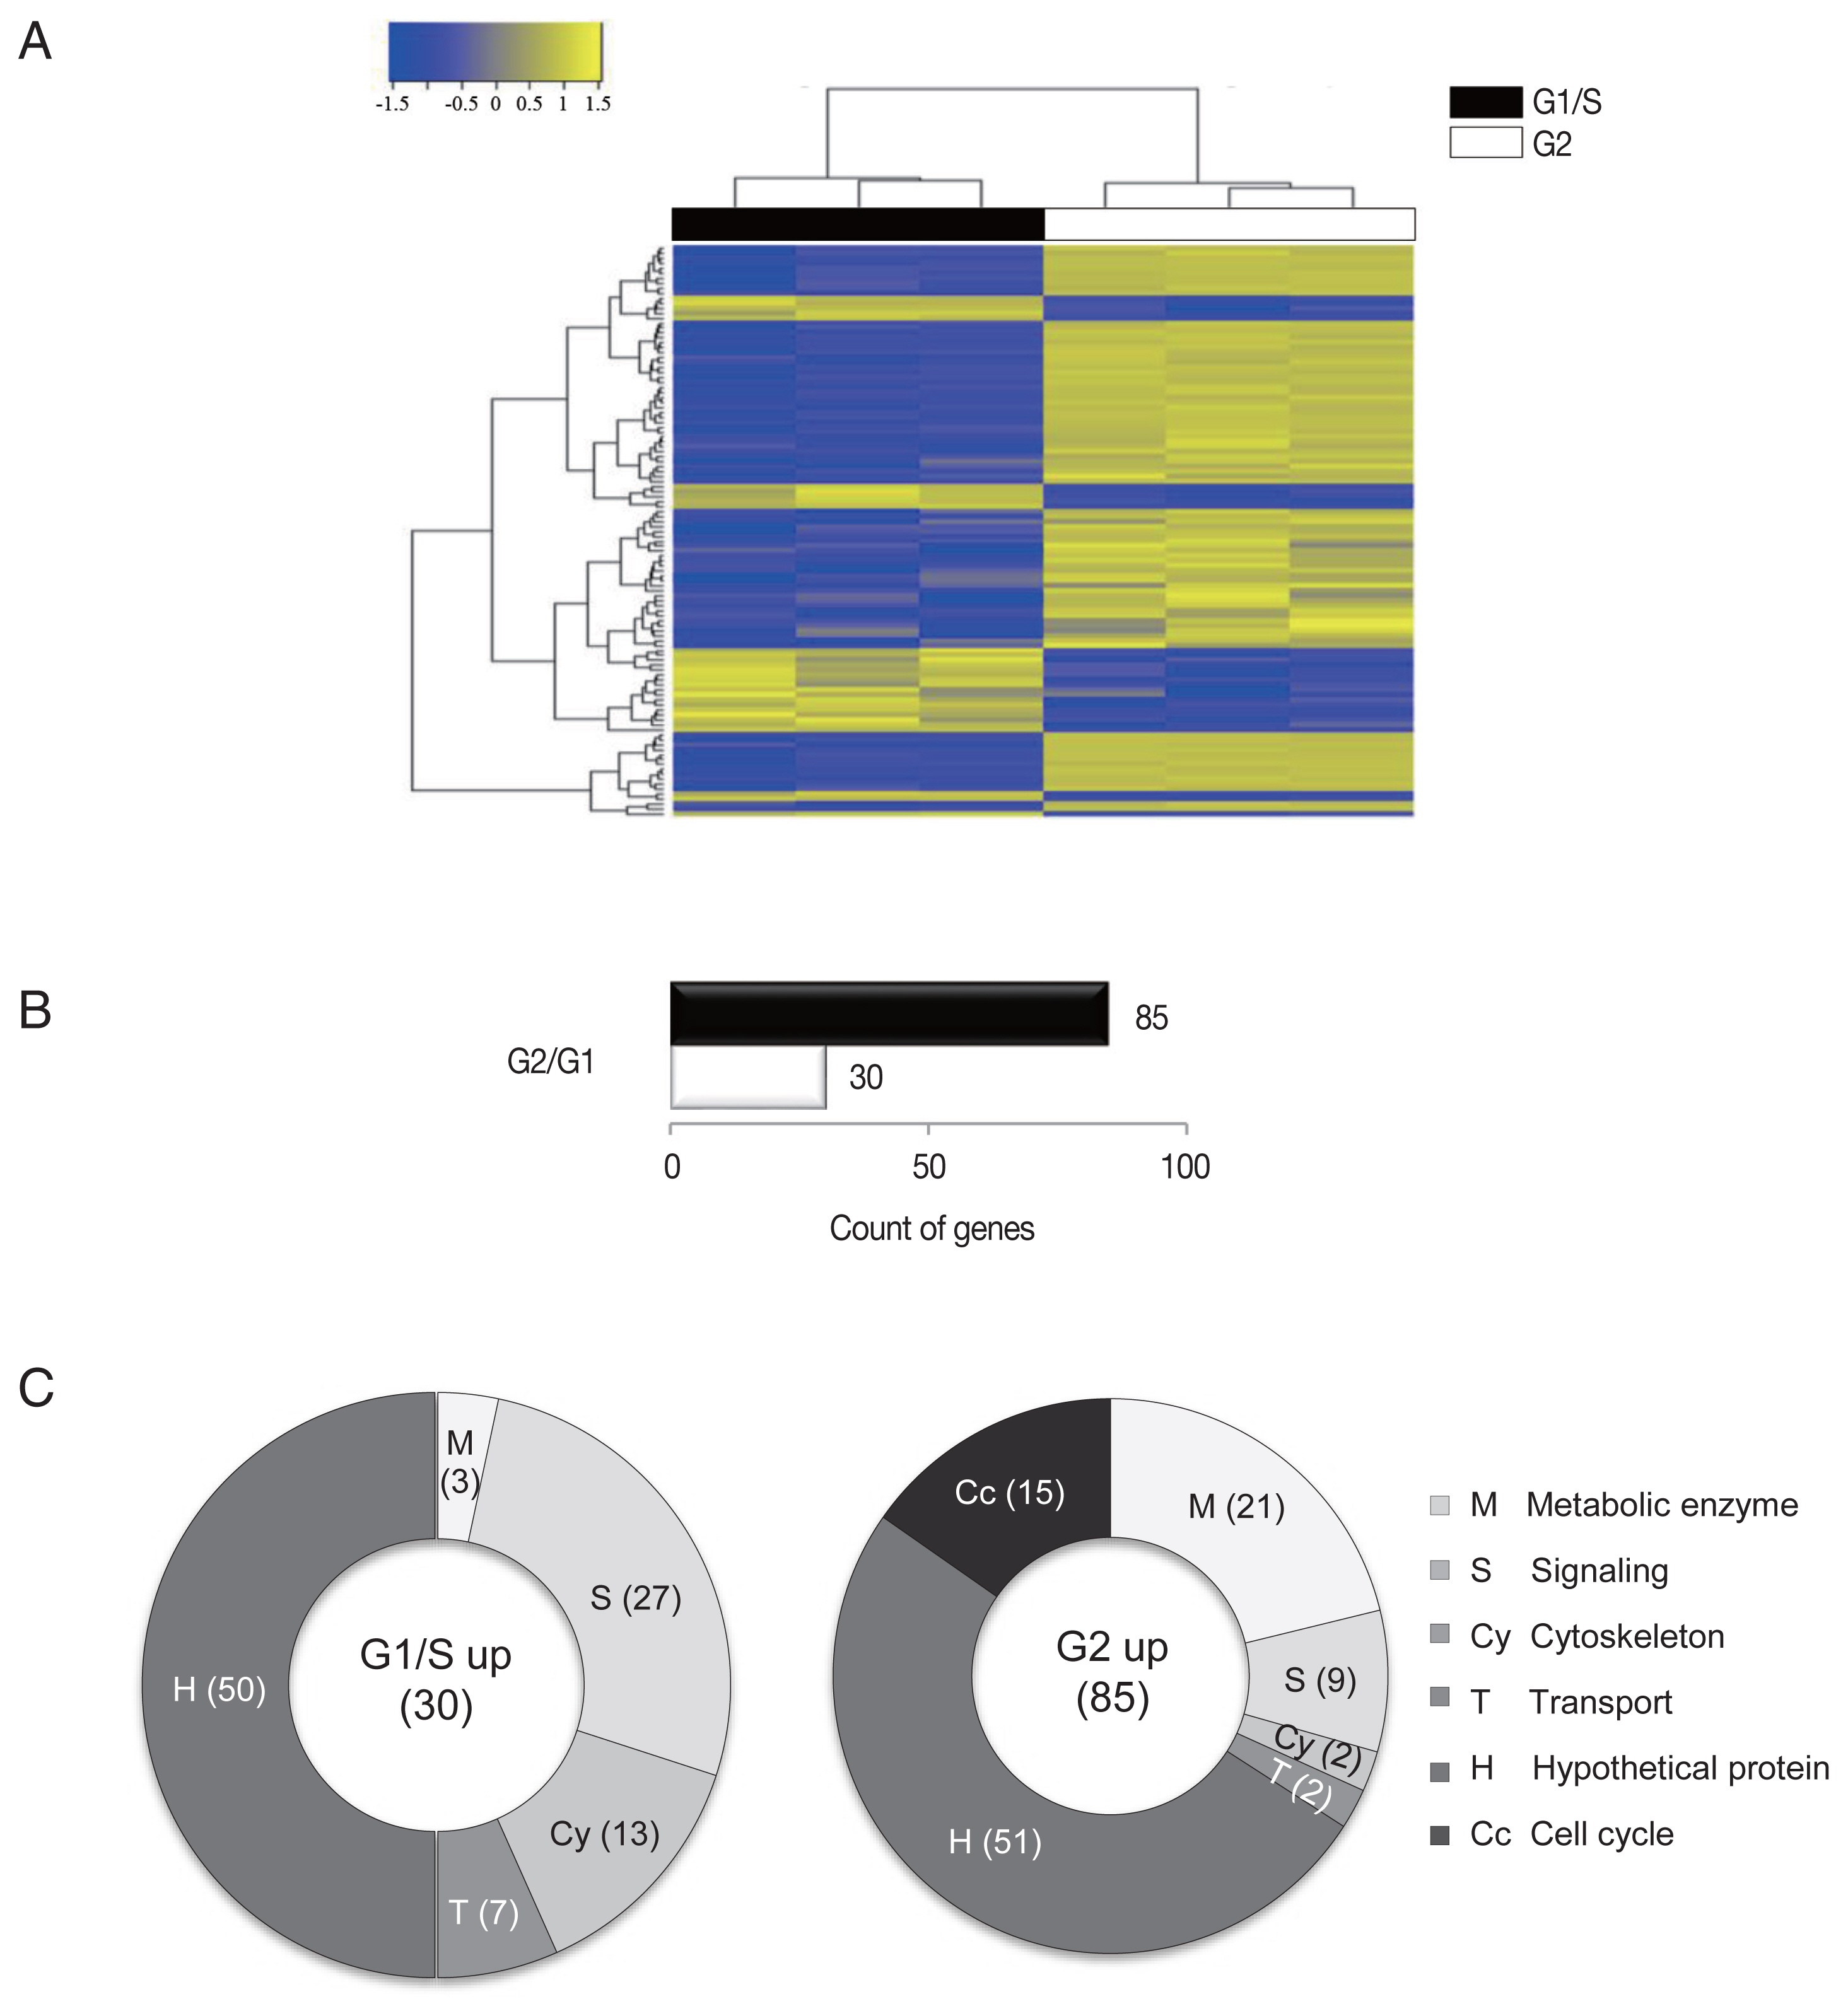
An RNA-seq analysis of G1/S-phase and G2-phase cells of G. lamblia. (A) Heatmap showing the FPKM values of all samples between the G1/S-phase and G2-phase cells of G. lamblia. Pairwise sample distances were estimated using the Euclidean distance, and sample clustering was performed using the Ward algorithm. Differentially expressed genes were ranked based on the magnitude and sign of their t-statistics. (B) The number of up-regulated genes in the G1/S-phase and G2-phase G. lamblia cells that satisfy fold change>2 and P<0.05. (C) Diagrams show the percentages of the up-regulated genes in G1/S-phase and G2-phase G. lamblia categorized based on their putative functions. Differentially regulated genes were divided into the following 6 functional categories.
The up-regulated genes were categorized into 6 groups according to their putative functions, which were presented as percentages of genes belonging to each group (Fig. 1C). In both groups, a substantial number of genes that showed altered expression profiles were found to encode hypothetical proteins (~50% of the up-regulated genes). Disappointingly, a half of the identified genes were categorized as hypothetical proteins that are difficult to find a clue in their relationship with cell cycle control of G. lamblia.
A higher number of metabolic components (ribosomal RNAs, tRNAs, and enzymes involved in nucleotide modification and ubiquitination) were found to be up-regulated in G2-phase cells (21%) than in G1/S-phase cells (3%).
By contrast, a higher number of signaling components (27%) were un-regulated in G1/S-phase cells than G2-phase cells (9%). Interestingly, a large proportion of the identified signaling components contained a high number of cysteine residues in both the G1/S- and G2-phase cells. These high cysteine-rich proteins possess additional domains that showed significant homology to growth factor receptors or variant specific surface proteins (VSPs). VSPs are a family of proteins that are expressed on the surfaces of proliferating trophozoites and are periodically replaced by another one [7]. The 2 groups showed no overlap in the identified high cysteine-rich genes, suggesting that the expression of these components switch during different phases of the G. lamblia cell cycle.
In addition, the expression levels of cytoskeletal genes (13% and 2%) were found to be up-regulated in the G1/S- and G2-phase cells, respectively. Only 2 transport genes showed increased expression in both G1/S- and G2-phase cells.
Interestingly, the up-regulation of numerous cell cycle-related genes (15%) were found to be specific to the G2-phase cells. As reported in the previous study [8], the expression levels of cyclin B and another cyclin-like protein were up-regulated at the G2-phase. Cyclin dependent kinase (CDK), which interact with cyclin B, was also up-regulated in the G2-phase cells. In addition, consistent with previously reported findings, PcnA expression was up-regulated in the G2-phase cells [4]. PcnA is recognized as an essential component of the DNA replication clamp, which monitors DNA replication errors [9]. Mammalian PcnA interacts with the CDC25 protein (M-phase inducer phosphatase 3) during the G2/M phase [10] and has been shown to interact with mitotic cyclins [11]. The above results suggested that PcnA plays a similar role in Giardia.
In eukaryotic cells, cell cycle progression to the mitotic stage requires the formation of mitotic spindles between 2 centrosomes, and correct spindle formation is checked by the mitotic checkpoint complex (MCC) along with the anaphase promoting complex/cyclosome (APC/C) [12]. In Giardia, the checkpoint system is known to comprise a minimal set of proteins, including Mad2, Bub3, and Mps1 [13], but lack of the canonical APC/C [8]. Depletion of Mad2 leads to abnormal cell division in Giardia suggesting that MCC has a function that is independent from APC/C and ubiquitination [13]. This hypothesis is supported by our results showing that Mad2 is up-regulated in the G2-phase clones and indicated that the MCC play a role in cell cycle control via a novel and an unidentified mode of action. In addition, a putative spindle pole gene was found to be up-regulated in G2-phase cells. The role of the abovementioned proteins in mitosis in G. lamblia should be investigated.
Interestingly, 3 never-in-mitosis A related kinases (NEKs) were also found to be up-regulated clones in G2-phase clones. NEKs are a group of kinases involved in cell division and cell motility [14]. Different organisms have variable numbers of NEKs ranging from 1 to 40, and the functions of these NEKs are known to be redundant and pleiotropic. Several NEKs exert their function in interactive and cascade modes. The Giardia genome was found to harbor 198 NEK homologs, the highest number reported among eukaryotic organisms [15]. Therefore, the role of NEK(s) is important in cell division and flagella biogenesis. Our current findings suggested that these identified NEKs are not pseudogene and play roles in cell cycle control in G. lamblia.
Overexpression of these genes in the G1/S- or G2-phase based on RNA-seq was confirmed by quantitative real-time PCR (qRT-PCR). Five micrograms of RNA (derived from G1/S-phase and G2-phase cells) was converted into complementary DNA (cDNA) using an Improm-II reverse transcription system (Promega, Madison, Wisconsin, USA). qRT-PCR was performed using the LightCycler system and the LightCycler 480 SYBR Green I Master Kit (Roche Applied Science, Mannheim, Germany). The amplification conditions for qRT-PCR were as follows: pre-incubation at 95°C for 5 min followed by 45 cycles of 94°C for 1 min, 56°C for 1 min, and 72°C for 1 min. The nucleotide sequences of the forward and reverse primers used for real-time PCR are listed (Supplementary Table S1). The expression level of the G. lamblia actin-related protein (glactin; GiardiaDB no. GL50803_15113) transcripts were used to normalize the mRNA expression in the cDNA samples. Data were analyzed following the relative quantification method by determining the crossing point (Cp) value using the Light Cycler 480 II real-time PCR system software program (Roche Applied Science, version LSC480 1.5.0.39). Results were expressed as means±standard deviations of 3 independent experiments.
For the G1/S-phase genes, 7 up-regulated clones (5 high cysteine-rich proteins and 2 kinesin-3 proteins) were selected and analyzed by qRT-PCR for validation (Fig. 2A). As expected, only 2 high cysteine proteins, namely, GL50803_17212 and GL50803_91707, demonstrated higher expression at the G1/S-phase than in the G2-phase. Five independently selected clones showed similar expression profiles during the G1/S- and G2-phases. We selected a total of 20 genes that were up-regulated during the G2 phase based on RNA-seq, and their relative transcription levels between the G1/S- and G2-phase were monitored (Fig. 2B). Except for 3 genes encoding hypothetical proteins, the remaining genes were up-regulated at the G2-phase relative to the G1/S-phase. The 13-cell cycle-related genes that were up-regulated at the G2-phase based on RNA-seq were verified by qRT-PCR.
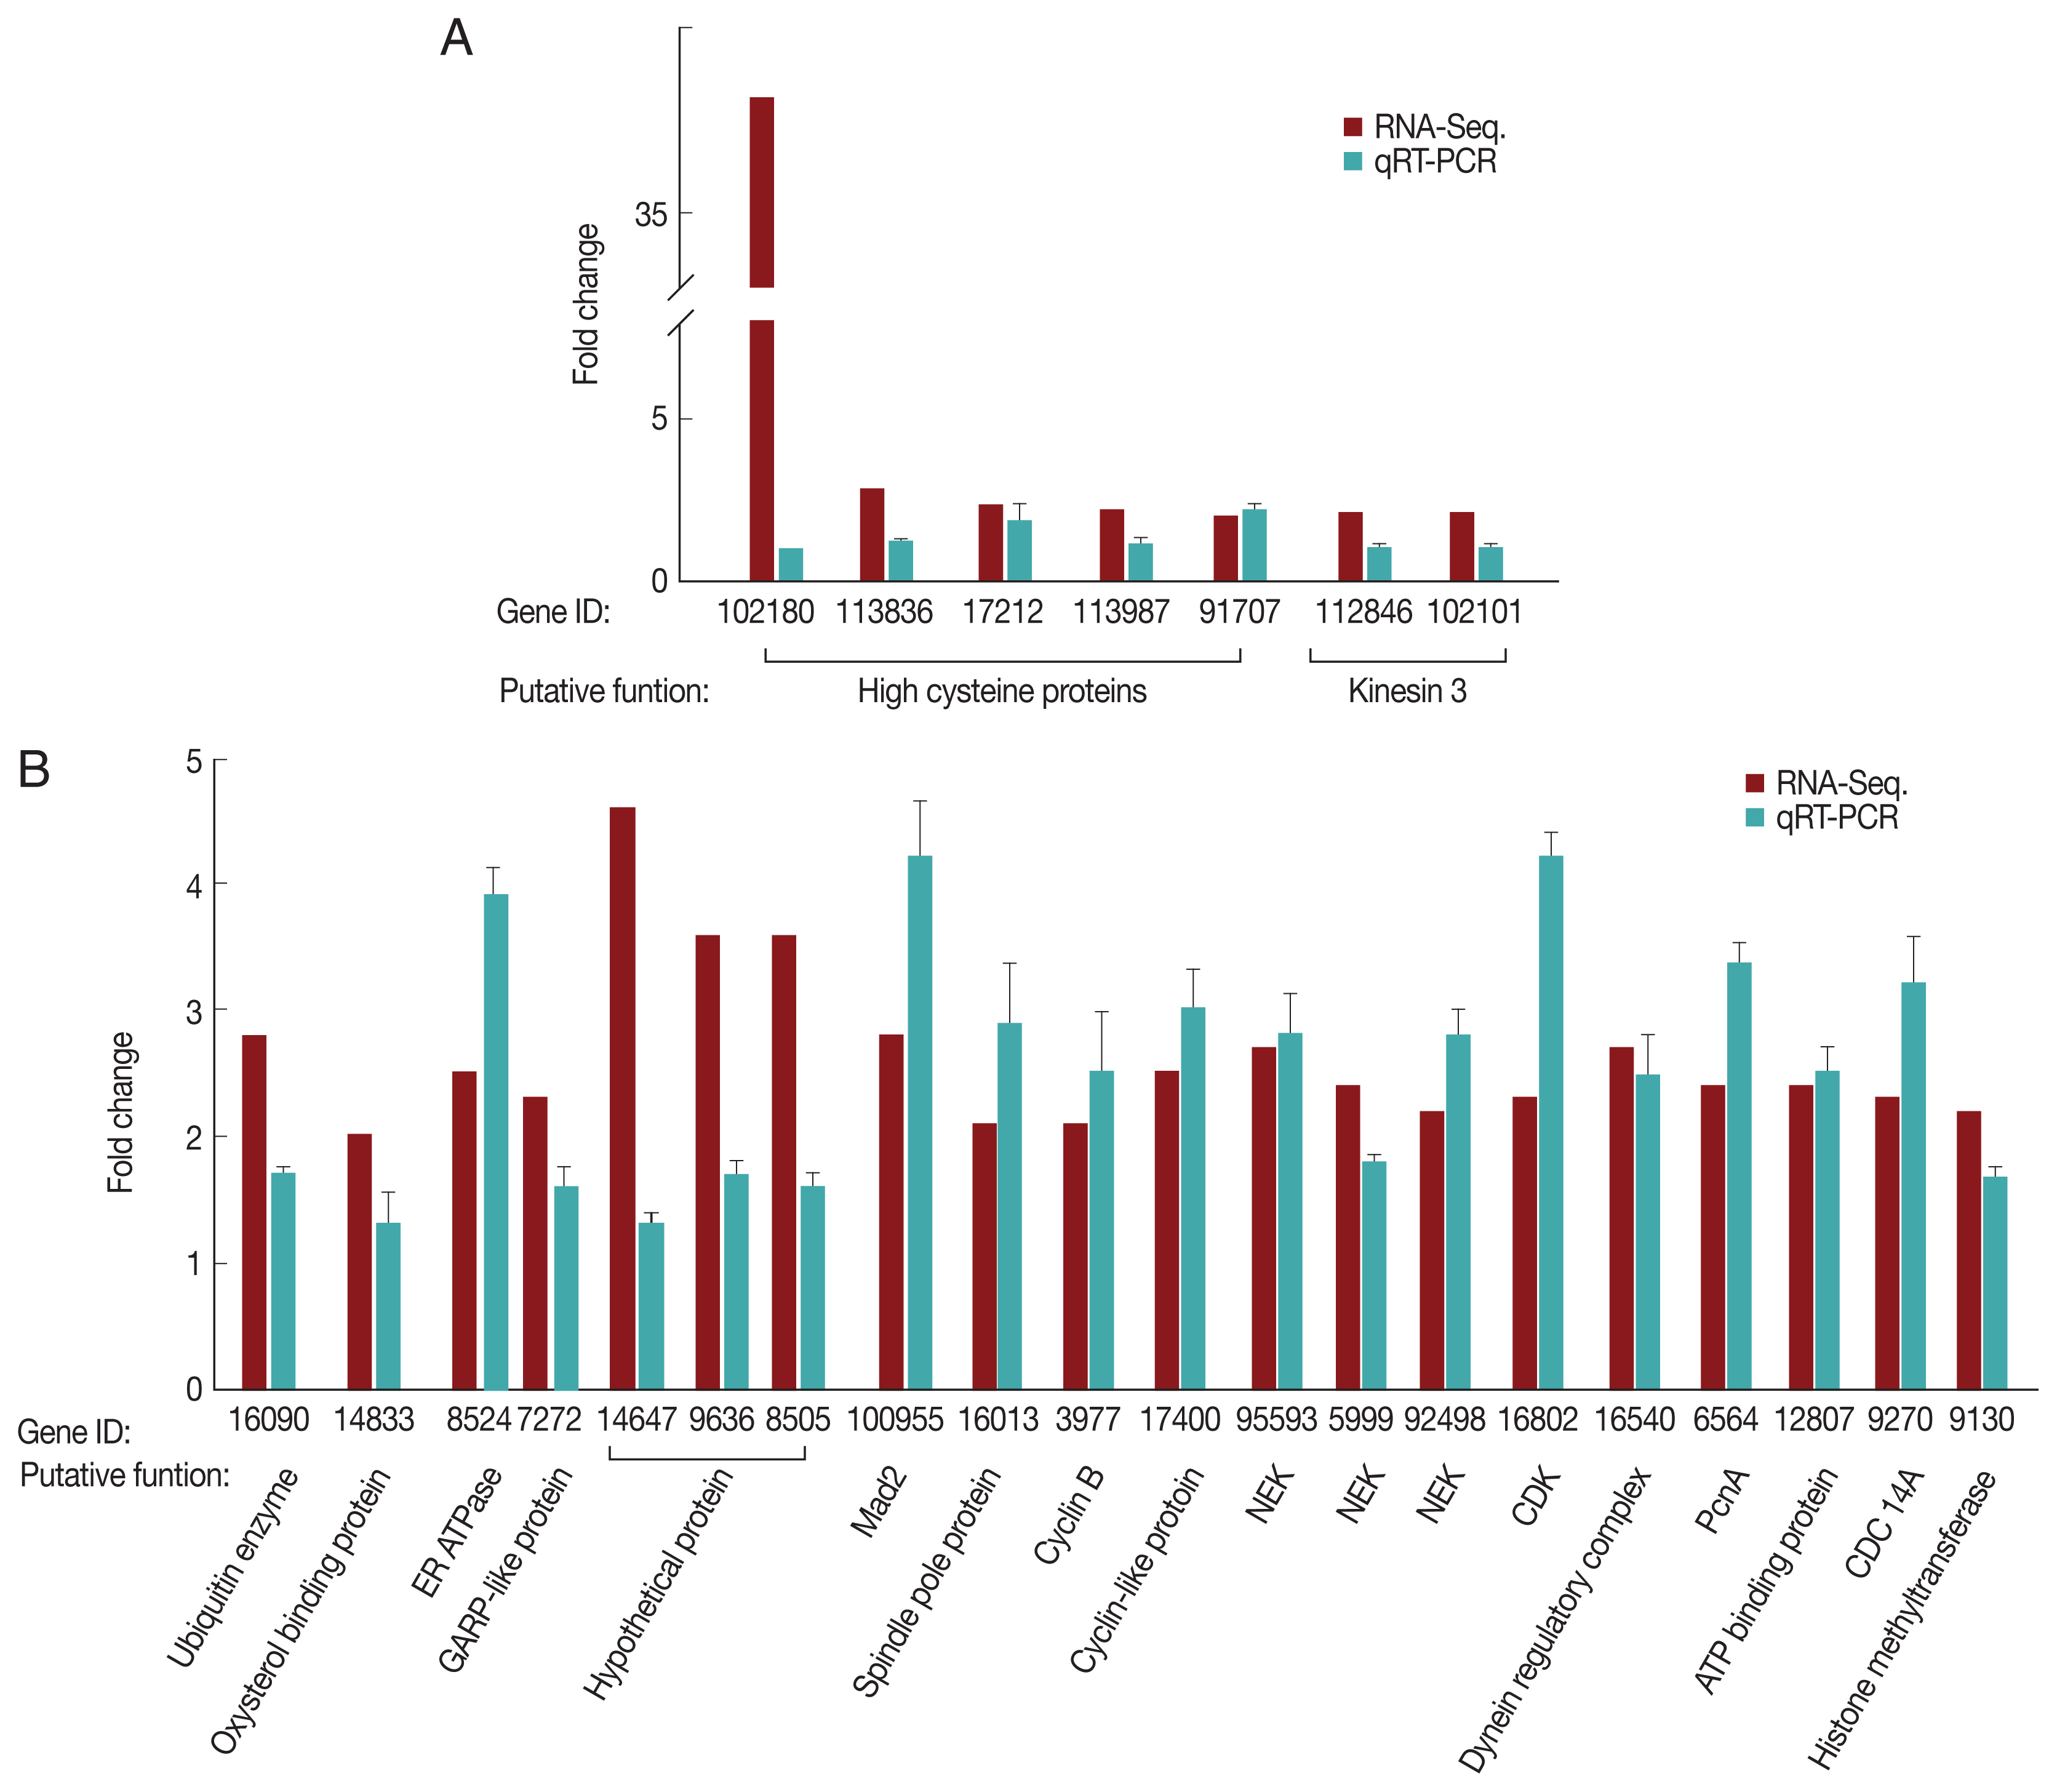
Quantitative measurement of transcripts up-regulated during the G1/S-phase (A) and G2-phase (B). G. lamblia trophozoites at the G1/S-phase or G2-phase were harvested for RNA isolation using TRIzol. RNA extracts were treated with RNase-free DNase. cDNA was synthesized using Prime-Script RT reagent kit and analyzed by qRT-PCR on a Light Cycler 480 II real-time PCR system, using the Light Cycler 480 DNA SYBR green I master kit. Actin-related gene was used as an internal control for normalization of expression levels. Data were analyzed following the relative quantification method by determining the Cp value.
Our current findings indicated that the cell cycle control machinery is conserved in G. lamblia, which belongs to the earliest lineage of eukaryotic cells. RNA-seq analysis of Giardia cells at G1/S- and G2-phase cells suggested possible roles of various cell cycle components, such as PcnA, cyclin B, and CDK, in cell cycle control of G. lamblia. In addition, the list of cell cycle components of G. lamblia was extended through the finding of NEKs, Mad2, spindle pole protein, and CDC14A as up-regulated proteins at G2-phase.
Supplementary Information
Primer sequence used for qRT-PCR
ACKNOWLEDGMENTS
This research was supported by the Basic Science Research Program (2015R1D1A1A09057595 to S-J. Park) and the Research Fellow Program (2016R1A6A3A11933823 to J. Kim) through the National Research Foundation of Korea (NRF) funded by the Ministry of Education of Korea. This research was supported by a faculty research grant of Yonsei University College of Medicine (6-2018-0036 to S-J. Park).
Notes
CONFLICT OF INTEREST
The authors declare that they have no conflict of interest.