Bile Ductal Transcriptome Identifies Key Pathways and Hub Genes in Clonorchis sinensis-Infected Sprague-Dawley Rats
Article information

Abstract
Clonorchis sinensis is a food-borne trematode that infects more than 15 million people. The liver fluke causes clonorchiasis and chronical cholangitis, and promotes cholangiocarcinoma. The underlying molecular pathogenesis occurring in the bile duct by the infection is little known. In this study, transcriptome profile in the bile ducts infected with C. sinensis were analyzed using microarray methods. Differentially expressed genes (DEGs) were 1,563 and 1,457 at 2 and 4 weeks after infection. Majority of the DEGs were temporally dysregulated at 2 weeks, but 519 DEGs showed monotonically changing expression patterns that formed seven distinct expression profiles. Protein-protein interaction (PPI) analysis of the DEG products revealed 5 sub-networks and 10 key hub proteins while weighted co-expression network analysis (WGCNA)-derived gene-gene interaction exhibited 16 co-expression modules and 13 key hub genes. The DEGs were significantly enriched in 16 Kyoto Encyclopedia of Genes and Genomes pathways, which were related to original systems, cellular process, environmental information processing, and human diseases. This study uncovered a global picture of gene expression profiles in the bile ducts infected with C. sinensis, and provided a set of potent predictive biomarkers for early diagnosis of clonorchiasis.
INTRODUCTION
Cholangiocarcinoma (CCA) is a rare but aggressive malignancy, with a 5-year survival rate lower than 10% [1]. It arises from the bile duct epithelium and can be classified as either intrahepatic CCA or extrahepatic CCA. Several identifiable risk factors for CCA have been identified; among these, Clonorchis sinensis has been regarded as a group 2 biological carcinogen which can induce human CCA by the International Agency for Research on Cancer (IARC) [2]. Both experimental and epidemiological studies convincingly implicate C. sinensis infection is associated with the etiology of CCA [3]. Persistent infection and chronic inflammation caused by the liver fluke have recognized as the major risk factor for CCA [4].
Although the effects of the liver fluke infection on host physiology and host responses have been reported previously [5], only limited information is currently available on the underlying molecular mechanisms for bile duct changes including CCA induced by C. sinensis infection. Previous reports on the time-dependent host responses to C. sinensis itself, and its excretory and secretory products (ESPs) are still scarce and variable responses among the experimental animals [6,7]. In these points, investigation on the underlying molecular pathological events in the bile ducts infected with C. sinensis is important to understand pathology of clonorchiasis as well as to unveil reliable diagnostic markers and drug targets to control the infections and to prevent serious complications by the liver fluke, especially in the high endemic areas [8,9].
Protein-protein interaction (PPI) networks or co-expression networks are very informative to investigate the relationships between disease and genes/proteins, and hence are helpful to identify molecular mechanisms occurring in the certain disease [10]. Most genes/proteins generally play together for biological tasks. It has been presumed that diverse host-parasite interactions (HPIs) are communicated with receptor-mediated events.
In the present study, overall patterns of significant functional genes and gene sets expressed in the bile ducts of experimental rats infected with C. sinensis were analyzed to understand molecular pathophysiological events in bile ducts. Understanding differential expressions of diverse gene sets in the C. sinensis-infected bile ducts might shed light on the underlying mechanism of carcinogenesis in bile ducts induced by the liver fluke infection.
MATERIALS AND METHODS
Parasites, experimental animals and infections
Clonorchis sinensis metacercariae were collected from naturally infected intermediate host, Pseudorasbora parva, as described previously [11,12]. Sprague-Dawley (SD) rats (female, 160–180 g; 6 weeks) were infected with the parasite by oral feeding 100 metacercariae. C. sinensis infection was validated in all challenged SD rats by observing C. sinensis worms in bile ducts when sacrificed. Bile duct tissues of SD rats were surgically removed at 2 weeks (2W; n=2) and 4 weeks (4W; n=3) after infection and normal control (NC; n=3) groups under microscopy. Subsequently, the bile duct tissue samples were gently washed five times with sterile cold physiological saline to remove any other tissues and parasites, and were used immediately for RNA isolation.
RNA isolation and quality assessment
Total RNA was isolated from each bile duct tissue sample using the TRI Reagent (MRC, Cincinnati, Ohio, USA) according to the protocols of manufacturer and then was dissolved in RNase-free-water. RNA samples were quantified, divided into aliquots and stored at −80°C until use. The quality of RNA was assessed by analyzing RNA purity and integrity with a NanoDrop ND-1000 spectrophotometer (Thermo Scientific, Waltham, Massachusetts, USA) and a 2100 Bioanalyzer (Agilent Technologies, Santa Clara, California, USA).
Labeling and hybridization of microarray
Microarray hybridization was performed as described below. Cyanine-3 labeled complementary RNA (cRNA) was prepared from 1 μg RNA using the One-Color Low RNA Input Linear Amplification PLUS Kit (Agilent Technologies) according to the manufacturer’s instructions followed by RNAeasy column purification (Qiagen, Valencia, California, USA). Dye incorporation and cRNA yield were checked with the NanoDrop ND-1000 Spectrophotometer (Thermo Scientific). The labeled cRNA sample was hybridized on a Whole Rat Genome Microarray 4×44K v3 (Probe Name version, Design ID #028282, GPL14746 platform, Agilent Technologies) using a Gene Expression Hybridization Kit (Agilent Technologies) following the manufacturer’s instructions.
Data preprocessing and normalization
After washing the hybridized slides with GE washing buffer, the dried slides were scanned with an Agilent Microarray Scanner (G2505C). Feature extraction software v10.5.1.1 employing default for all parameters was used to convert the scanned images into signal intensities. Spots judged as sub-standards by visual examination of each slide were flagged and excluded for further analysis. The raw data were processed based on the Agilent normalization method using the Babelomics v5 [13], and normalized to 27,078 probe IDs excluding missing data and subsequently the values were transformed to log base 2. Gene expression data were deposited to NCBI’s Gene Expression Omnibus (GEO) database [14] and are accessible through GEO Series accession number GSE136575. For further analysis, gene expression data were adjusted through quantile normalization [15] and then standardized using EXPression ANalyzer and DisplayER (EXPANDER) v8.0 [16].
Statistical analysis
Multi Experiment Viewer (MeV) v4.8 [17] was used to test the effect of a factor (infection duration) on gene expression. One-way analysis of variance (ANOVA) tests were performed on 27,078 normalized probes using P-values based on permutation (1,000 permutations per probe) with an overall threshold set to 0.05. The Post-hoc Tukey’s HSD multiple comparison tests were applied to identify significant differences among the sample groups using Tukey R-package [18]. Differentially expressed genes (DEGs) were identified using Linear Models for Microarray Data (LIMMA) R-package [19] with log2 Fold Change (log2FC)≥1 and adjusted P-value cut-off of 0.05 as implemented in the integrated Differential Expression and Pathway analysis (iDEP) v90 [20]. Agilent probe IDs were converted into Ensembl gene IDs and gene symbols using the biological DataBase network (bioDBnet) [21] and HUGO Gene Nomenclature Committee (HGNC) Mart (https://biomart.genenames.org). Probe sets without any annotation or having duplicated gene symbols were filtered out. All significant DEGs were analyzed for their intersections among the different sample groups using the web tool (https://bioinfogp.cnb.csic.es/tools/venny/).
Unsupervised analysis based on gene expression
To identify genes clustering in C. sinensis-infected and uninfected normal samples, hierarchical clustering (HCL) and principal components analysis (PCA) were performed between genes (n=2,419) and between samples (n=6), respectively. It was applied to probe sets having statistical significance using the iDEP v90 [20] with average linkage clustering using Pearson’s correlation as similarity metric. HCL was visualized as a dendrogram based on gene and sample distances simultaneously.
Pattern analysis of time series expression data
Time course data were analyzed using Short Time-series Expression Miner (STEM) [22]. STEM clustering method was applied with rat genome database (https://rgd.mcw.edu), maximum number (50) of model profiles and maximum unit change (3) between two time points. Probes were filtered out with minimum absolute expression change (1) based on maximum-minimum parameter. The 50 permutations per gene was applied and the P-value was corrected using the Bonferroni correction where the significance level is divided by the number of model profiles. The P-values less than 0.001 were considered to be statistically significant. Similar model profiles were significantly clustered each other with minimum correlation of 0.8.
Protein-protein interactions (PPI) and sub-networks among DEG products
PPI networks for top 400 DEGs were constructed using the Search Tool in the Retrieval of Interacting Genes/Proteins (STRING) database v11.0 [23]. PPIs included direct and indirect interactions derived from three connection sources, such as “Experiments”, “Databases”, and “Co-expression”. The minimum interaction parameter was set as a medium confidence threshold of 0.4. The PPI networks were imported into Cytoscape v3.7.2 [24] using the StringApp v1.5.1 plug-in [25]. Significant sub-networks were explored using the ClusterONE v1.0 plug-in [26] with a minimum size of 5 and remaining parameter as the default. Gene Ontology (GO) enrichment analysis of DEGs in each cluster was carried out using the ClueGo v2.5.7 plug-in [27]. Significantly enriched pathways (P<0.05) were visualized using CluePedia v1.5.7 plug-in [28]. Hub proteins were chosen using the cytoHubba v0.1 plug-in [29] with Maximal Clique Centrality (MCC) method. All networks were visualized in the Edge-weighted Spring Embedded Layout.
Co-expressed genes modules and networks construction
Co-expression networks and modules were identified using Weighted Gene Co-expression Network Analysis (WGCNA) R-package [30]. To minimize noise in the correlation matrix, a soft threshold of 18 was chosen for the limited number of samples according to the recommendation [31] and set the minimum module size to 200 genes. Genes in each module within each network were analyzed for enriched GO gene sets using Gene Set Enrichment Analysis (GSEA) [32] with a minimum module size filter of 20 and default Edge threshold of 0.4. The module networks were imported into the Cytoscape [24] and hub genes were visualized with the cytoHubba plug-in as described above.
Kyoto Encyclopedia of Genes and Genomes (KEGG) pathways enrichment and visualization
KEGG enrichment analysis of all DEGs having statistical significance was performed and the matched genes were mapped on the KEGG pathways using PaintOmics v3 [33]. KEGG enrichment results were plotted using FuncTree [34]. Image was labeled and formatted using Inkscape graphics software v1.0beta2 (http://www.inkscape.org).
RESULTS
Microarray preprocessing and normalization
An integrative bioinformatic analysis of microarray data was performed to investigate transcriptional regulation of co-expression genes and pathway-related genes in the bile ducts of SD rats involving C. sinensis infection (Fig. 1). At first, all probe datasets (n=8) were within-array normalized by the Agilent normalization; NC (n=3), 2W (n=2) and 4W (n=3) of C. sinensis. Among them, NC_3 and 4W_1 samples were excluded because they didn’t closely match to the corresponding experimental group with preliminary PCA and HCL (data now shown). Remaining data were log2-transformed, performed between-array normalization by the quantile normalization method, and finally standardized (normalization of each expression pattern to have a mean of 0 and a variance of 1).
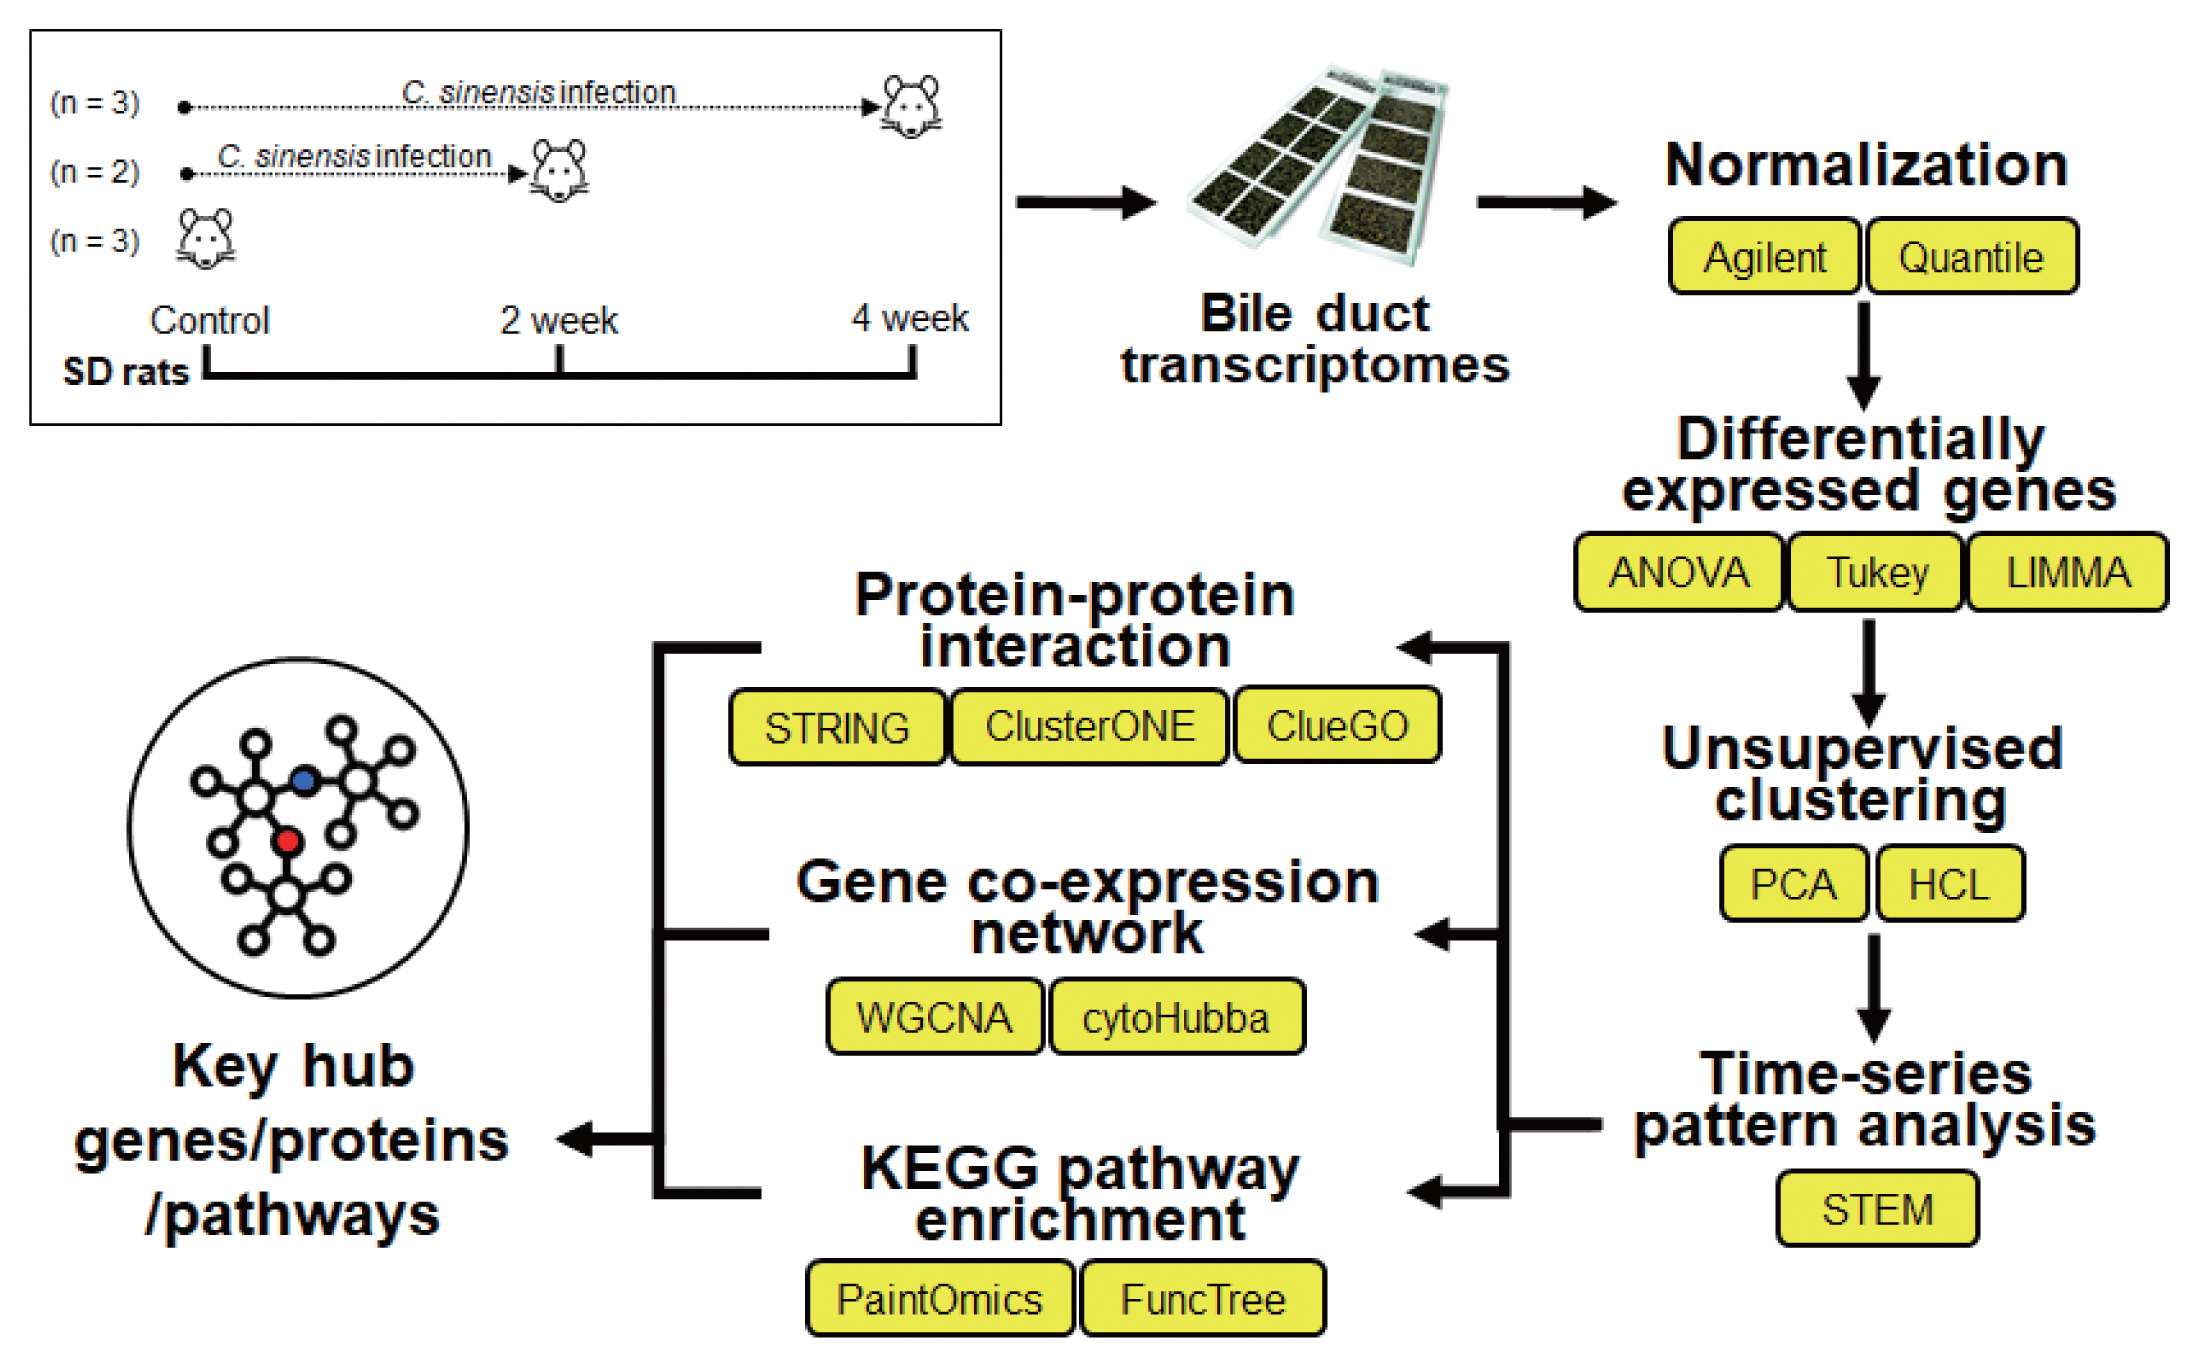
A workflow of this study.
A large number of significant DEGs altered at early phase
After preprocessing, group-wise comparisons were carried out using one-way ANOVA test at each time point after C. sinensis infection. The group comparisons revealed significant gene expression changes between each group; statistically significant 2,895 genes (P<0.05) were survived across 27,078 normalized time course probes. The observed differences between any two groups were confirmed to be significant using post-hoc Tukey’s HSD tests [18] (Table 1). A total of 2,419 DEGs were chosen to be significantly altered in C. sinensis-infected groups compared to NC, |log2FC|≥1 and P<0.05 in at least one infection condition, as identified by LIMMA [19]. All probes of all samples including DEGs in any condition were further analyzed with unsupervised PCA and HCL to validate array quality and sample level variances. The PCA plot visually indicated that 2W and 4W were separated from NC along Principal Component 1 (PC1), accounting for 66% of the variations in C. sinensis-infected groups (Fig. 2A). Three distinctive clusters corresponding to each biological group were identified based on the transcriptional profiles. The relative position of the samples demonstrates a higher correlation in intragroup than intergroup conditions, revealing an early qualitative and quantitative alterations of gene transcripts. These demonstrate that transcriptional differences compared to NC were greater at 2W than at 4W.
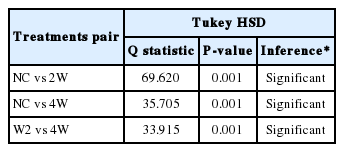
Post-hoc Tukey HSD results showing multiple comparisons (n=2,895)
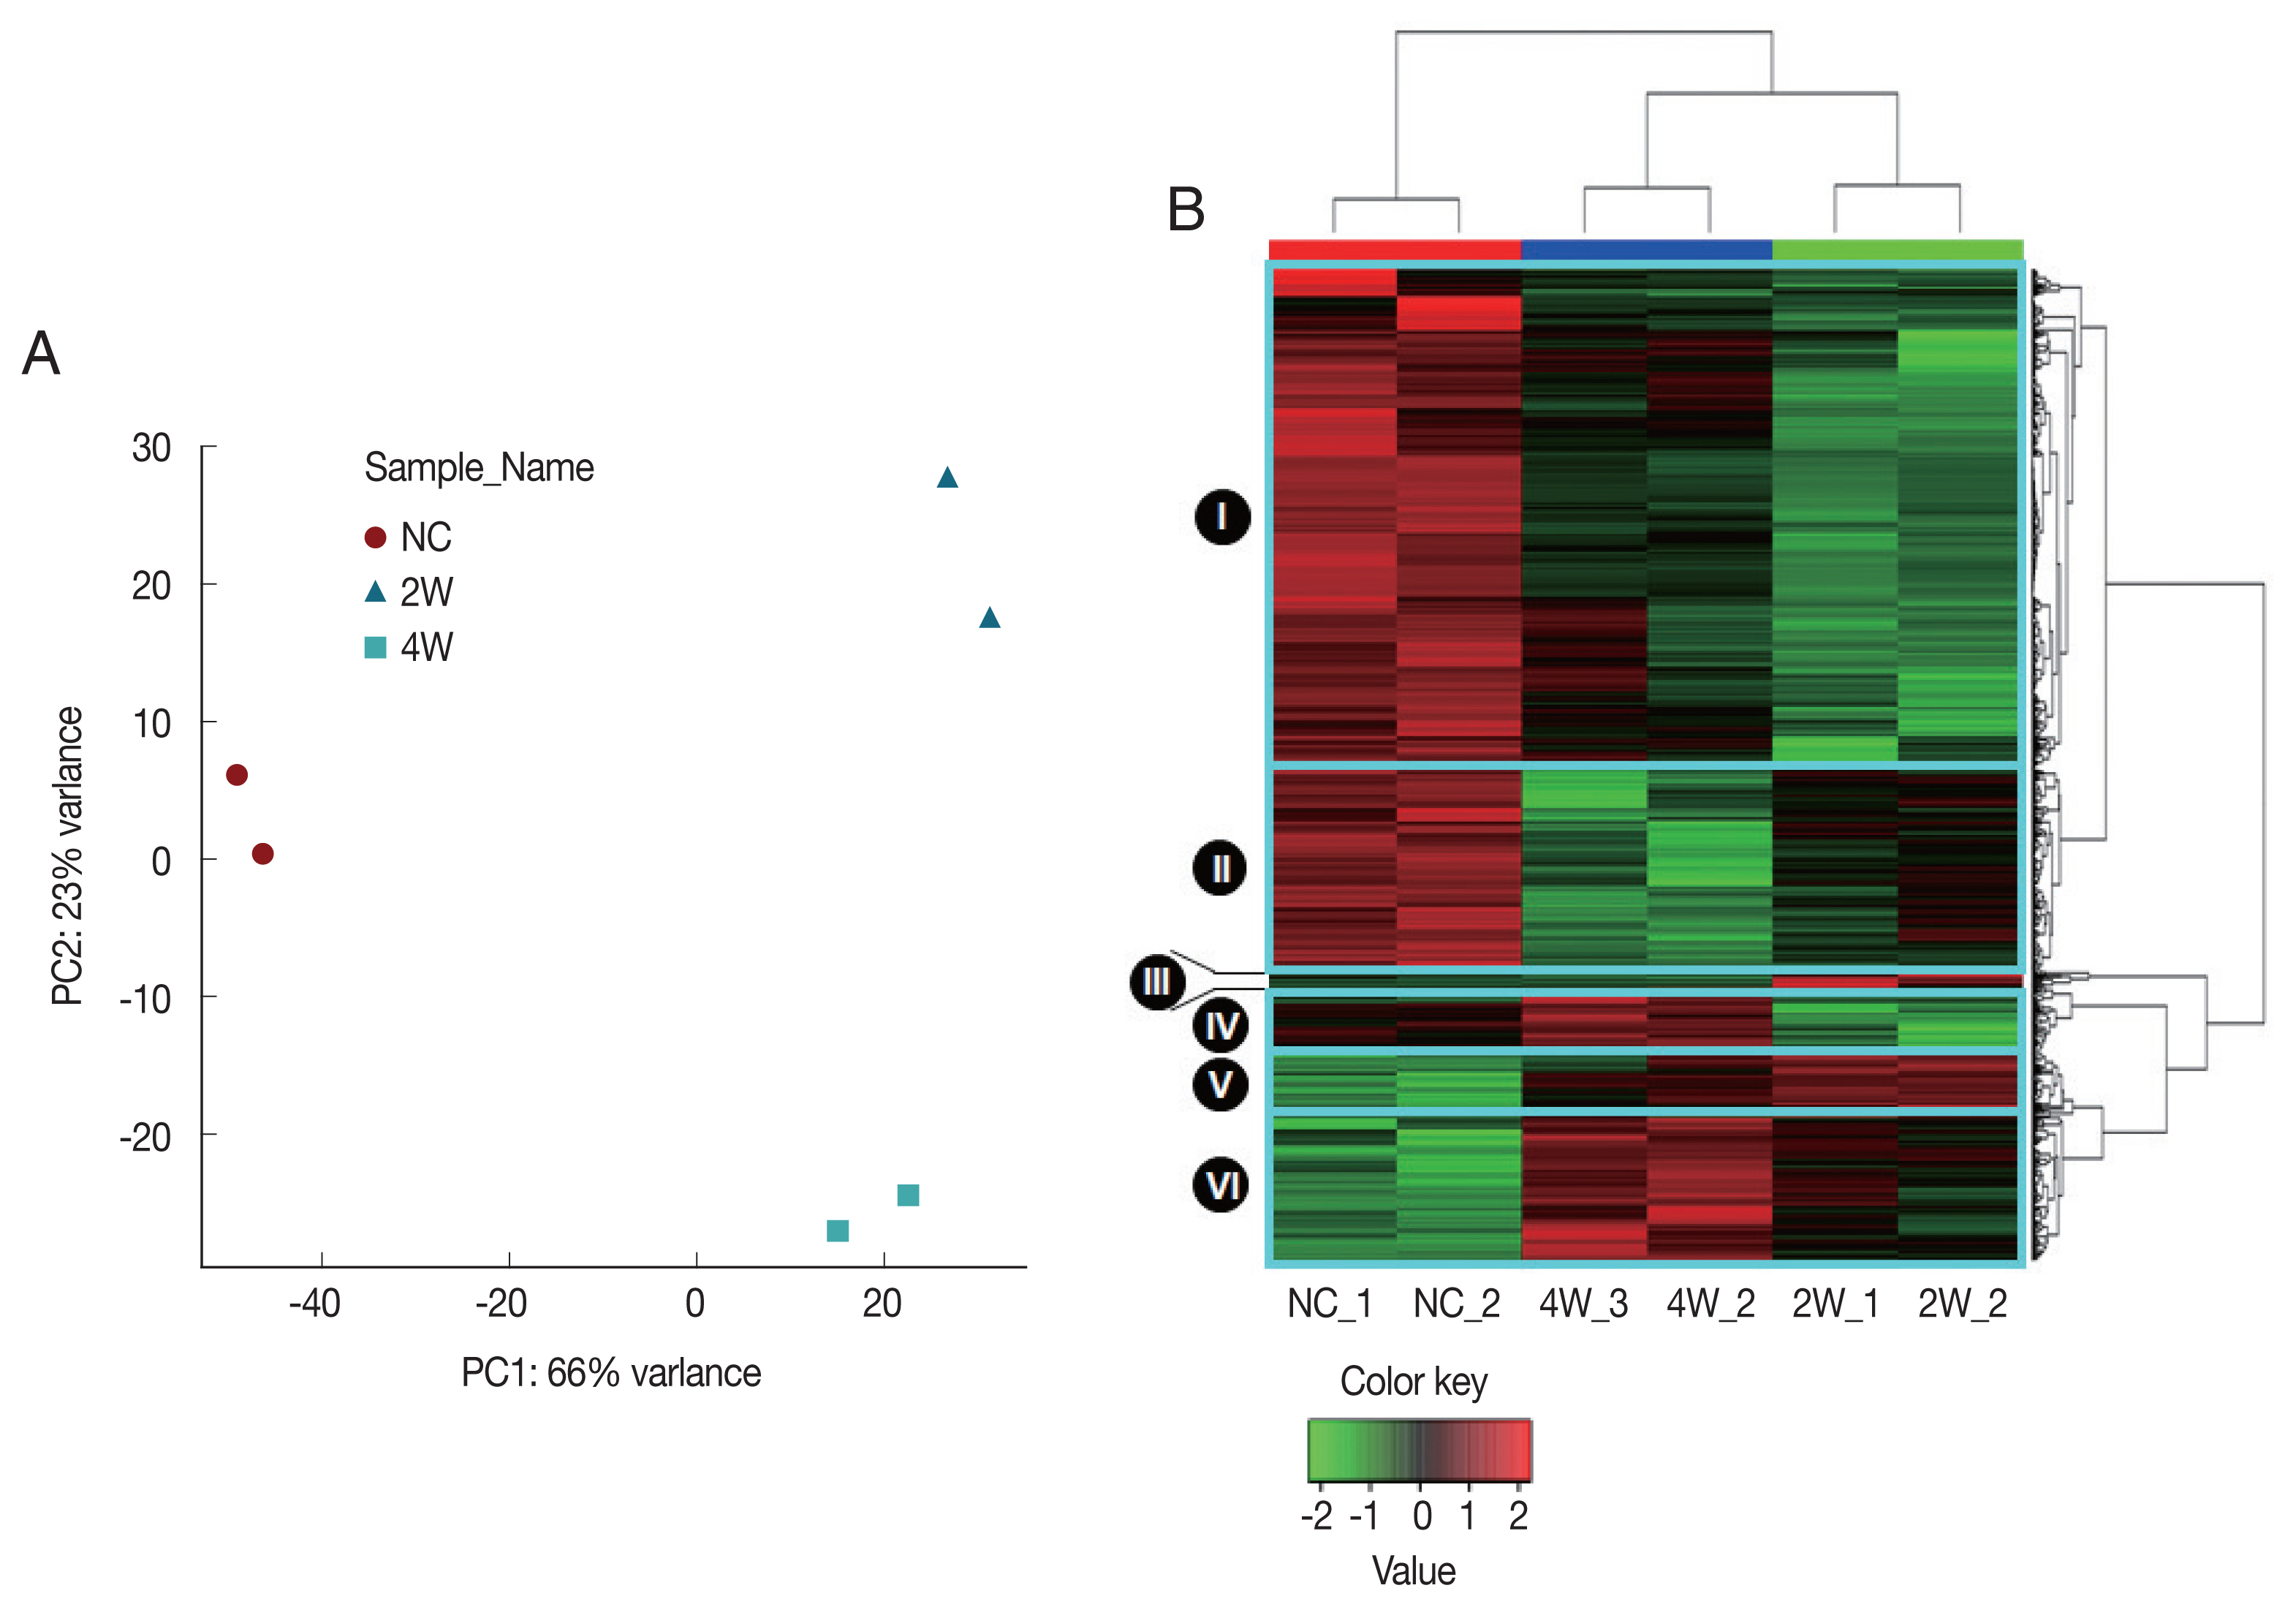
Unsupervised discrimination of different groups based on rat bile duct gene expression profiles. All sample groups were discriminated clearly based on the DEGs using (A) principal components analysis (PCA) and (B) hierarchical clustering (HCL). The dendrograms were generated based on HCL of correlation distance between individual microarray expression profiles. NC, normal control; 2W and 4W, 2 and 4 weeks post-infection with C. sinensis.
Monotonically changing genes and temporally dysregulated genes in C. sinensis infected groups
Similar gene expression patterns were also observed in the HCL, in which gene expression profiles split 2W and 4W versus NC (Fig. 2B). Three distinct major regulation features were observed; (1) a major number of genes in the clusters I and II were highly expressed in NC, but down-regulated at 2W and 4W, (2) expressions of some genes in the clusters II and VI were monotonically increased or decreased during the infection (monotonically changing DEGs). (3) some genes in the clusters I, III, IV and V were temporally dysregulated in C. sinensis infection (Fig. 2B).
Time-series profiling of monotonically changing DEGs
Given the 1,771 DEGs (only genes having Ensembl gene IDs [35]), genes with highly similar response profiles were sought using the STEM [22]. The DEGs were clearly clustered into seven profiles based on expression patterns over time in C. sinensis infection (Fig. 3). A large percentage of 1,037 DEGs were significantly overrepresented in the Profiles 32, 31, 21, and 33 (P<0.05), in which gene expression levels were temporally dysregulated. Among these, 699 genes of the Profiles 32 and 33 were suppressed at 2W but induced at 4W. Meanwhile, 271 genes showed monotonically decreasing expression (MDE) patterns in Profile 34 (P<0.05) over the time course of infection and 248 genes revealed monotonically increasing expression (MIE) patterns in Profiles 7 and 18 (P<0.05). These genes showing monotonically changing expression patterns are considered to be core responses induced by C. sinensis infection. These findings indicate more robust transcriptional changes occur at early stage of infection (2W), such as Profiles 32, 31, and 21.
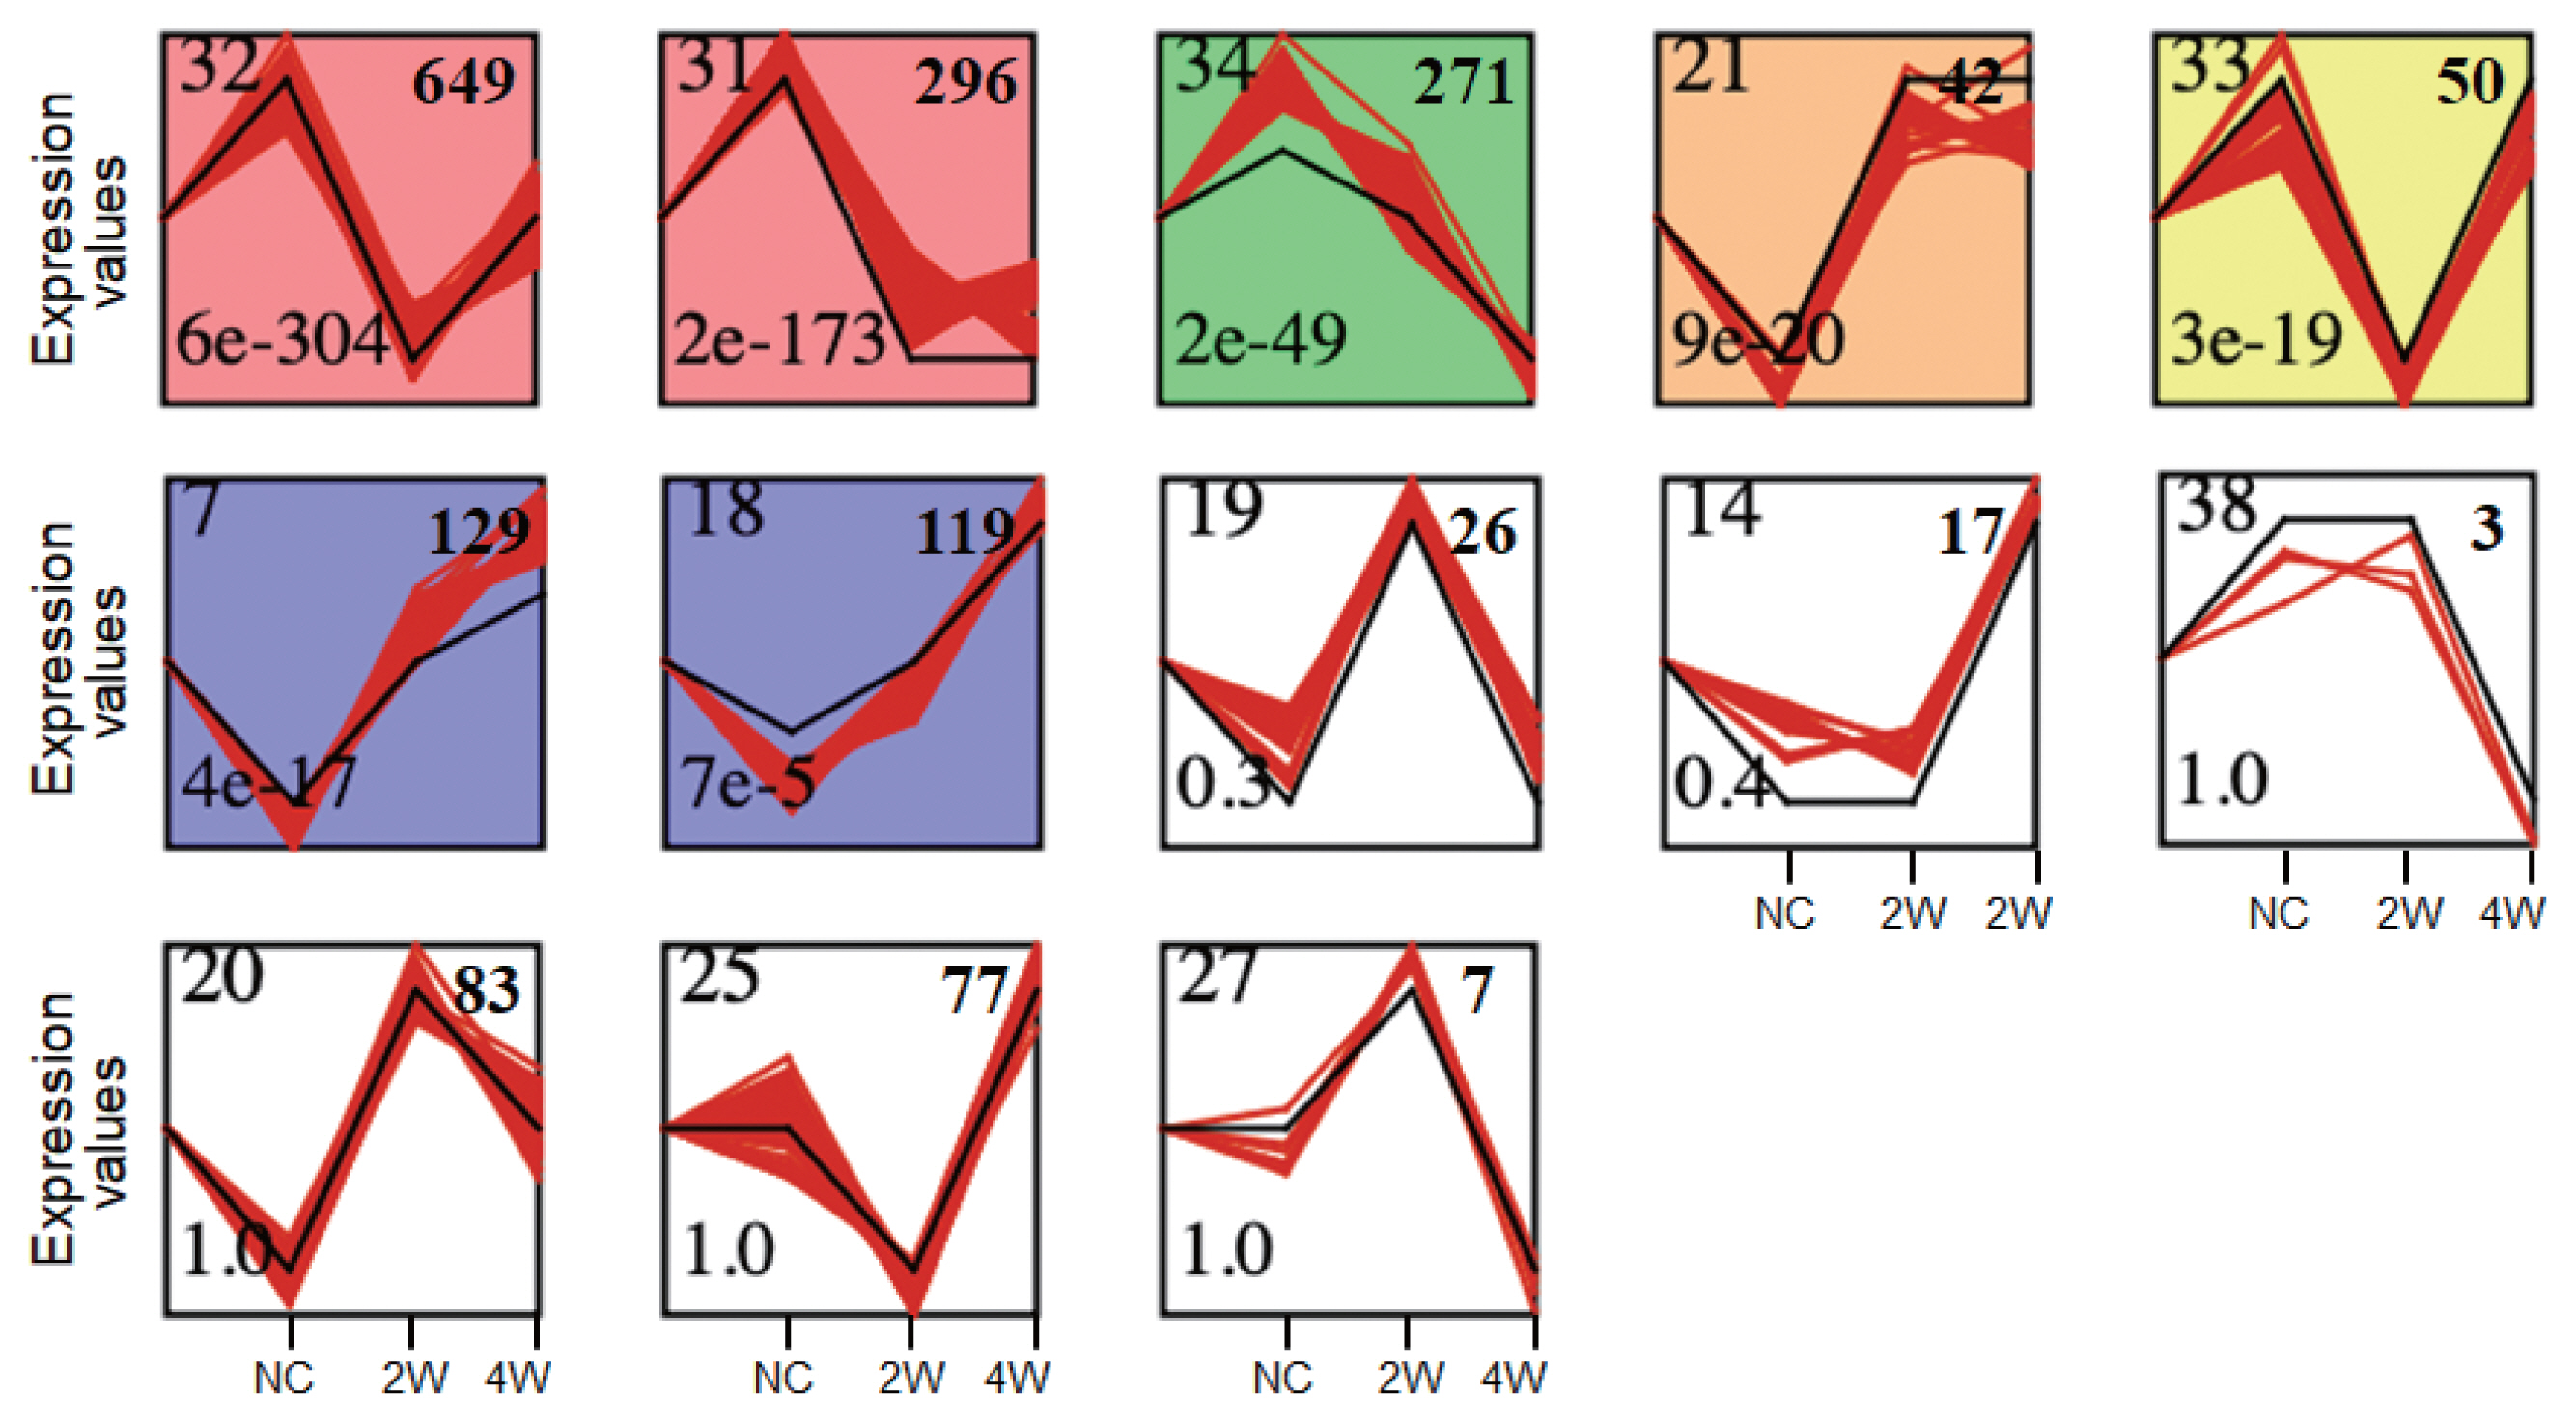
Time series-based gene expression patterns at early and late infection groups. All of 1,771 DEGs were analyzed using STEM [22]. Black lines indicated expression patterns of 40 model profiles while red lines represented expressions of all genes. NC, normal control, 2W, 2 weeks, and 4W, 4 weeks. Significant profiles were colored, and similar colors meant the same cluster of model profiles. Numbers on the top left and bottom left correspond to the numbers of profiles and the associated P-value, respectively. Profiles were ordered based on the P-value significance of numbers of genes assigned (on the top right) versus expected.
A majority of DEGs were down-regulated in response to C. sinensis infection
All genes showing monotonically changing expression pattern were further investigated in terms of DEGs and pathway-related genes. The 1,771 DEGs were found to be differently expressed between and among each group as shown in Venn diagrams (Fig. 4). Compared to NC, 316 genes and 1,247 genes were up-regulated and down-regulated in 2W, respectively. While, 396 genes were up-regulated, but 1,061 ones were down-regulated in 4W compared to NC. Collectively, a majority of DEGs (1,339 genes, 75.6%) were down-regulated in either 2W or 4W. Compared to NC, 314 DEGs (17.7%) were unique to 2W and 208 DEGs (11.7%) were distinctive in 4W. Out of 262 up-regulated DEGs (14.8%) in both 2W and 4W, collagen type IV alpha 6 (Col4a6; log2FC=2.40 at 2W and log2 FC=1.40 at 4W) and collagen type VI alpha 6 (Col6a6; log2 FC=2.40 at 2W and log2FC=1.61 at 4W), were the most highly induced genes by C. sinensis infection. The infection also induced the expressions of several other genes, such as regenerating islet-derived 3 gamma (Reg3g), RNase A family 2 (Rnase2), POU class 2 associating factor 1 (Pou2af1), MAS-related G-protein coupled receptor member G (RGD1562011), Matrilin 2 (Matn2), and fibroblast growth factor 2 (FGF2). Among 969 DEGs (54.7%), which were down-regulated in both 2W and 4W, glucagon-like peptide 1 receptor (Glp1r; log2FC=−2.43 at 2W and log2FC=−1.03 at 4W) was representative of the most highly-suppressed genes. Several other genes including LOC681282, esophagus cancer-related protein 2 (Spink7), EP300 interacting inhibitor of differentiation 2B (Eid2b), acrosin binding protein (Acrbp) and leucine-rich repeat, and immunoglobulin-like and transmembrane domains 1 (Lrit1) were also down-regulated, despite their biological functions in C. sinensis infection are not clear.
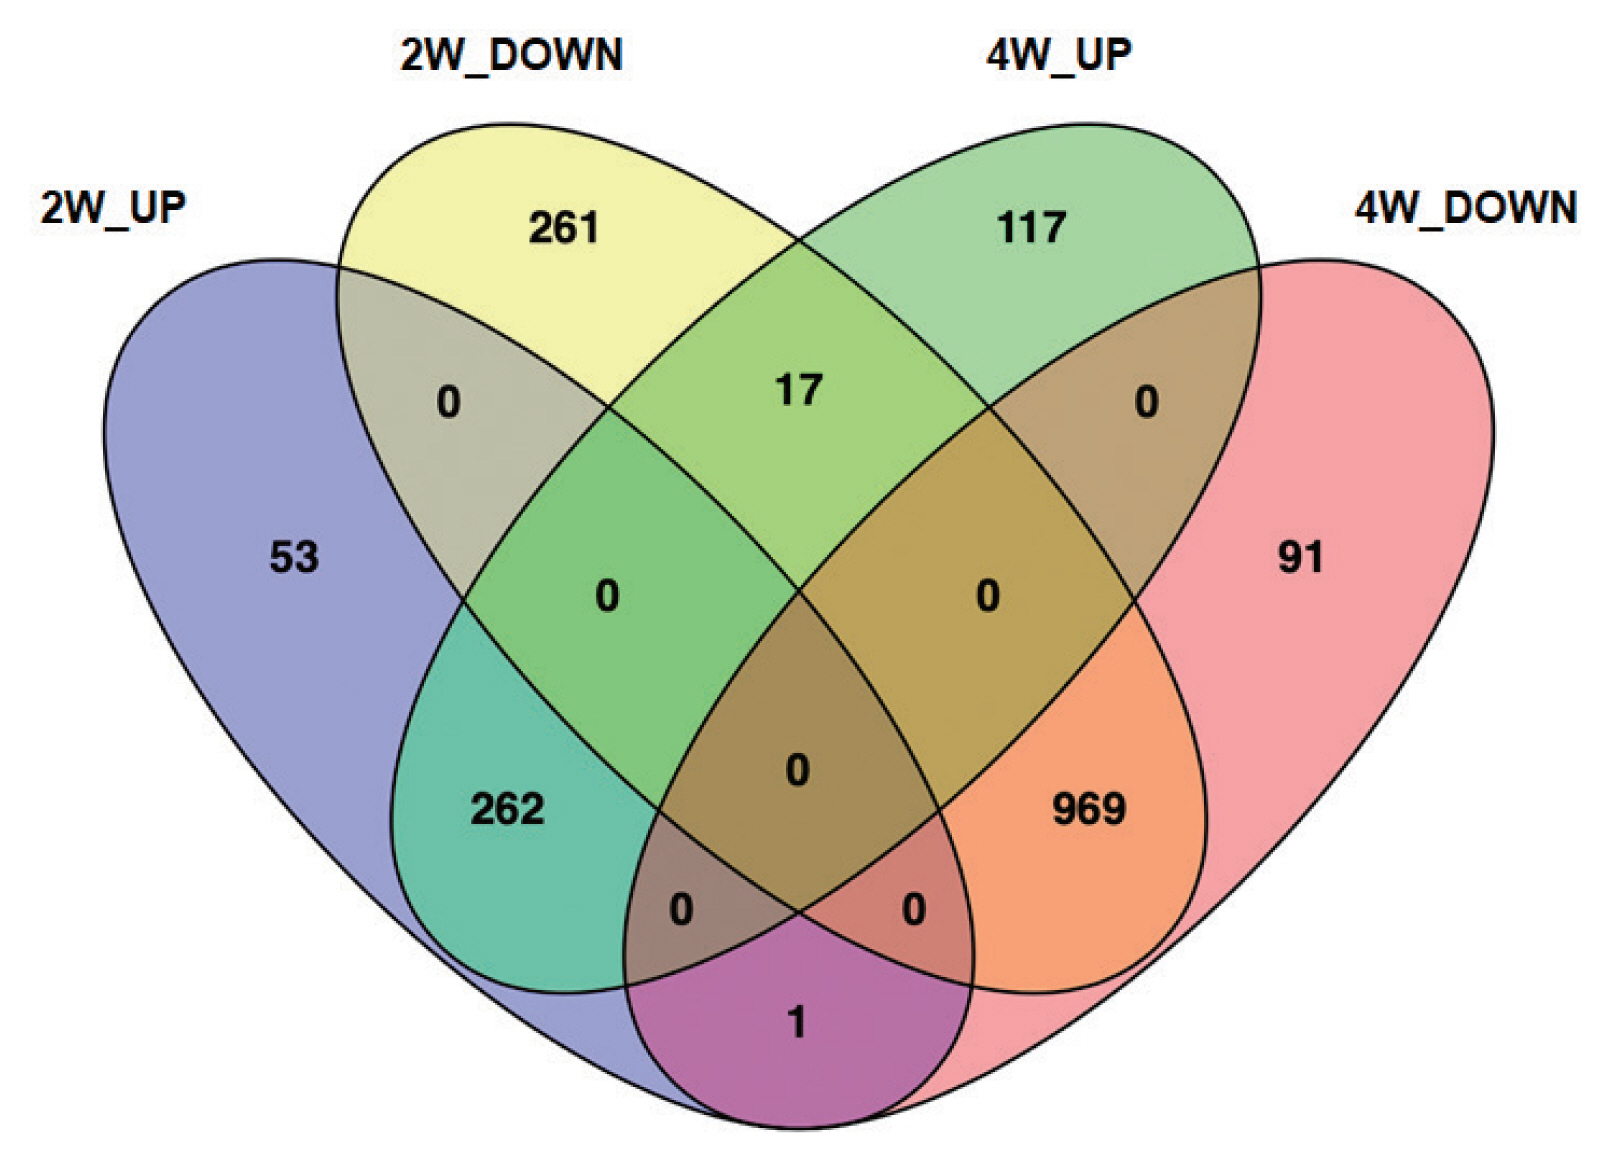
A Venn diagram showing DEGs in the bile ducts infected with C. sinensis. 2W and 4W, 2 and 4 weeks post-infection with C. sinensis. Purple, yellow, green and magenta colors denote 2W_UP, 2W_DOWN, 4W_UP, and 4W_DOWN, respectively.
Key hub proteins and their neighbors predicted from DEGs
PPIs of DEG products and their neighbors were constructed using STRING database v11.0 [23] to explore their interactions and sub-networks. PPI networks constructed for the early stage of infection (2W) suggested 5 sub-networks, of which the cluster 1 was significantly linked to important GO cellular components, peptidase complex and proteasome complex (Fig. 5A). Out of top 400 DEGs, 26 hub genes showed high degree centrality of 8 to 29, which all were down-regulated. Six hub genes, Psmc2, Psmb1, Psmd1, Taf6, Tbpl2, and Mapk1, were key genes with high betweenness centrality of 228 to 1,568. For 4W, 13 hub genes in 4 sub-networks were identified, but no clusters showed any significant enrichment with functional ontologies (Fig. 5B). Four hub genes, Gnl3l, Kctd19, Bdkrb1, and Nmur1, were detected as key hub genes with high degree centrality of 8 to 11 and high betweenness centrality of 107 to 2,771.
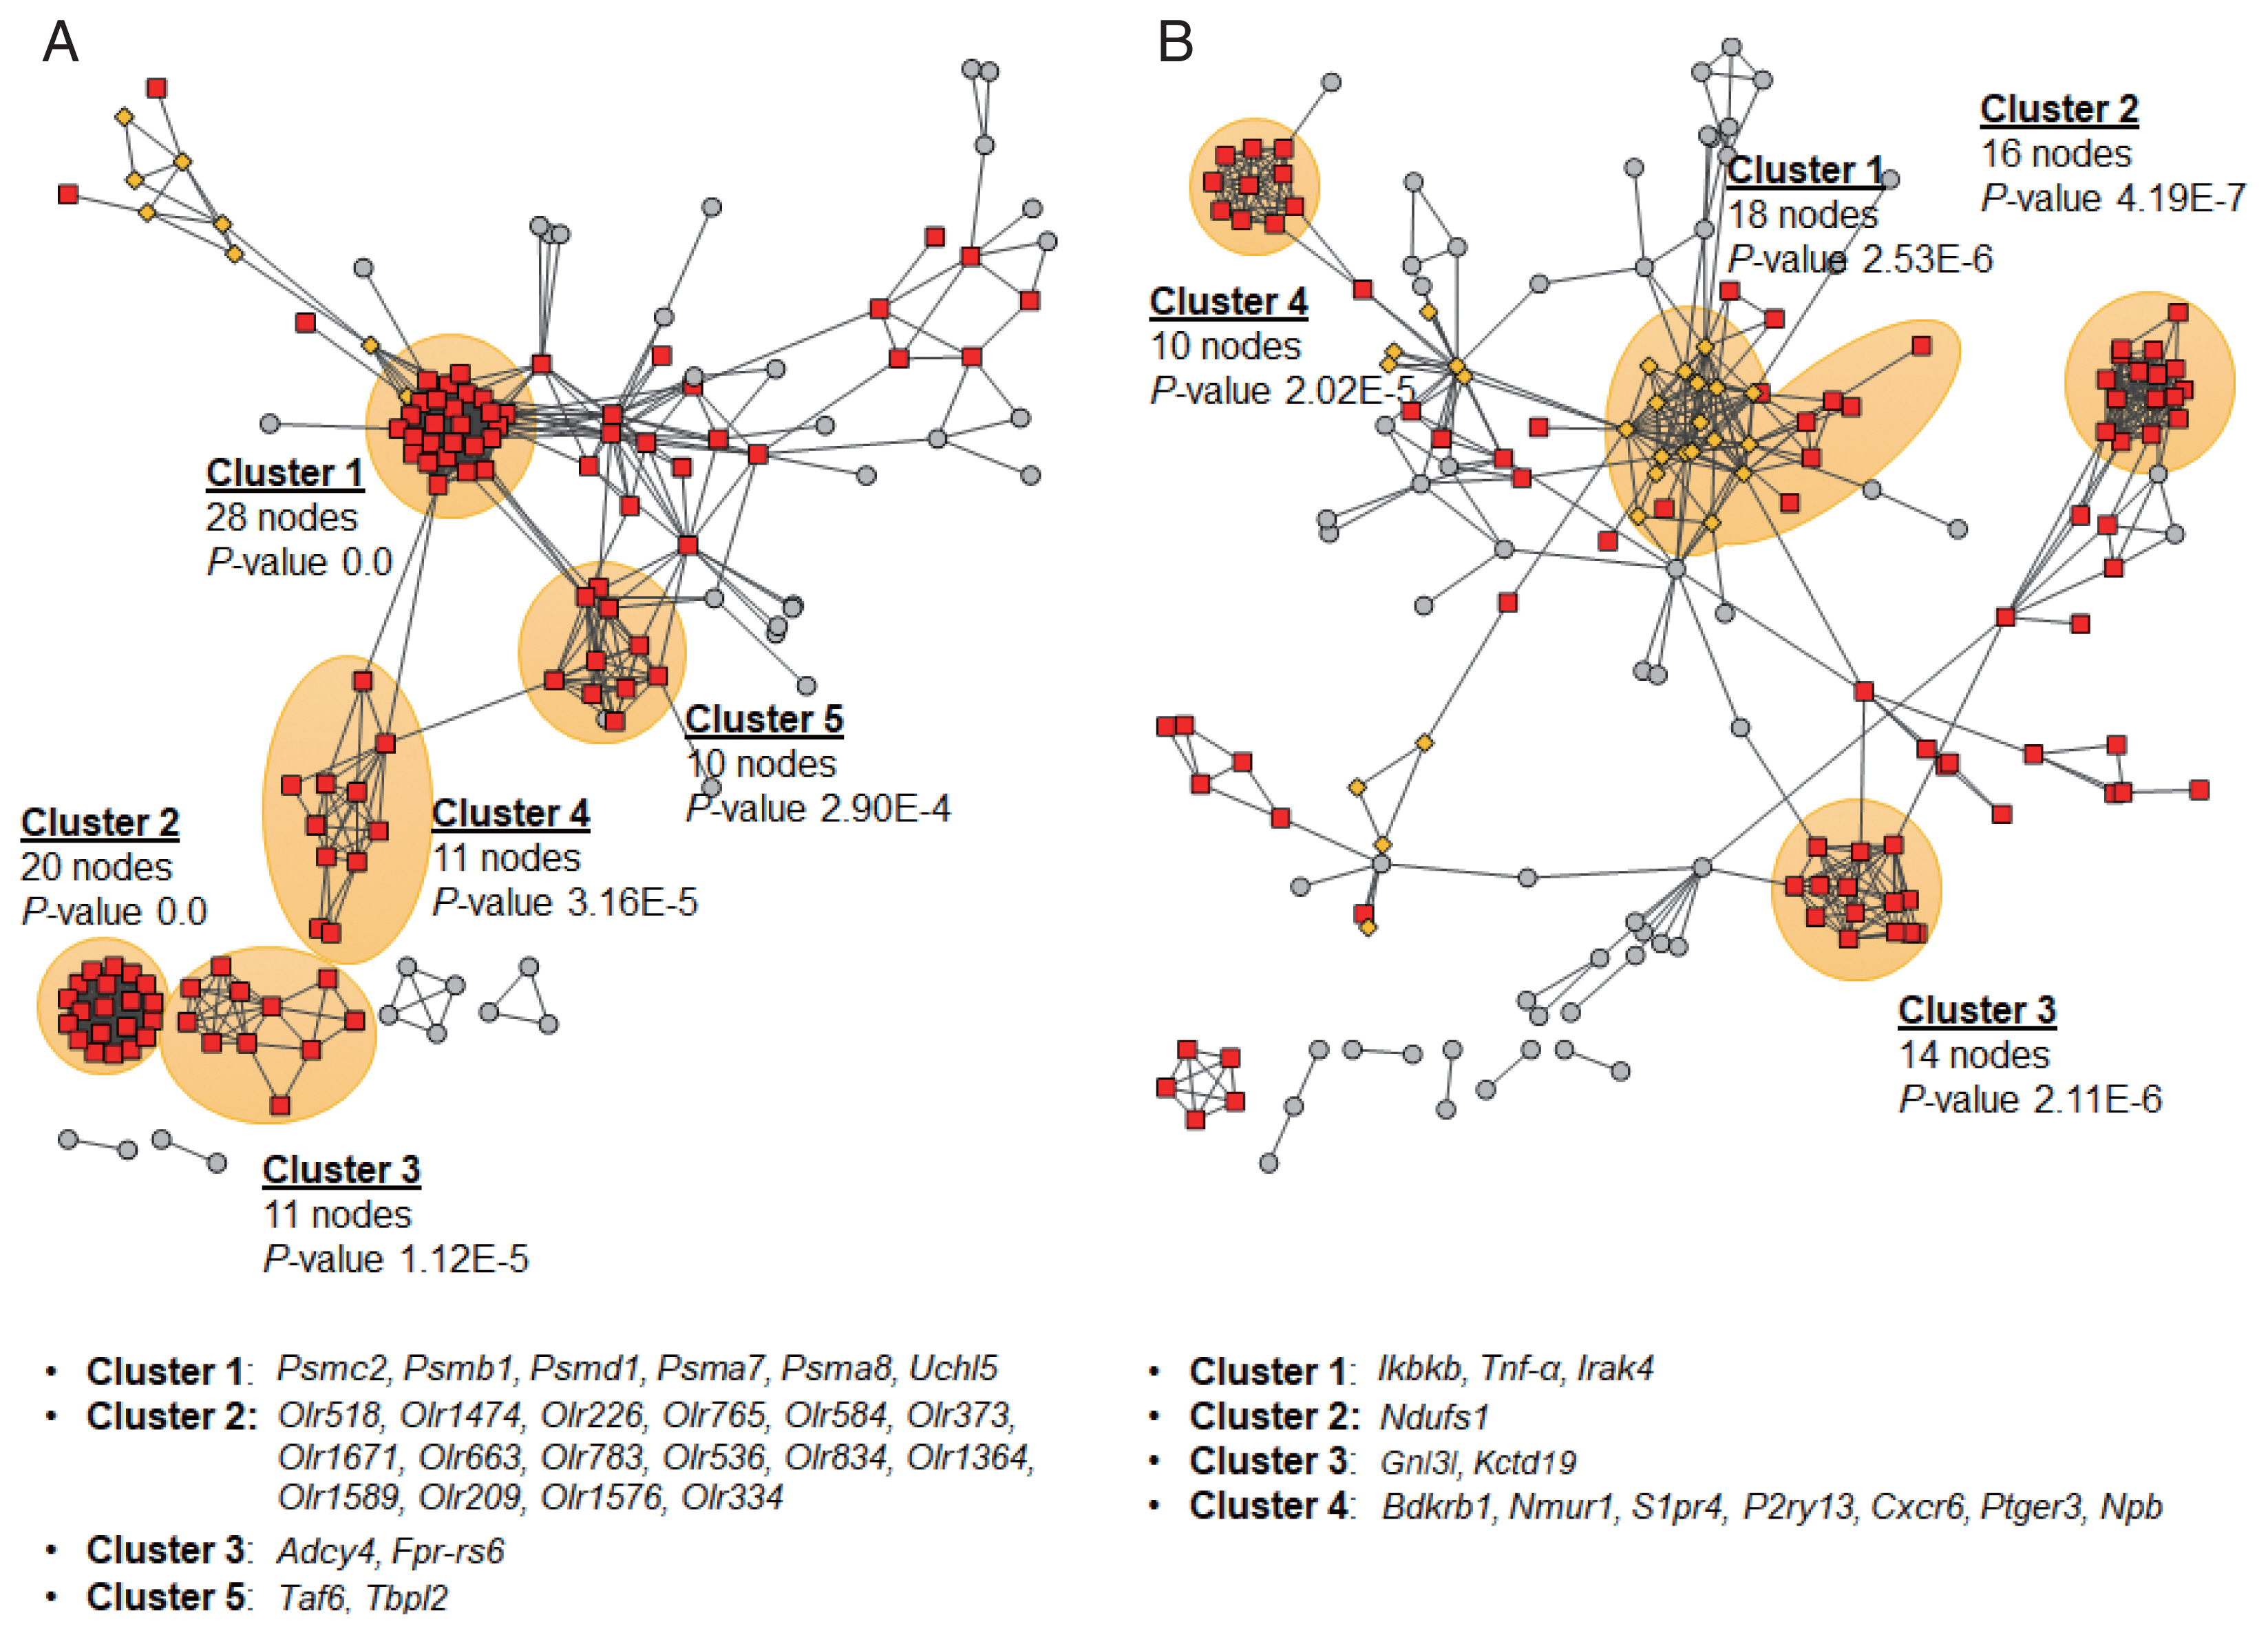
Protein-protein interactions and sub-networks of DEG products. The networks were constructed using each top 400 DEG products and no more than 50 interactors from the 2 week (A) and 4 week groups (B) using STRING database v11.0 [23]. The most significant sub-networks were shaded in orange and the hub genes of each sub-network were provided below each network.
Key hub genes are identified from co-expression network-based modules
Co-expression network modules analyzed by WGCNA [30] suggested correlation weighted network based on the gene expression data and gene modules related with the condition under the study. Overall, 1,771 DEGs were arranged into 16 co-expression modules (CM) (Fig. 6A). Five modules, CM2, CM6, CM10, CM13, and CM14, were identified with significant GO enrichment, suggesting several important biological processes, such as G protein-coupled receptor activity in CM2, sensory perception of chemical stimulus in CM6, signaling receptor activity in CM10, olfactory receptor activity in CM13, and glial cell differentiation in CM14, seemed to be associated with host’s responses against C. sinensis infection (Table 2). Although some other modules were also highly correlated, they did not have enough members to pass the significance threshold for GO analysis. A total of 738 hub genes, which had 50 degrees and more, were identified. The 95 hub genes showing MIE or MDE, including 21 genes in CM1, 18 genes in CM2, 17 genes in CM3, 1 gene in CM4, 17 genes in CM5, 3 genes in CM6, and 18 genes in CM7, were finally selected (Fig. 6B). Among them, 13 key hub genes showed high degree centrality of 97 to 135 and high betweenness centrality of 116 to 372; Impact, Mtmr1, Capn9, Flnc, Dcaf17, ENSRNOG00000046969, Dlg1, Tanc2, and Ghdc in CM1, Dohh, RGD1559896, Tgfb1i1, and Ddx19a in CM3.
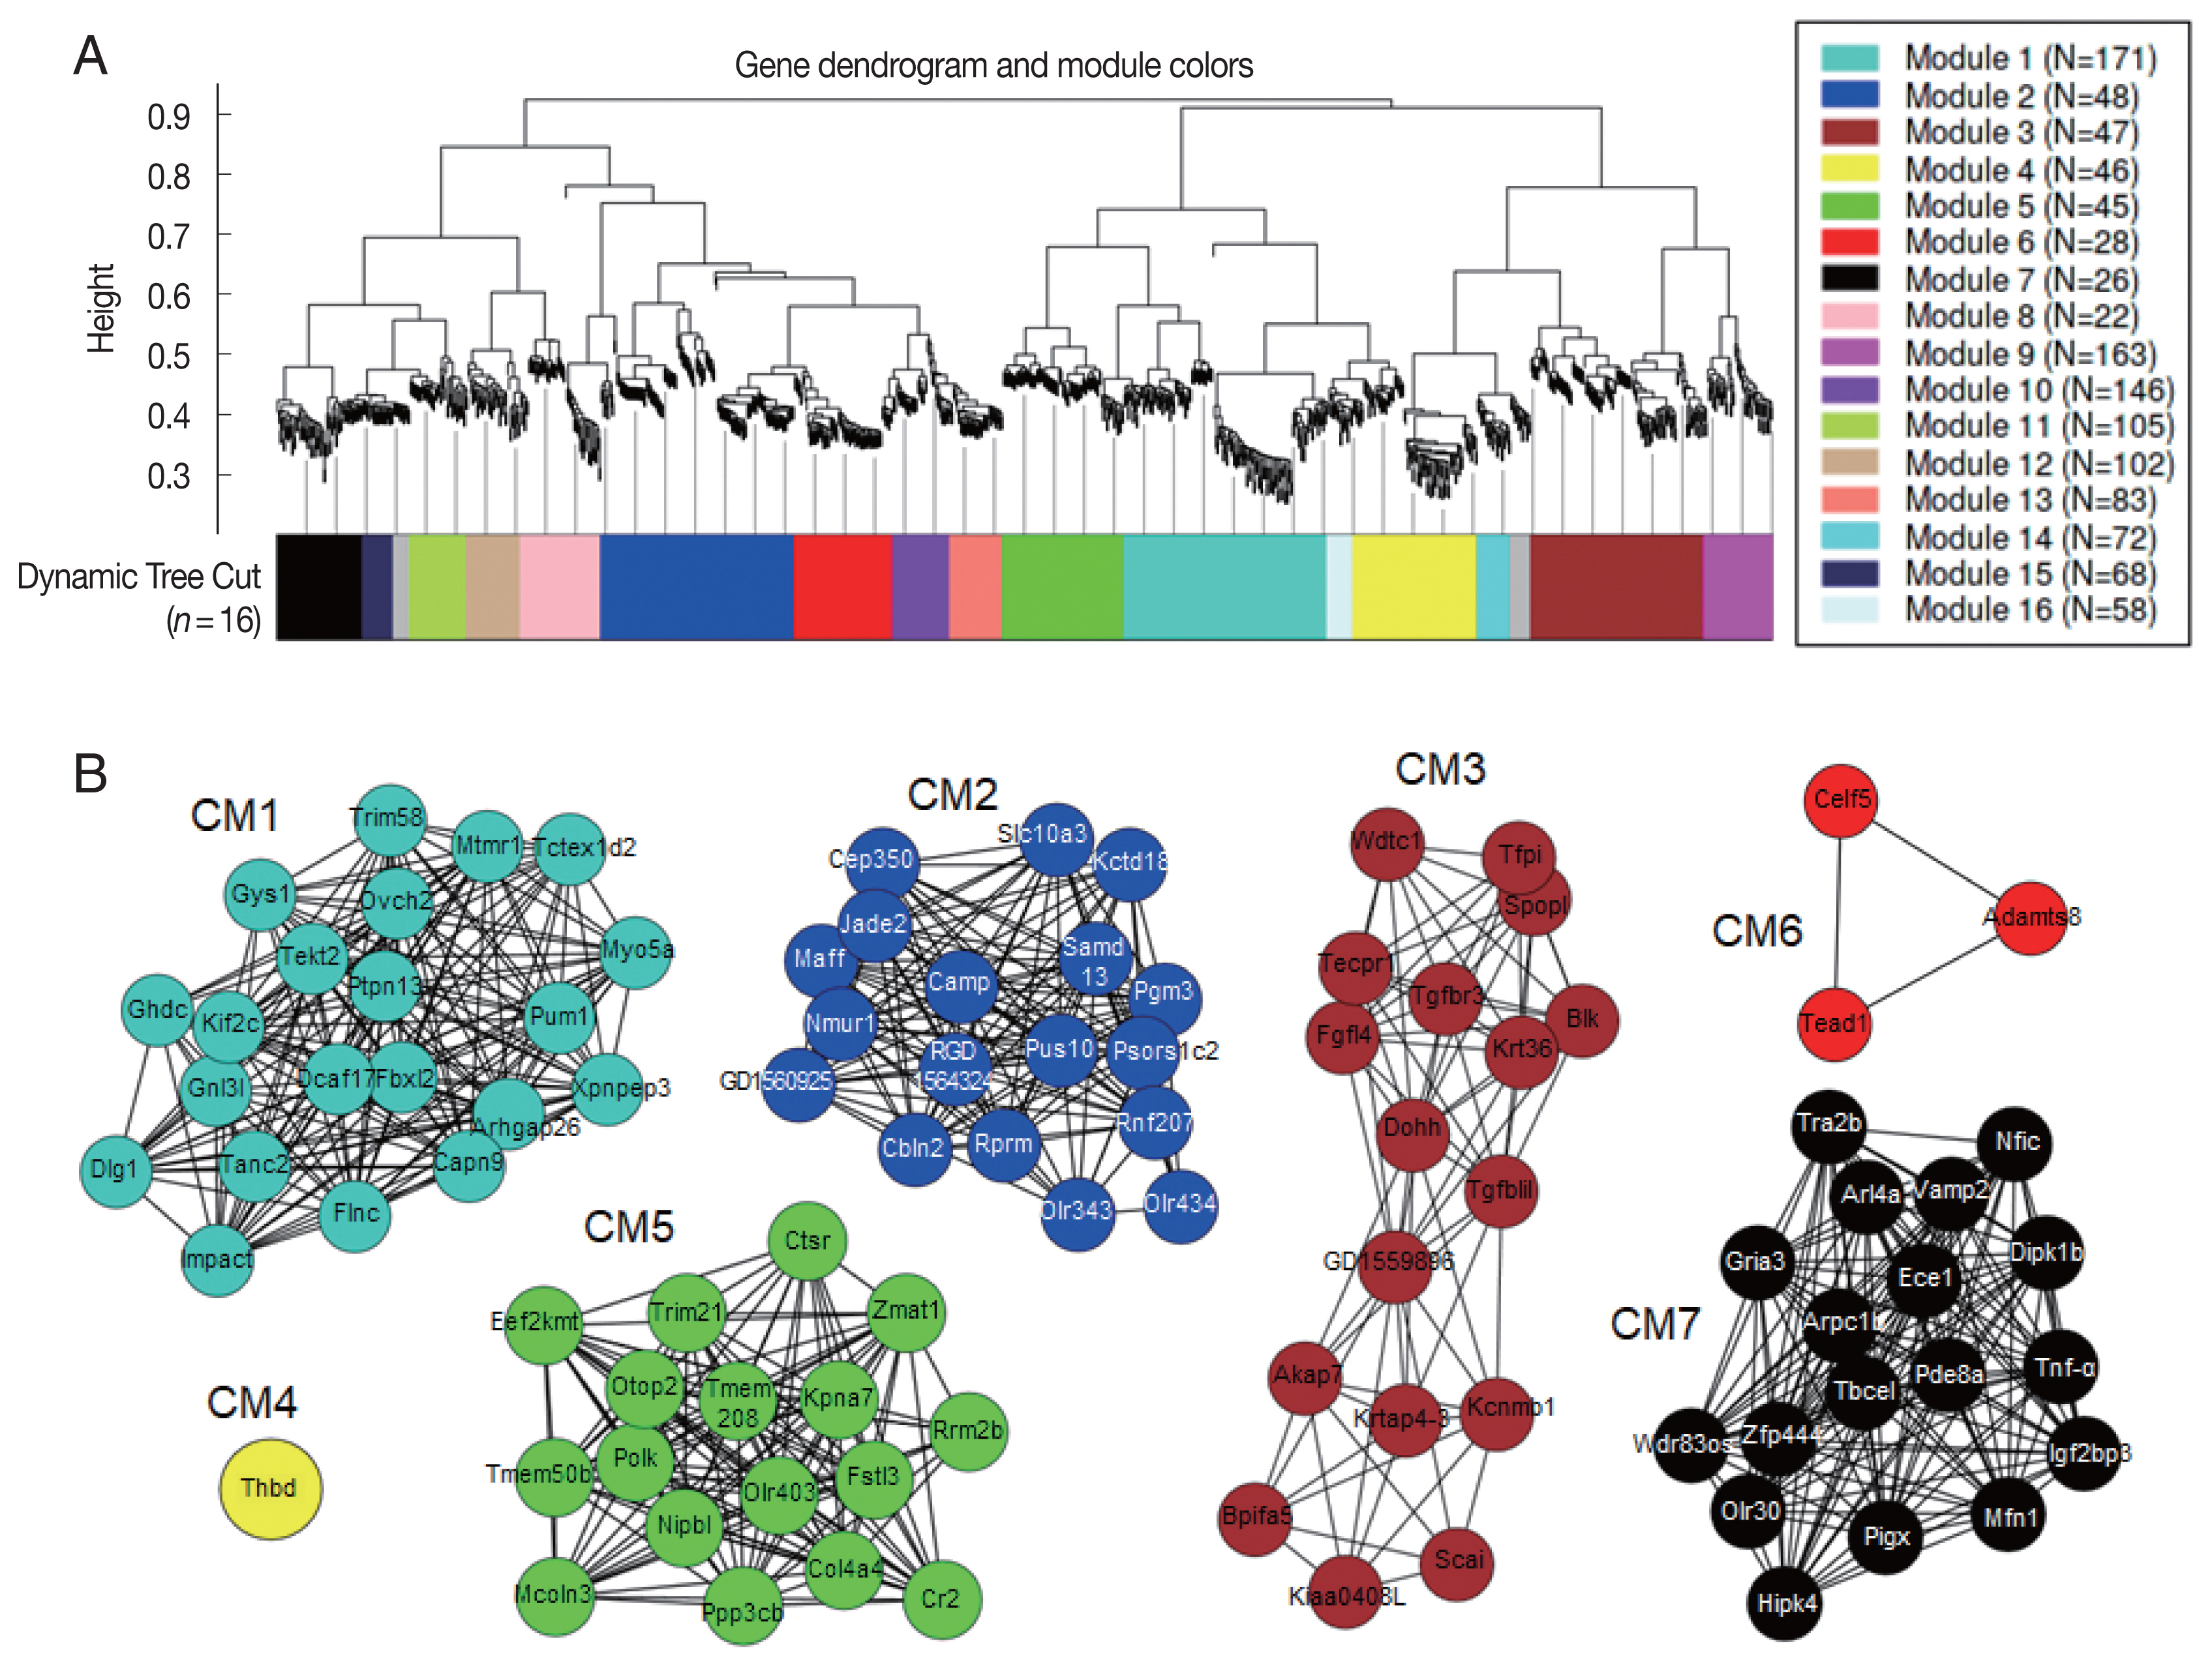
Correlation dendrogram and modules identified by co-expression network in the C. sinensis-infected rat’s bile ducts. (A) Based on gene expression pattern, WGCNA [30] identified a network of 1,771 genes divided into 16 co-expression modules (CM). Only hub genes showing monotonically changing expression patterns were displayed. The genes in the same module were the same colors, but grey color indicated outliers or uncharacterized genes. (B) Genes were represented as nodes and each node was connected to other nodes in the weighted network.
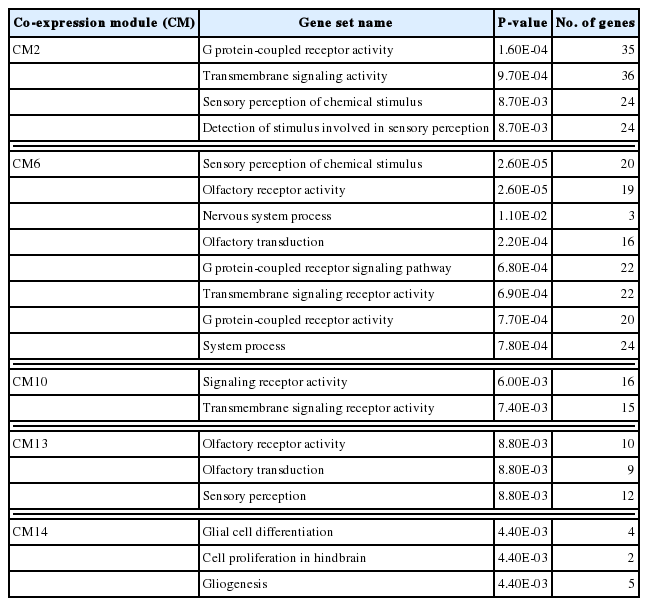
Co-expression modules associated with C. sinensis infection among DEGs
Identification of significantly enriched KEGG pathways
To identify the most important pathways, where 519 DEGs with monotonically changing expression patterns (as a feature list) were statistically enriched, analysis with PaintOmics v3 [33] was performed. The biological pathways of rats’ bile duct tissues in response to C. sinensis infection at 2W and 4W were visualized by mapping KO terms assigned by individual DEGs on KEGG pathways. The KEGG pathway gene set analysis of all DEGs showed significant enrichment of 16 pathways, among which 5 pathways were associated with “Original Systems”, 4 pathways with “Cellular Processes”, 6 pathways with “Human Diseases”, and 1 pathway with “Environmental Information Processing” (Fig. 7). Top 3 key KEGG pathways were human T-cell lymphotropic virus type 1 (HTLV-I) infection, mitogen-activated protein kinase (MAPK) signaling pathway, and human papillomavirus (HPV) infection according to the number of nodes. In the MAPK signaling pathway mapped with 28 DEGs, all up-regulated genes were DEGs having MIE. Cacnb2, Efna4, Flt1, and Ikbkb, which are related with “Classical MAP kinase pathway”, were monotonically up-regulated. High expression of genes associated with “JNK and p38 MAP kinase pathway” such as Flnc, Hspa1l, and Tnf-α, were also identified. Meanwhile, no matched gene for the ERK5 pathway was identified. Viruses infection- and tuberculosis infection-related pathways were also significantly enriched. Chd4, Ikbkb, Itga11, Tnf-α, Pik3r2, Pxn, and Rbl1, which are related with “HPV infection pathway”, were up-regulated. For “Human T-cell leukemia virus 1 infection”, most of DEGs were down-regulated, but Ikbkb, Tnf-α, Pik3r2, and Pold1 were up-regulated in C. sinensis infection.

DISCUSSION
In this study, transcriptional alterations in bile ducts induced by C. sinensis infection were analyzed. A majority of DEGs were down-regulated at 2W, suggesting potential pathological changes in the bile ducts start from the early stage of C. sinensis infection. The DEGs are likely to be temporally dysregulated over the time course of the infection, as evidenced by 699 DEGs of Profiles 32 and 33 in STEM. On the other hand, overall expression patterns at 4W were more similar to those at NC than 2W in the HCL dendrogram, which suggests host’s responses to recover initial pathologic changes in the bile ducts that were induced by the infection operate to maintain functional consequences. Among the most up-regulated DEGs at both infections time points (2W and 4W), Reg3g and Rnase2 are likely to be related with defense responses against C. sinensis infection based on the GO terms, similarly suggested by “defense response to Gram-positive bacterium” (GO:0050830) and “defense response to virus” (GO:0051607). Reg3g is known as one of inflammatory response genes modulated by Salmonella infection [36]. Several Mapk genes such as Mapk1, Mapk11, and Mapk14 have suggested as key genes in response to parasitic infections [37]. ADP-ribosylation factors including Arl4a are reported to be up-regulated in Opisthorchis viverrini-infected hamsters [38], which was coincided with our results. Increased expressions of the collagen family members in C. sinensis-infected rat’s bile duct were also in agreement with the previous study that C. sinensis infection enhanced cell-to-cell communication in the liver tissues of C. sinensis-infected FVB/N mice [39].
Out of top down-regulated DEGs at both 2W and 4W, impact of parasitic infection on Glp1r is not clear, however, Schistosoma mansoni infection evoked profound alterations in glucagon pathway-related genes at 10 days post-infection in mice [40]. Glp1r plays a role in the control of glucose and insulin level as a member of gut hormone receptors [41], and has been considered as a hub gene for both neuroactive ligand-receptor interaction and cAMP signaling pathway [42]. In addition, under the injured hepatic tissues of rats, GTP-binding proteins and Blk are reported to be associated with signal transduction [43] and the inflammatory response [44], respectively.
The findings in this study are in broad agreement with a previous study, in which a large numbers of DEGs were detected at the early stage of C. sinensis infection, but only small numbers of DEGs remained up- or down-regulated throughout the time course in FVB/N mouse liver infected with C. sinensis [39]. However, our study had several strengths than the previous study [39]: first, this study applied diverse statistical tests including ANOVA [17] and Post-hoc Tukey’s HSD multiple test [18] to obtain confident DEGs and to compare across multiple groups in pairwise comparison rather than single Significance Analysis of Microarrays (SAM) [45]; second, this study applied time-course specific algorithm, STEM [22], to select DEGs showing monotonically changing expression pattern; and third, this study performed a multi-step integrative bioinformatics analysis to explore the network-based analysis and hub genes/proteins rather than the individual DEGs.
Network approaches to detect sub-networks and key hub genes/proteins that respond to C. sinensis infection suggested several features in terms of the relationships between DEGs and PPI or WGCNA. DEGs showing MIE or MDE had lower centrality but higher betweenness centrality in PPI networks than in WGCNA. Degree centrality [46] is a typical centrality measure in characterizing the importance of nodes in a network, suggesting that the greater number of neighbors of a node, the greater influence is predicted. Moreover, the betweenness centrality [47], which defines the number of shortest paths through the current node in a network, was applied in this study because hub proteins with a higher betweenness tend to be more critical.
From the networks of both PPI and WGCNA, neuromedin-U receptor 1 (Nmur1; log2FC=1.82 at 2W and log2FC=2.30 at 4W) and guanine nucleotide-binding protein-like 3-like protein (Gnl3l; log2FC=−1.38 at 2W and log2FC=−2.27 at 4W) were identified as key hub genes, which haven’t been reported yet in any infection models. Nmur1 has been reported to play a critical role in stimulating the type 2 cytokines which are important in mediating innate and adaptive defense immune responses against helminth infections and maintaining metabolic homeostasis and repair of damaged tissue [48]. Worm burden of intestinal nematode Nippostrongylus brasiliensis is proven to be higher in Nmur1−/− mice than in Nmur1+/+ control mice [49]. Gnl3l has been identified as one of the crucial regulators responsible for the maintenance of the tumorigenic properties and NF-κB signaling-mediated cell survival in humans [50]. It has reported that free radicals induced by chronic C. sinensis infection can trigger NF-κB-mediated inflammation in human cholangiocarcinoma cell line [5]. Therefore, Nmur1 could be a predictive marker of clonorchiasis in early infection stage, whereas increased expression of Gnl3l could be used to determine chronic C. sinensis infection. Further study to investigate these as useful biomarkers would be necessary.
The DEGs were enriched to 16 major canonical KEGG pathways relevant to C. sinensis infection. These findings are consistent with the previous studies that parasitic infections could contribute to transcriptional alterations of immune system (complement and coagulation cascades [51], toll-like receptor (TLR) signaling pathway [51] and natural killer cell/mediated cytotoxicity [39]), cell growth/death (cellular senescence [52] and apoptosis [38]), signal transduction (MAPK signaling pathway [53]), and endocrine system (insulin signaling pathway [51]). However, it is worth to mention that the alterations of these pathways may have no biological significance, considering some pathways are often differentially expressed because mammals have a myriad of related genes, such as TLR signaling transducers and MAPK signaling molecules [54–57]. The role of TLRs in helminth infections is not clear. Hymenolepis diminuta induced up-regulations of Tlr2 and Tlr4 in the rats’ jejunum in early infection stage [54]. In this study, monotonical down-regulation of Tlr7 was observed during C. sinensis infection, which is consistent with the previous study that Brugia malayi down-regulated TLR7 in the host cell [55]. Mapk1 (a.k.a. Erk2) and Mapk8 (a.k.a. Jnk1) were also significantly down-regulated in the bile ducts of rats infected with C. sinensis. It has recently reported that expression of MAPK gene members changed by Echinococcus multilocularis [56]. In a timely manner, balanced regulation of ERK1/2 and JNK was involved in proliferation and apoptosis of hepatocyte, respectively, because two signaling molecules belong to different MAPK pathway subgroups, such as growth factors and external stimuli [57]. In particular, Tnf-α was concurrently enriched in 11 KEGG pathways and regarded as a monotonically up-regulated gene but not a key hub gene/protein. It is proposed that Tnf-α may play a major role in inflammatory response in bile epithelial cells in clonorchiasis [7]. Biological significances of regulated expressions of these genes above should be investigated further throughout the prolonged period of C. sinensis infection. These findings may provide new insights to understand for host dynamics against C. sinensis infection.
In conclusion, analysis of comprehensive transcriptomic profiles in rats’ bile duct provided useful information for understanding the pathological changes of bile ducts during initial infection phases of C. sinensis. A total of 1,771 DEGs, which revealed highly dynamic and time-dependent expression patterns, were detected and 519 of them showed monotonically changing expression patterns in the infected rats. PPIs of the DEG products and co-expression networks of the DEGs suggested 10 key hub proteins and 13 key hub genes, respectively. All DEGs were enriched to a set of 16 key KEGG pathways which are essential to immune response and signal transduction for host defense against parasitic infection. Our results could facilitate future studies to uncover molecular pathogenic mechanism of clonorchiasis and to identify a set of diagnostic marker candidates for early detection of C. sinensis infection. However, this study also had a limitation in that the numbers of bile ducts analyzed in this study were not sufficient to generalize. Despite this limitation, this is the first trial to understand molecular pathobiological events in bile ducts induced by C. sinensis via a microarray-based methodology. Further study is necessary to evaluate the potential biomarkers identified in this study as reliable ones for early diagnosis clonorchiasis. Moreover, more comprehensive study is needed to investigate pathobiological changes in the bile ducts of C. sinensis infected host for in-depth understanding the pathology of the carcinogenic parasite.
ACKNOWLEDGEMENT
This research was supported by the National Research Foundation of Korea (NRF) funded by the Ministry of Science, ICT & Future Planning (Grant No. NRF2016R1C1B1009348 and NRF2018R1C1B6005581).
Notes
CONFLICT OF INTEREST
The authors have no conflict of interests related to this work.