Recent Spatial and Temporal Trends of Malaria in Korea
Article information

Abstract
This study was done to provide an analytical overview on the latest malaria infection clusters by evaluating temporal trends during 2010–2019 in Korea. Incheon was the most likely cluster (MLC) for all cases of malaria during the total period. MLCs for P. falciparum, vivax, malariae, ovale, and clinically diagnosed malaria without parasitological confirmation were Jeollanam-do, Incheon, Gangwon-do, Gyeongsangnam-do, and Jeollabuk-do, respectively. Malaria was decreasing in most significant clusters, but Gwangju showed an increase for all cases of malaria, P. vivax and clinically diagnosed cases. Malaria overall, P. falciparum and P. vivax seem to be under control thanks to aggressive health measures. This study might provide a sound scientific basis for future control measures against malaria in Korea.
INTRODUCTION
Diseases transmitted by arthropod vectors are major risk factors responsible for the global burden of infectious diseases [1]. Mosquito-borne diseases (MBDs) are important in this respect as they include malaria and several important arboviruses [2,3]. Aside from the high burden, they tend to emerge in new areas, and also re-emerge in regions known to have been eradicated.[2] Several factors such as globalization and climate changes are inducing shifts in communicable disease trends, and this is especially evident in MBDs [1,4] as its incidence seems to show an increasing trend in parts of Korea.
Malaria is one of the oldest diseases, and its influence has probably been greater than that of any other infectious agents [5]. Caused by the Plasmodium species of protozoan parasites, malaria is a major public health burden worldwide [6]. P. falciparum is the most prevalent malaria parasite in Africa, and it is the greatest menace because of its high mortality rate [7]. P. vivax is less lethal than P. falciparum, but more prevalent in Korea [6]. It was eradicated from Korea late 1970s, but re-emerged 1993 and continued prevalent despite the ongoing national eradication program [8]. P. malariae is a benign malaria with several distinct clinical features [9]. P. ovale make the infected RBC swollen and oval, the margin fimbriated, and stained pale, morphologically distinct from the others. In Korea, majority of the imported malaria cases were of P. falciparum (from Africa) and P. vivax (from Southeast Asia), whereas P. malariae and P. ovale cases were very rare [10].
Korea has a complete full health-coverage of its population. The clinical data from the Health Insurance Review and Assessment Service (HIRA) of Korea were used in this study, so that the whole Korean population is represented. Our study was performed to figure out spatial infection clusters and trends of the malaria, Plasmodium infections during recent 10 years in Korea.
MATERIALS AND METHODS
Ethics statement
This study was performed under the regulation of the IRB Committee of The Catholic University of Korea (No. MC20ZASE0155). This research adhered to the tenets of the Declaration of Helsinki.
Data aquisition and definition
The nationwide malaria cases for 10 years (2010–2019) from the 16 administrative districts in Korea were obtained from the Healthcare Bigdata Hub provided by the HIRA. (https://opendata.hira.or.kr/home.do. [cited 2020 October]) The HIRA classifies the Plasmodium infections as P. falciparum (B50), P. vivax (B51), P. malariae (B52), P. ovale, simian plasmodia (B53) and clinically diagnosed malaria without parasitological confirmation (B54).
The population data of 16 administrative divisions for the same period were obtained from the Korean Statistical Information Service (https://kosis.kr/index/index.do. [cited 2021 October]). The geographical locations of the cases were set to the latitude and longitude of administrative center as the search point since the case data were compiled by administrative district unit. The population and number of cases were summed up as accumulated counts and numbers for the total period to evaluate overall malaria status. Case numbers were adjusted for the respected district population (cases/1,000, 000) to facilitate comparison between the districts (Table 1).
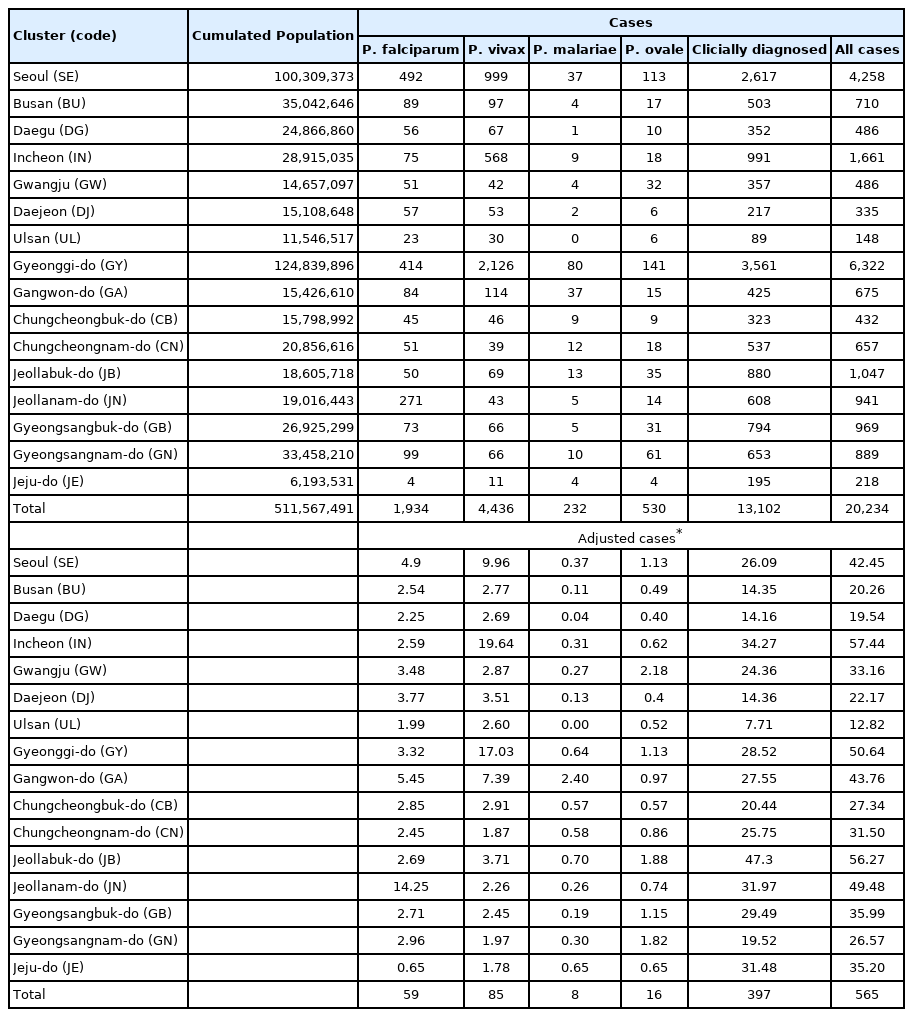
Population and malaria cases for 2010–2019 according to administrative district
Malaria disease according to individual classification were further evaluated by dividing the timeline into tertiles (2010–2012, 2013–2015, 2016–2019), and total period. The third tertile had 4 years of data to reflect more recent information, and to facilitate the evaluation of temporal characteristics.
Spatiotemporal statistical analyses
Spatial scan analysis detects clusters with maximum likelihood ratio by creating a circular window on a map and scanning the study area by varying the window size. The window size determines a percentage of the population at risk within its boundaries [11]. Spatial scan statistic works best for detecting spatial clusters, and may be effective in the study of small numbered cases, such as novel or infrequent outbreaks [12, 13]. SaTScan (v10.0) [14] software was used to detect these clusters and evaluate their significance through simulation. The discrete Poisson model was used since the malaria case data were linked to their background population at risk.
Disease trend was determined through spatial variation in temporal trend analysis, by scanning for clusters with either increasing or decreasing rates. Data for P. malariae in Ulsan was missing and was adjusted for known relative risks according to the SaTScan software guide.
It is important to find an appropriate set value of cluster size because a large value could hide effect of small core clusters, while a small value could overlook the regional pattern of clusters [15]. Preliminary studies with 15 and 25% spatial window sizes showed that the 15% window size was most effective in finding clusters. The present study selected this window size for statistical analyses.
Statistical significance of the clusters was calculated using the Monte Carlo simulations with an inference of 9,999 [16] and expressed as P-value. A significance level of alpha<0.05 was used as a standard. QGIS software (v3.16) was used to visualize cluster patterns on a map. The clusters and trends are shown in order of log likelihood ratio (LLR).
RESULTS
General characteristics
Gyeonggi-do had the highest population (124,839,896) and highest number of cases (31.3%) during the study period. After adjusting the case numbers for population, Incheon (57.4) and Jeollabuk-do (56.3) showed the highest rate of infection.
Spatial clusters
When considering for all cases of malaria, Incheon was the most likely cluster (MLC) with a relative risk (RR) and LLR of 1.49 and 109.579, respectively, for the whole study period. The joint cluster of Jeollanam-do/Jeollabuk-do was next (RR=1.37, LLR=82.628), followed by Jeollabuk-do (RR=1.45, LLR=60. 557), and Jeollanam-do (RR=1.26, LLR=22.861) (Table 2). Gangwon-do was a significant cluster at the first tertile of 2010–2012, and Gwangju was also significant at the mid tertile of 2013–2015 (Fig. 1).

Clusters detected malaria
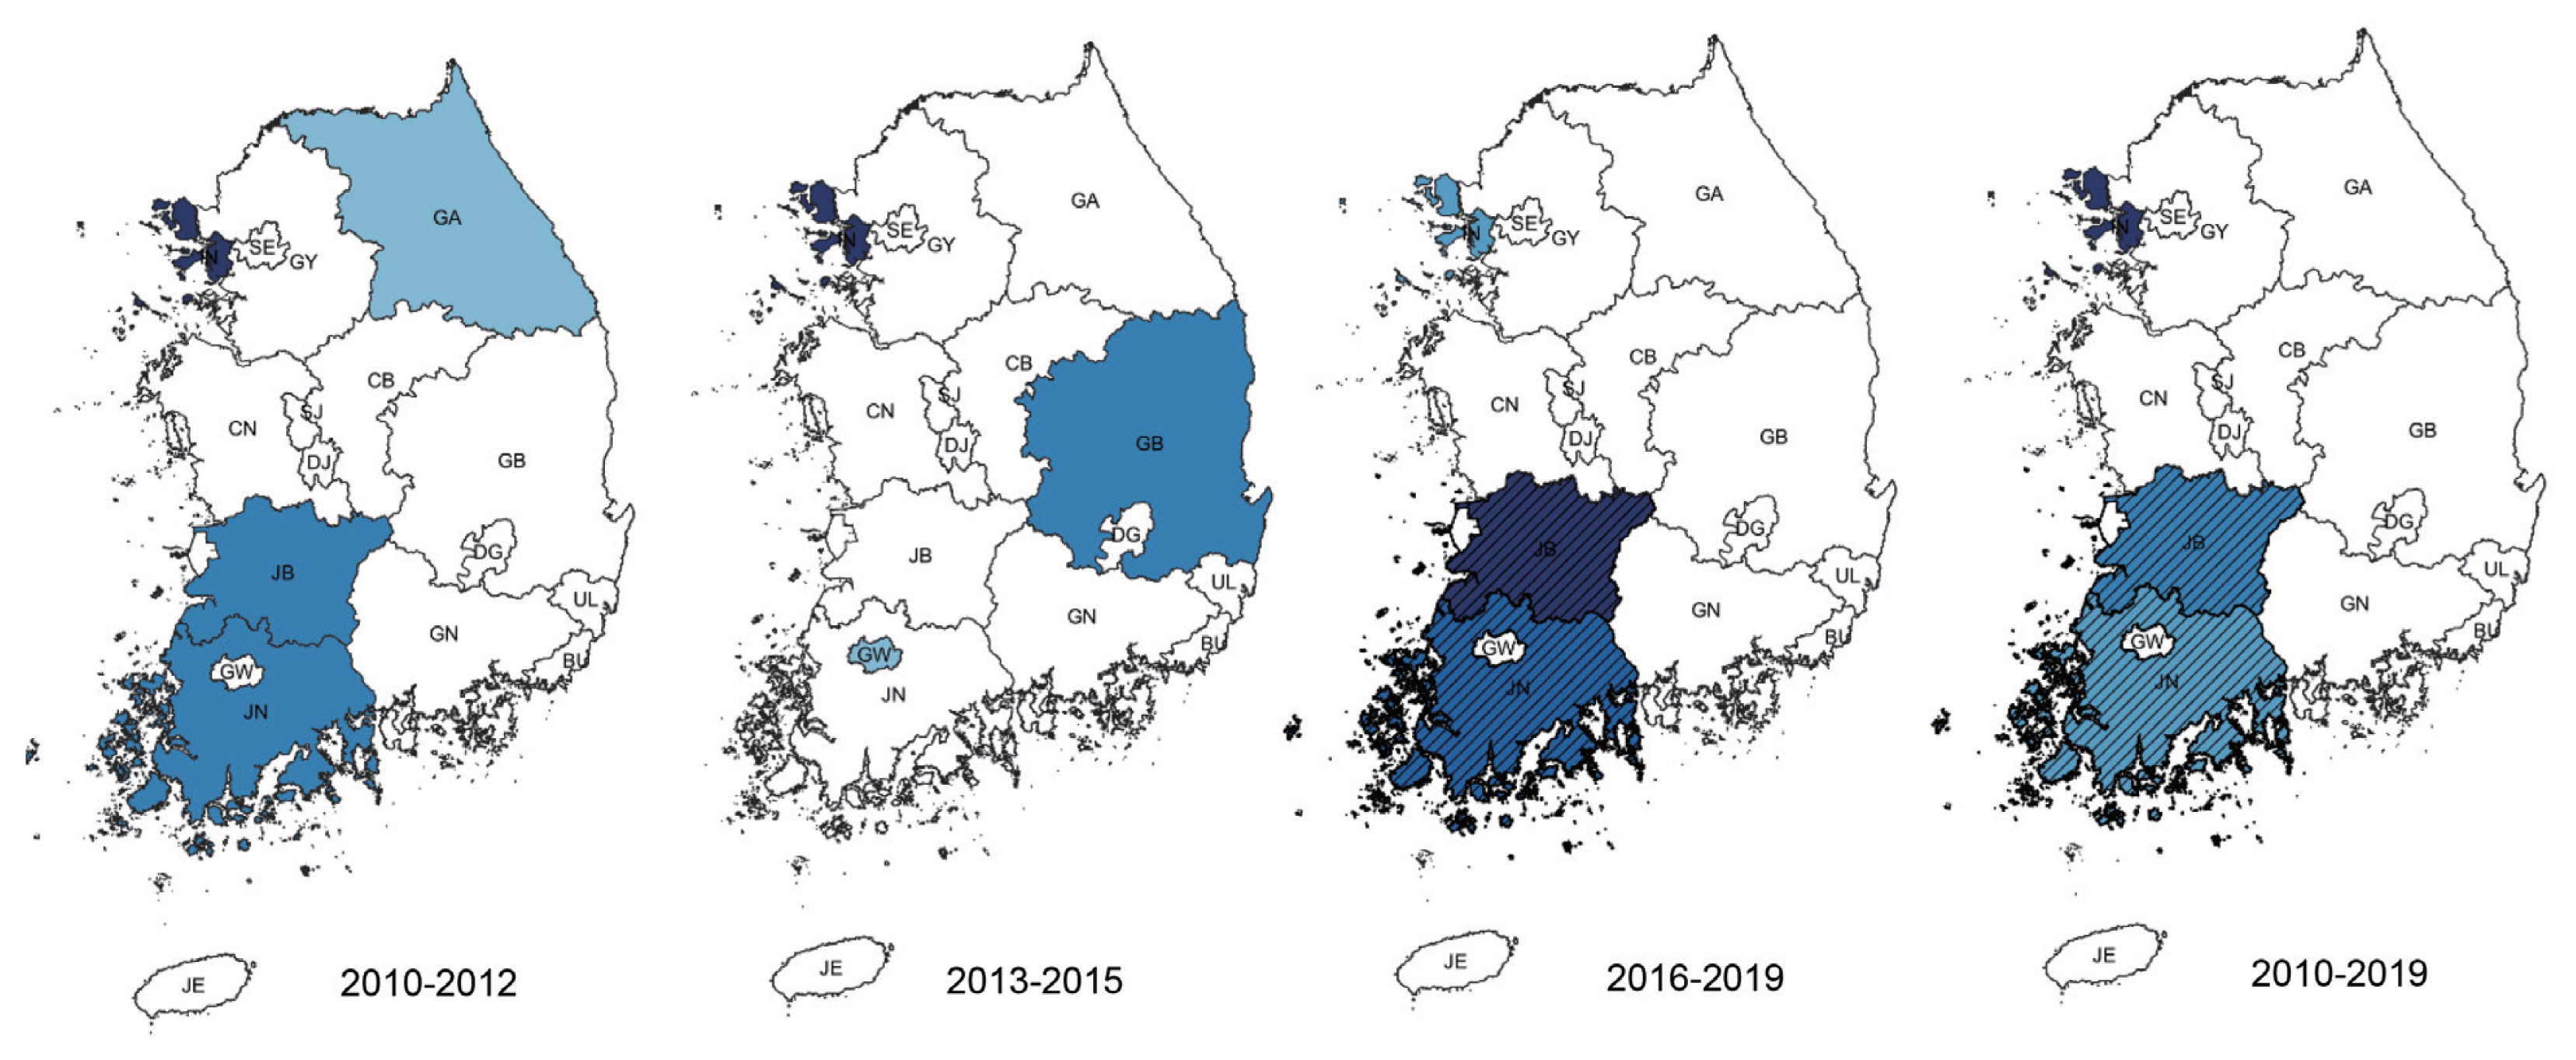
Clusters detected for all cases of malaria. Area codes represent administrative districts of the Korean government. Light to dark blue gradient indicates increasing order of log likelihood ratio. Dashed lines represent a joint cluster.
Among clusters detected for P. falciparum, Jeollanam-do was the MLC (RR=4.22, LLR=171.545) during the whole period. The next likely cluster was Gangwon-do (RR=1.46, LLR=5.146) (Table 2). Jeollanam-do was a significant at all tertiles, while Gangwon-do (RR=1.46, LLR=5.146) was only significant at the earlier tertile (Fig. 2). Incheon was the MLC (RR=2.45, LLR=159.540) for P. vivax during the whole period (Table 2), and also the only significant cluster at all tertiles (Fig. 3). The MLC for P. malariae was Gangwon-do (RR=5.96, LLR=33.013) during the whole period (Table 2). Gyeongsangnam-do was the MLC (RR=1.86, LLR=8.853) for P. ovale during the whole period. Gwangju was the second (RR=2.18, LLR=7.316), and Jeollabuk-do was the third likely cluster during the whole period (RR=1.87, LLR=5.398) (Table 2).
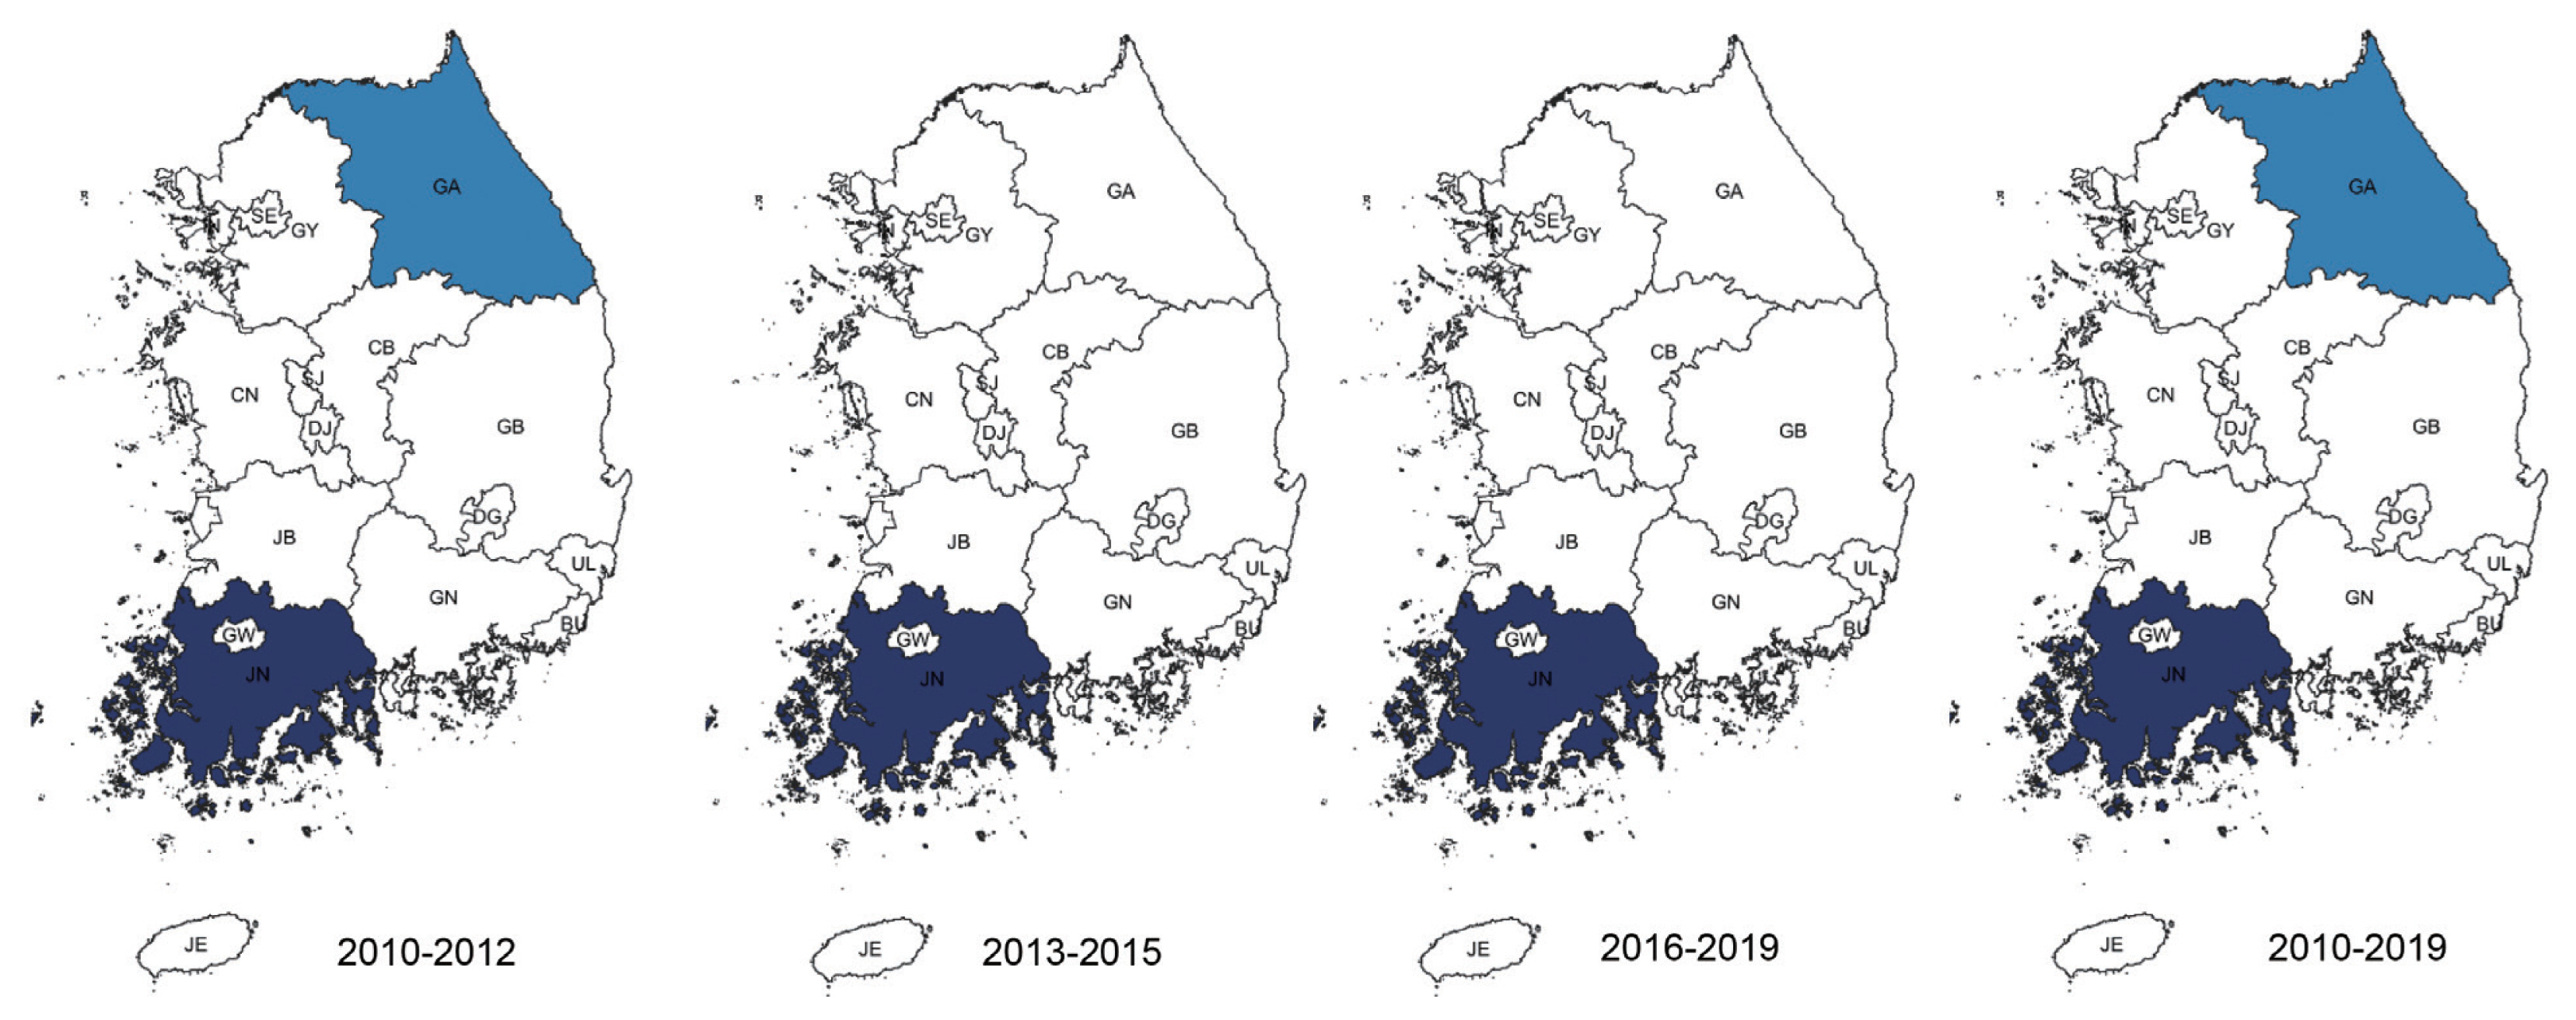
Clusters detected for P. falciparum. Area codes represent administrative districts. Light to dark blue gradient indicates increasing order of log likelihood ratio.

Clusters detected for P. vivax. Area codes represent administrative districts. Incheon was the most likely cluster.
For clinically diagnosed malaria, Jeollabuk-do was the MLC (RR=1.91, LLR=142.846) for the whole period, followed by Incheon (RR=1.37, LLR=40.797), Jeju-do/Jeollanam-do (RR= 1.26, LLR=18.776) and Gyeongsangbuk-do (RR=1.16, LLR= 7.973) (Table 2).
Temporal trends
Temporal trends analysis for the whole study period showed that malaria infection rate was decreasing in most clusters (Fig. 4) Gwangju showed an increasing rate for all cases of malaria (+8.8%, LLR=73.128), P. vivax (+6.03%, LLR=6.866) and clinically diagnosed cases (+17.25%, LLR=85.970). P. falciparum showed decreasing rates in Jeollanam-do/Jeollabuk-do/Jeju-do/Daejeon (−4.70%, LLR=20.700) and Gyeongsangbuk-do/Daegu/Chungcheongbuk-do (−23.70%, LLR=9.456) joint clusters. Other clusters detected by purely spatial analysis showed varying degrees of decreasing rates (Table 3).
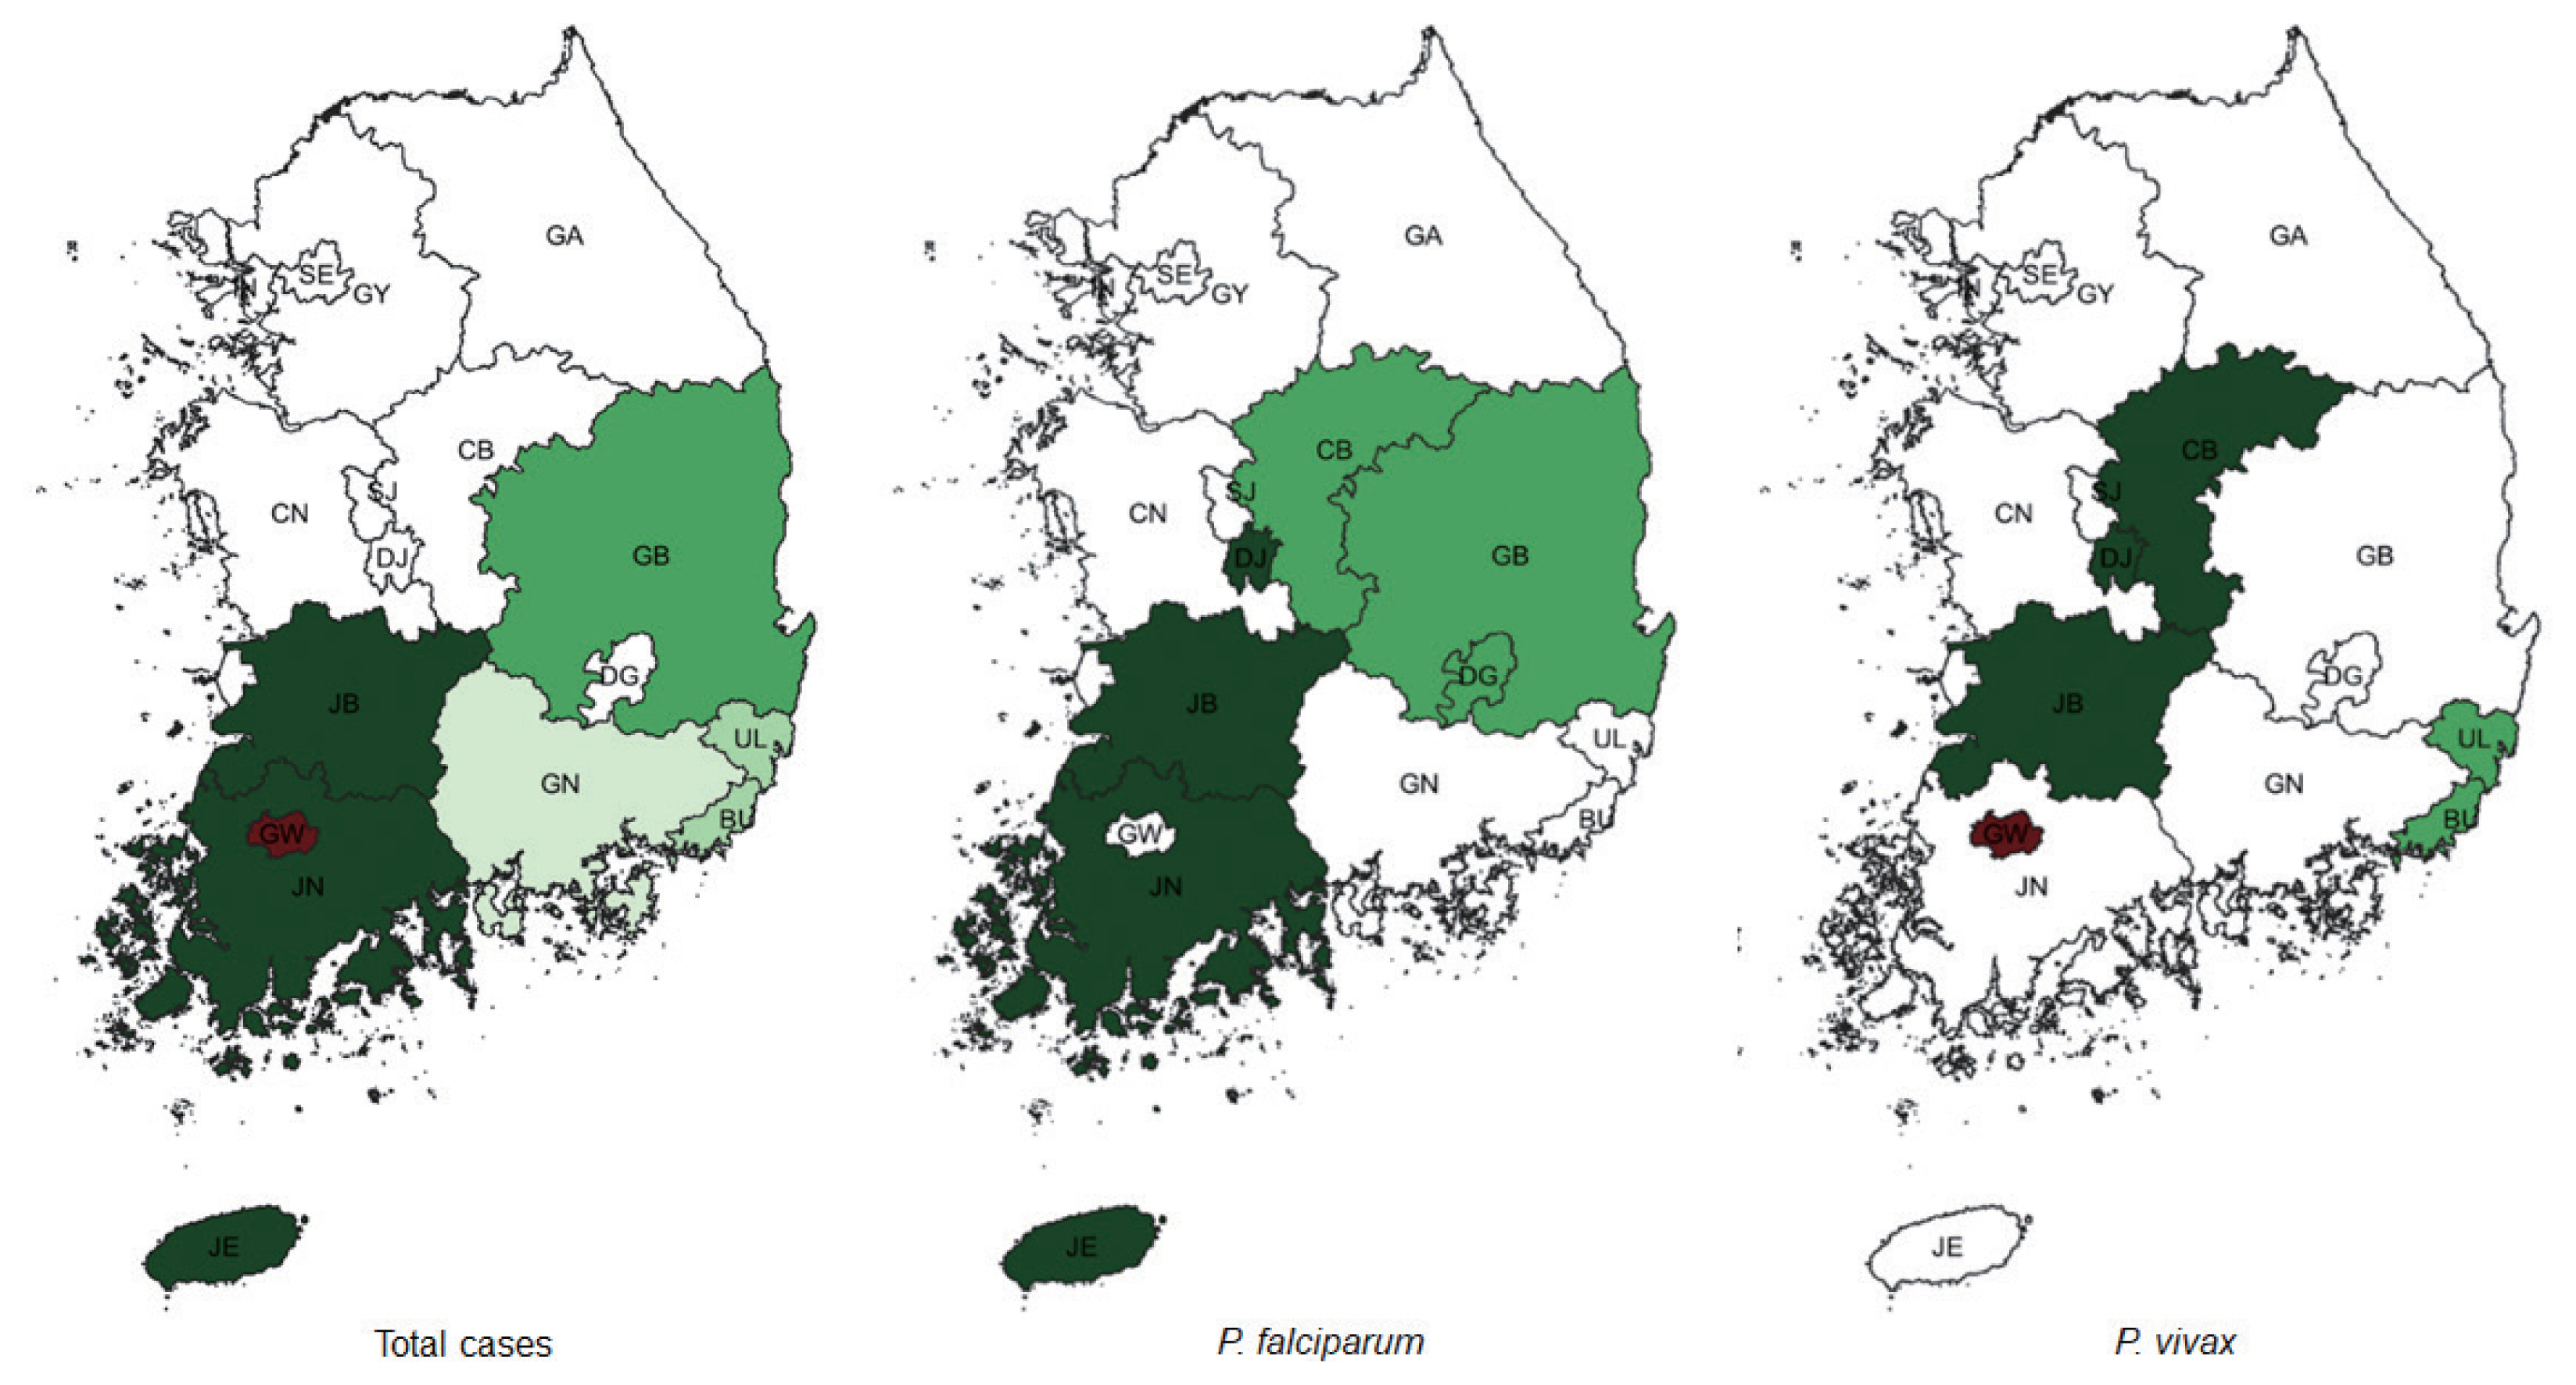
Spatiotemporal trends of malaria. Area codes represent administrative districts. Green represents clusters that showed decreased rate over the period of 2010–2019. Light to dark green gradient indicates increasing order of log likelihood ratio. Red represents clusters that showed increase over the same period.
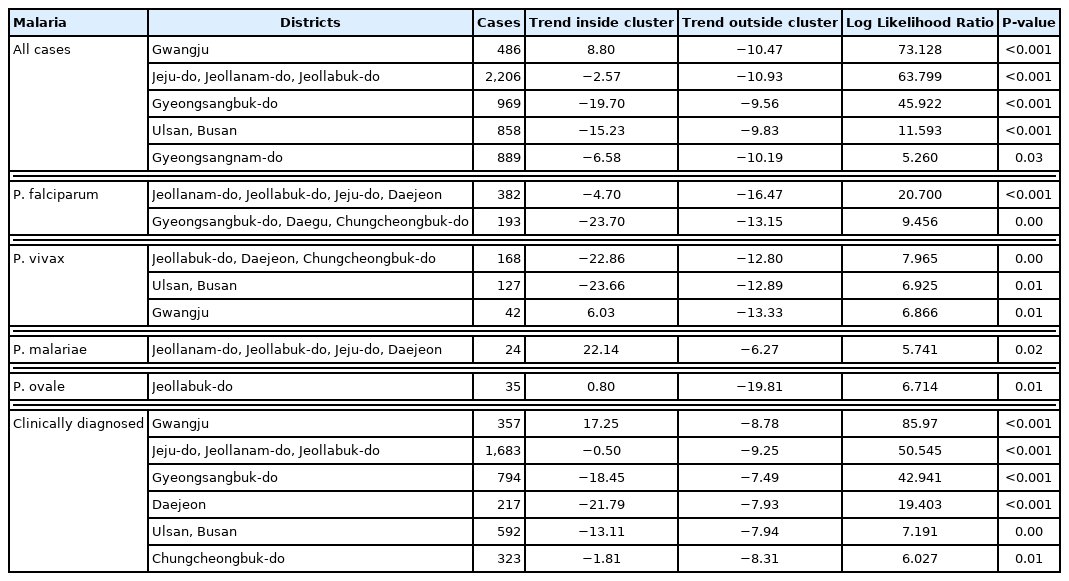
Temporal trends of malaria
DISCUSSION
The present study provides an analytical overview of the latest malaria status in Korea by determining disease clusters and evaluating temporal trends during 2010–2019.
Korea is a peninsula, but the northern border is a demilitarized zone (DMZ) and cut off from the rest of Asia by North Korea. The result is virtually an isolated island, and contact with the outside world is limited to air- and sea-routes. The western and southern parts have numerous islands that number around 5,000, and a fair number of them are inhabited. This means limited resources stretched over a large area with isolated populations, a potential health hazard for the related authorities.
In terms of climate, Korea is mostly located in the temperate zone, except for Jeju-do, but global warming has caused semi-tropical climate changes in the southern parts of the mainland. These factors might have caused an influence in the increased rate of various infectious diseases.
With recent economic prosperity large numbers of Koreans are enjoying travelling, both domestic and international. And especially among the young generation, their interest has shifted from urban travel to seeking out nature as it is. Trekking, hiking, wildlife experiences, and related outdoor life have become the trend. This may also have an effect on the spread of malaria.
We included the data on clinically diagnosed malaria without parasitological confirmation. This was a point of debate among the authors. The purpose of this study was to determine the current status of malaria in Korea, so we decided to include it.
When all cases of malaria during the whole study period were evaluated, significant clusters were observed in the western part of Korea, mainly Incheon and the Jeolla area (Jeollabuk-do and Jeollanam-do). Gangwon-do, and Gyeongsangbuk-do were clusters during the first tertile (2010–2012).Located in the western part of Korea, Incheon is the main access point for international travel and commerce, and its proximity with China has resulted in a large number of Chinese imigration. The outermost regions are also adjacent to North Korea. The Jeolla area is mainly an agricultural zone located in the west. Additionally, together with Incheon, fishery is also important in this area. Both are labor intensive, and with the Korean population declining and growing old, it has resulted in a large influx of foreigners, mainly from Southeast Asia, but also from Africa and South America.
Gangwon-do has a relatively small population spread over a large area. The DMZ is located in its northern part, which means an even smaller civilian population. Ironically, despite its name, this place is one of the most militarized area in the world, and generally off limits to civilians. The result is one of the most preserved natural habitats in the world abounding with wildlife. Because of its location between the two Koreas and the absence of humans, animals move freely into both countries. Apart from the preservation of nature that results in potential animal reservoirs of zoonosis, a large number of soldiers are stationed in this area. This has interesting consequences. Technically still at war, Korea has military conscription, so male citizens between the ages of 18 and 28 have to perform compulsory military service. A large number are also stationed in Incheon. After military service, these young men go back home, all throughout Korea. They might play a role in disease reservoir and spread of disease.
P. falciparum clusters were observed in Jeollanam-do and Gangwon-do. As mentioned above, Jeollanam-do is located in the southwestern part of Korea, and has an almost semi-tropical climate at times. Agriculture and fisheries require massive influx of foreign labor force, which might all be significant. Indigenous falciparum malaria has not been reported [7]. Gangwon-do was a cluster in the first tertile. This could have been caused by the large number of soldiers stationed in the DMZ. In 1979 the WHO officially certified that Korea was a malaria-free country [18], but vivax malaria re-emerged in 1993 in a soldier. Massive efforts were enforced to contain the disease, and this might have inadvertently caused the decrease in P. falciparum.
Vivax malaria has been an endemic infectious disease in the Korea for a long time [7]. Although it has re-emerged, renewed eradication programs have been put in force. Our study shows that Incheon is a significant cluster. Most cases at the beginning of the vivax malaria outbreak occurred among soldiers stationed near the DMZ in the northern part of Gyeonggi and Gangwon-do, and among veterans who had been discharged. This suggested that North Korea might be a major reservoir of vivax malaria, and Incheon is also adjacent to North Korea. Another interesting point to consider it that the re-emerged P. vivax in Korea has genealogical origin in Southern China. As mentioned above, Incheon is major point of contact with China [19].
P. malariae causes the most benign form of malaria infection, and has several distinct clinical features [20]. It has been detected in the Greater Mekong Subregion (GMS) of Southeast Asia [21]. Foreign workers from this region can be seen frequently in Korea, and this population might have been reflected in the cluster found in our study. This region also happens to be a favorite destination for Korean travelers. A cluster was observed in Gangwon-do.
P. ovale occurs mainly in sub-Saharan Africa and islands of the western Pacific [22], and often presents as mixed infections with other Plasmodium species. The Gyeongsang area has a large population, and thus has major international airports that connect to the West Pacific countries, another favorite destination for Korean travelers. As a result, in contrast to the other Plasmodium species, a P. ovale cluster was observed in Gyeongsangnam-do. Gwangju Metropolitan City is located roughly at the geographic center of the Jeolla area, and as its name implies, is host to major medical resources, so that complicated cases from this area might have been referred to Gwangju, thus resulting in a cluster.
In the case of clinically diagnosed malaria without parasitological confirmation, the symptoms and signs might have been obvious enough to have been diagnosed without confirmation. Clusters were observed throughout the country, except for most major metropolitan cities (Seoul, Daejon, Daegu, Ulsan, Busan), Gyeonggi-do and the Chungcheong area. The major cities and Gyeonggi-do are far more industrialized and urbanized, with better access to medical resources. This may have helped in lowering the malaria risk.
On the other hand, while the Chungcheong area is situated in the middle of Korea, it tends to be isolated in some places, and its medical resource is far from satisfactory. Thus, its low rate of malaria is a paradox, but this might have been caused because its patients would simply just visit a medical facility in a nearby city. Being in the middle of everywhere, travelling is facilitated by extensive road and railway infrastructure. And being an inland area, global warming might have had a lesser impact.
Significant clusters with either increasing or decreasing rates of malaria were mainly located in the southern part of Korea. Evaluation for all of cases of malaria showed decreasing trends in the southern parts, except for Gwangju. The city might function as the main medical support system for the surrounding area, so complicated cases would all end up here, resulting in an increasing trend (8.8%) compared to areas outside of the cluster (−10.47%).
Clinically diagnosed cases showed a similar trend, with Gwangju showing an increase of 17.25% in comparison to a decrease of −8.78% in other areas. General trends showed that these cases decreased initially, but increased again. This may have resulted in the significant increase observed in Gwangju. Despite being a major cause of malaria, P. falciparum showed a decreasing rate. Aggressive malaria containment measures seem to have been effective. P. vivax also showed a decreasing trend, but was increasing in Gwangju (6.03% vs. −13.33%). Its role as a health resources hub again seems to be responsible. Interestingly, the general trend of P. vivax showed that although cases were decreasing in number, the adjusted numbers were high and concentrated around Incheon, Gyeonggi-do and Seoul. This might potentially reflect the fact that aggressive anti-malaria health measures were effective in controlling vivax malaria elsewhere.
Although the cases are fewer in number, P. malariae showed an increasing trend in the Daejon/Jeolla area/Jeju-do joint cluster (22.14% vs. −6.27%), while P. ovale was increasing in Jeollabuk-do (0.80% vs. −19.81%). A climatic factor, such as higher average temperature or rainfall might have been possible during this period, with facilitated survival of the pathogens. Also, an increased influx of potential hosts from afflicted areas, both Korean and foreign, might have been responsible for this changing trend. These variants might occupy an ever more significant niche, and in the future, even surpass vivax and falciparum malaria.
In conclusion, after taking account of indigenous malaria with various health measures, global warming seems to be the factor most responsible for malaria in Korea as the southern regions are most affected.
ACKNOWLEDGMENTS
I dedicate this study to my late father Han Doo Kim, who has made me what I am today, and who with his intense curiosity for all things, taught me to strive for knowledge above all.
This study was supported by a research grant from the Korean Association of Health Promotion (No. 2015-01), Republic of Korea.
Notes
The authors declare no conflict of interest related to this study.