Free-Living Amoeba Vermamoeba vermiformis Induces Allergic Airway Inflammation
Article information

Abstract
The high percentage of Vermamoeba was found in tap water in Korea. This study investigated whether Vermamoeba induced allergic airway inflammation in mice. We selected 2 free-living amoebas (FLAs) isolated from tap water, which included Korean FLA 5 (KFA5; Vermamoeba vermiformis) and 21 (an homolog of Acanthamoeba lugdunensis KA/E2). We axenically cultured KFA5 and KFA21. We applied approximately 1×10⁶ to mice’s nasal passages 6 times and investigated their pathogenicity. The airway resistance value was significantly increased after KFA5 and KFA21 treatments. The eosinophil recruitment and goblet cell hyperplasia were concomitantly observed in bronchial alveolar lavage (BAL) fluid and lung tissue in mice infected with KFA5 and KFA21. These infections also activated the Th2-related interleukin 25, thymic stromal lymphopoietin, and thymus and activation-regulated chemokines gene expression in mouse lung epithelial cells. The CD4+ interleukin 4+ cell population was increased in the lung, and the secretion of Th2-, Th17-, and Th1-associated cytokines were upregulated during KFA5 and KFA21 infection in the spleen, lung-draining lymph nodes, and BAL fluid. The pathogenicity (allergenicity) of KFA5 and KFA21 might not have drastically changed during the long-term in vitro culture. Our results suggested that Vermamoeba could elicit allergic airway inflammation and may be an airway allergen.
INTRODUCTION
We are easily exposed to free-living amoebas (FLAs), which are spread all over our living environment [1]. FLAs can be found in everywhere including dust, soil, seawater, lakes, and the atmosphere [2,3]. Theses FLAs are widely distributed and feed on bacteria and other microorganisms [4], and FLA infections are known to predispose the host to numerous diseases [5–7]. Some Acanthamoeba species reportedly caused granulomatous amoebic encephalitis and a chronic fatal disease of the central nervous system [8,9]. This FLA can also reproduce in contact lens wearers, causing amoebic keratitis, which is the most common infectious disease caused by FLAs [10]. These suggest that FLAs sufficiently act as a source of infection.
Recently, our group suggested that Acanthamoeba could elicit allergic airway inflammation in mice [11]. We applied Acanthamoeba to mice’s nasal passages and observed the pathological responses. There was high air resistance, inflammatory cell infiltration increased in bronchial alveolar lavage (BAL) fluid, and Th2 cytokines levels were upregulated. These events were potently triggered by excretory-secretory protein of Acanthamoeba via protease-activated receptor 2 signaling [11]. Allergic airway inflammation results in shortness of breath and wheezing. In the immune system, the lungs become prone to eosinophil infiltration with the upregulation of type 2 T helper (Th) cells [12]. Immunoglobulin (Ig) E switching is also elevated in serum. Mucus secretion is also increased [13].
Although there is no report to date on the pathogenicity of Acanthamoeba, it should be noted that this is very common FLA, which may contribute to invoke an allergic response to some sensitive people. We previously showed that some patients with allergic reactions to unknown causes had antibodies that reacted to Acanthamoeba antigen. In the skin-prick testing, 44.6% revealed a positive reaction to one or more common aeroallergens. Acanthamoeba allergenicity was observed in 6.1%. An Acanthamoeba-positive reaction was closely related to several allergens including poplar, willow tree, elm, velvet grass, oak, and cockroach [14]. We also found the allergen to be profilin of Acanthamoeba, which could elicit allergic airway inflammation in mice [15].
In a previous study, we isolated many kinds of FLAs from tap water from public facilities in Korea [3]. Using 18S rDNA sequencing analysis, we found that some of these FLAs had very similar genetic characteristics to Vermamoeba vermiformis and Acanthamoeba lugdunensis KA/E2 isolated from keratitis. To determine their pathogenicity, we selected 2 FLAs: Korean FLA (KFA) 5 (V. vermiformis) and KFA21 (A. lugdunensis KA/E2) [3]. We also demonstrated the pathogenicity and allergenicity of A. lugdunensis KA/E2.
In the present study, we raised following 2 questions: i) is Vermamoeba pathogenic or allergenic? and ii) could the culture period of Acanthamoeba in the laboratory reduce their pathogenicity or allergenicity? To answer these questions, we induced allergic airway inflammation to mice via KFA5 and KFA21 infection. After inducing allergic airway inflammation, we compared their results with those of A. lugdunensis KA/E2 and checked the possibility of pathogenicity and allergenicity of the 2 environmental FLAs.
MATERIALS AND METHODS
FLA cultivation
The Acanthamoeba sp. KFA21 strain were cultured in peptone yeast glucose medium at 25°C. Vermamoeba sp. KFA5 were maintained in same medium and culture condition. The maintenance of these amoeba was previously described [17]. Trophozoites were detached from plates and washed 3 times with sterile phosphate buffered saline (PBS). After washing, counted trophozoites were intranasally introduced to mice. KA and E2, whose specific IgE antibody was detected in asthma patients [11,14,16] were also used.
Mouse experimental design
Six-week-old C57BL/6 male mice were obtained from from Hana Co. (Busan, Korea). Mice breeding was conducted in a pathogen-free animal facility. The animal study protocol was approved by the Institution animal Care and Use Committee of the Pusan National University (PNU-2018-2080). The mice were sensitized with 1×10⁶ of FLAs or PBS every day for 6 days (Fig. 1A). Allergic airway inflammation was induced as previously reported with minor modifications [11].
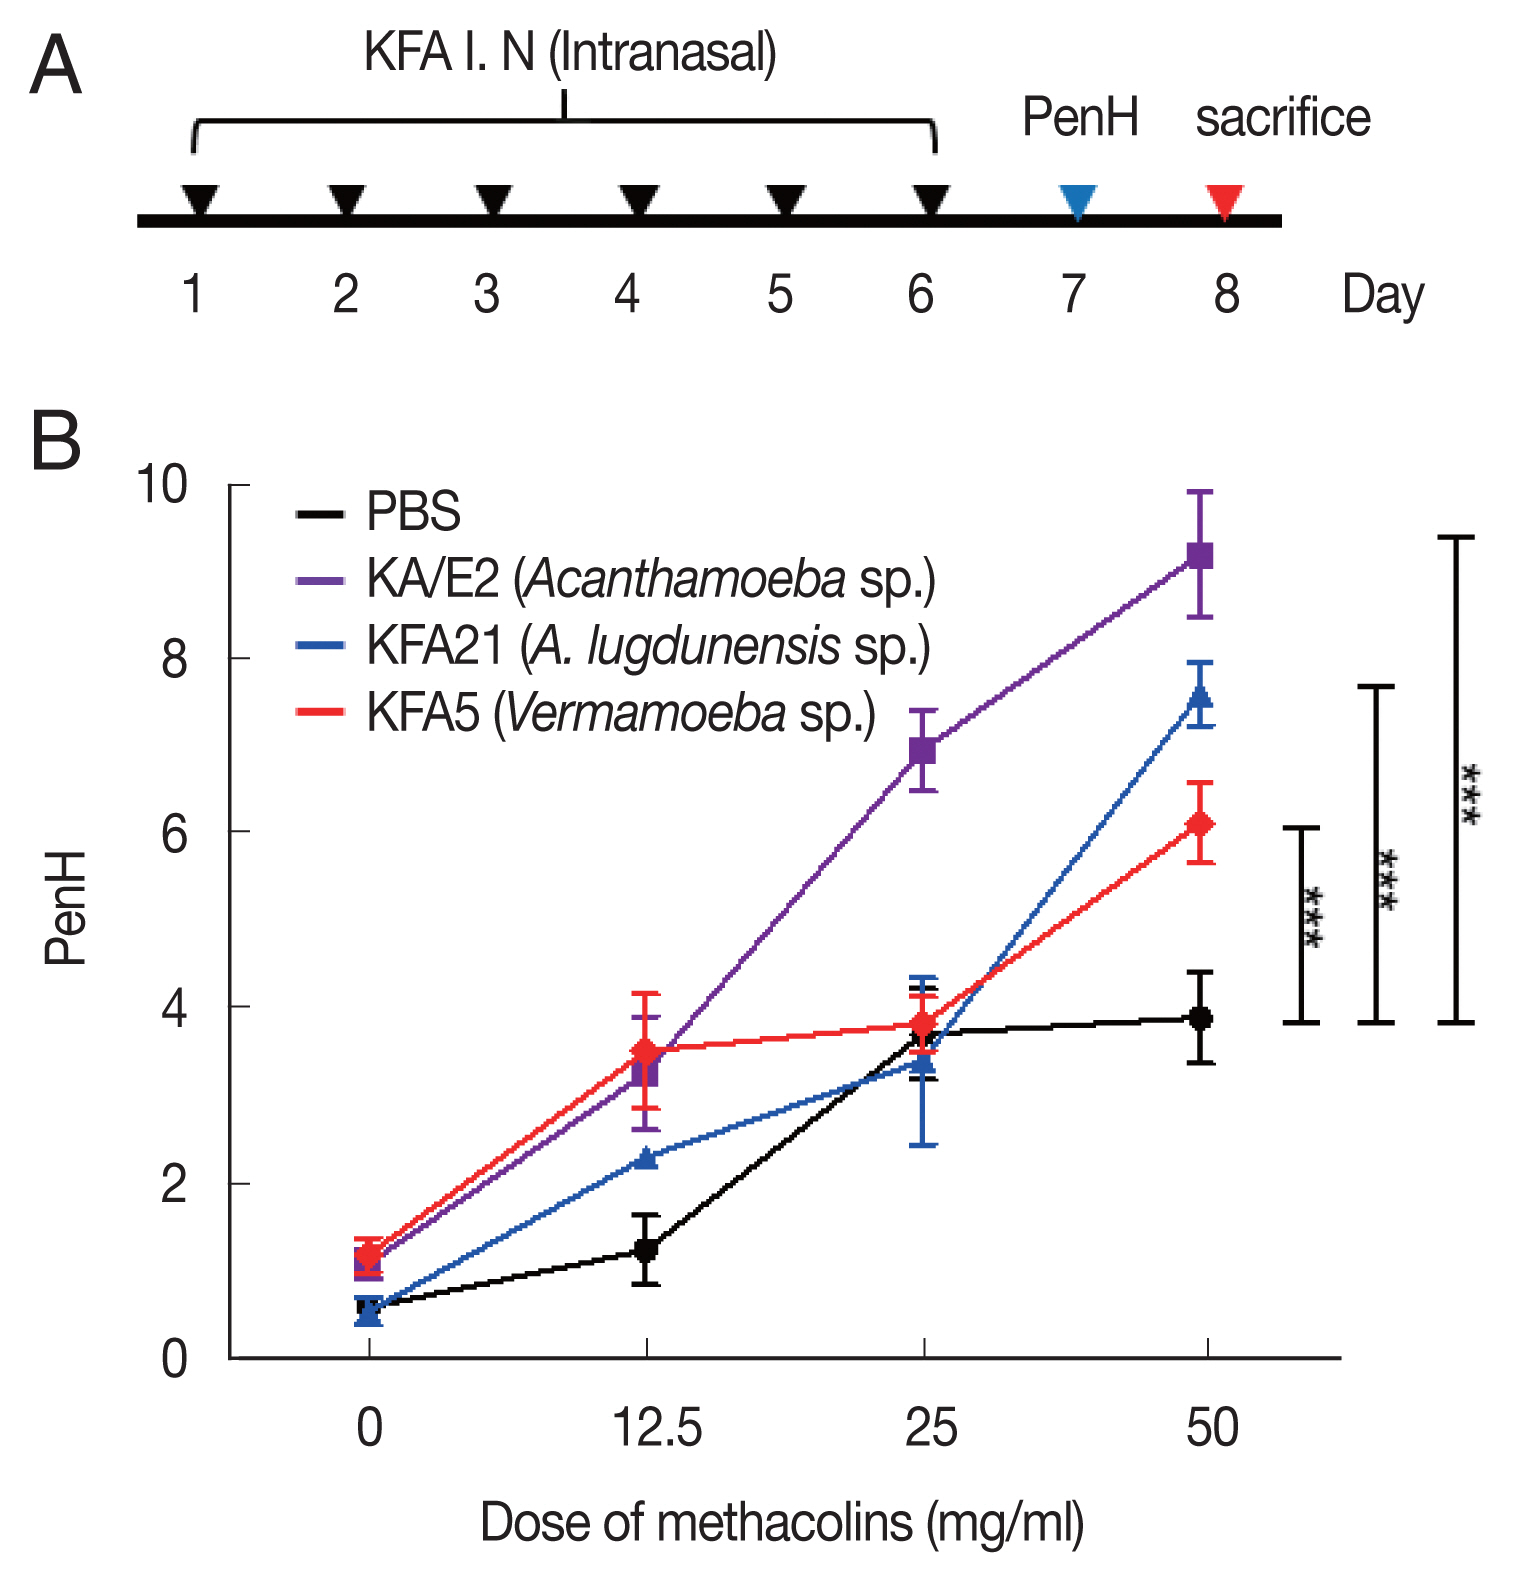
Inducing allergic airway infiltration by 6 challenge of 2 FLA. We applied 1×10⁶ FLA intra-nasally 6 times to induce an infection (A). The enhanced pause (PenH) was evaluated at baseline and after treatment with increasing doses of aerosolized methacholine (0–50 mg/ml) (B). (***P<0.001, n=5 mice/group, 3 independent experiments).
Measurement of airway hyperresponsiveness (AHR) to methacholine
We measured the AHR in conscious and unrestrained mice using non-invasive whole-body plethysmography (Allmedicus, Seoul, Korea) [13], 24 h after the last sensitization with FLA. In brief, the mice were placed in a plethysmography chamber and exposed to increasing concentrations of aerosolized methacholine at 0, 12.5, 25, and 50 mg/ml for 10 min. The enhanced pause (PenH) was calculated automatically according to the mean pressure generated in the plethysmography chamber during inspiration and expiration combined with the time of each phase. The PenH values were calculated during each 150 sec interval and then averaged.
Differential cell counting in BAL fluid
To obtain BAL fluid, the tracheas of anesthetized mice were exposed and cut just below the larynx. A polyurethane flexible intravenous catheter tube [0.7-mm outer diameter, 19 mm in length, and attached to a blunt 24-guage needle (Becton Dickinson and Company, Franklin Lakes, New Jersey, USA)] was placed into the trachea, after which the lung lavage was done for 1 time with 800 μl of sterile cold PBS. The samples were centrifuged at 5,000 rpm for 5 min at 4°C. The supernatants were decanted and immediately frozen at −70°C. Cell pellets were washed twice in PBS. The total cell number was counted using a hematocytometer. The BAL fluid cells were attached for 5 min at 650 rpm with cytospin-X (Hanil, Gimpo, Korea). Adhered cells were stained with Diff-Quick solution (Sysmex Co., Kobe, Japan) and cells were differentially counted according to conventional morphological criteria. At least 100 cells per slide were counted to obtain differential leukocyte counts.
Lung histology
The mice lung tissues, fixed with 4% formaldehyde, were processed to paraffin block. The blocks were sectioned and stained with hematoxylin and eosin. The sections were also stained with periodic acid-Schiff (PAS) solution. After staining, each section was observed under a microscope. The inflammatory score was measured according to the ratio scale: 0=no detectable inflammation; 1=occasional duffing with inflammatory cells; 2=most bronchi or vessels were surrounded by a depth of one to 3 cells; and 3=most bronchial vessels were surrounded by a depth of more than 5 cells [11]. To quantify the goblet cell hyperplasia, the percentage of PAS-positive cells in the epithelium were analyzed in 8–10 tissues per mouse.
Cytokine production
The secretion levels of mouse interleukin (IL)-4, IL-5, IL-13, IL-9, IL-17A, and interferon (IFN)-γ in BAL fluid and supernatants of CD3-stimulated splenocytes and lung-draining lymph nodes were measured. The method of isolation and CD3 stimulation of lymphocytes from the spleen and lung-draining lymph nodes were previously described [11]. The cytokine productions were analyzed using enzyme-linked immunosorbent assay (ELISA) kits in accordance with the manufacturer’s instructions (eBioscience, SanDiego, California, USA). The absorbance of the final reactant was read at 450 nm using an ELISA plate reader (Molecular Devices, San Jose, California, USA).
Fluorescence activated cell sort ACS analysis
To evaluate IL-4-secreting T cells induced by FLAs, isolated cells from the spleen and lung-draining lymph nodes were stimulated inomycin (1 μg/ml), phorbol 12-myristate 13-acetate (PMA, 1 μg/ml; Sigma, St. Louis, Missouri, USA), and golgi-plug (1 μg/ml; Invitrogen, Carlsbad, California, USA) for 4 h in a 37°C incubator. The surfaces of the stimulated lymphocytes were stained with anti-CD4 PE prior to intracellular staining using anti-IL-4 APC (eBioscience) in accordance with the manufacturer’s instructions.
Excretory-secretory protein collection
Excretory-secretory products were concentration of FLA culture supernatant without salt. The FLA culture supernatant was collected at 2-day interval and filtered with a 0.2-μm pore syringe filter. The supernatants were frozen at −70°C and freeze-dried using a freeze dryer (IlShin BioBase, Seoul, Korea), after which the supernatants were dissolved with PBS. In order to remove the salt, an excretory-secretory products were filtered using a desalting column (GE healthcare Bio-Sciences, City, Massachusetts, USA).
Treatment of excretory-secretory products in mouse lung epithelial cells (MLE 12)
MLE 12 cells were purchased from ATCC (ATCC CRL-2110). The cells were cultured with 5 μg/ml of insulin, 10 μg/ml of transferrin, 30 nM of sodium selenite, 10 mM of hydrocortisone, 10 nM of β-estradiol, 10 mM of HEPES, 2 mM of L-glutamine (Sigma), and 2% of fetal bovine serum (Gibco, Grand Island, New York, USA) in DMEM/F12 1:1 media (Gibco) at 37°C in a 5% CO2 incubator. The cells were seeded as 1×10⁵/well on a 24-well plate and cultured for 24 h in the presence of 1 μg/ml excretory-secretory products.
Gene expression levels
RNAs from lung tissue and MLE12 cells were extracted using 700 μl of Tri-RNA reagent (Favrogen, Kaohsiung, Taiwan) in accordance with the manufacturer’s protocols. RNAs (2 μg) were reverse-transcribed using Moloney murine leukemia virus reverse transcriptase (Promega, Madison, Wisconsin, USA). Gene expression levels were measured using a real-time polymerase chain reaction (PCR) with LightCycler 96 (Roche, Basel, Switzerland). Glyceraldehyde 3-phosphate dehydrogenase (GAPDH) was used as a reference gene. Primers sequence have been described previously [11,18].
Statistical analysis
Data were analyzed using Prism ver. 9.3.1 (GraphPad, San Diego, California, USA). Mean±standard deviation was calculated. The significant differences were determined using the one-way ANOVA analysis for variance with a Tukey post hoc test. The results were considered statistically significant at P<0.05.
RESULTS
Acanthamoeba and Vermamoeba sp. infection induced allergic airway inflammation
To examine the pathogenicity of Vermamoeba and environmental isolates of Acanthamoeba, KFA5 and KFA21 were applied to the mouse airway. The outcomes were compared with those of the KA/E2. AHR was significantly increased in the KFA21- and KFA5-infected group compared control (PBS-treated group) (Fig. 1B). The PenH value of KA/E2 after challenge of methacholine (50 mg/ml), higher than those of environmental isolates. However, this was not significantly different with KFA21 and KFA5. Interestingly, total cells in BAL fluid were significantly increased in KFA21- and KFA5-infected mice than in KA/E2-infected mice. The recruitment of eosinophils in the lungs was significantly increased after KFA21 and KFA5 infection. KA/E2 infection also resulted in the same result. The number of macrophages were remarkably decreased after KFA21, KFA5, and KA/E2 infection (Fig. 2A, B). The high levels of eosinophil infiltration around the peribronchial and perivascular areas were observed in KFA21- and KFA5-infected mice as much as in KA/E2-infected mice. However, there was no obvious infiltration of inflammatory cells in the PBS-infected group (Fig. 3A). In addition, goblet cell hyperplasia was greatly increased around the airways in the KFA21- and KFA5-infected group and in the KA/E2-infected group (Fig. 3B). These data collectively demonstrated that KFA21 and KFA5 might induce allergic airway inflammation accompanied by severe asthma symptoms such as eosinophil infiltration, goblet cell hyperplasia, and increased PenH values.
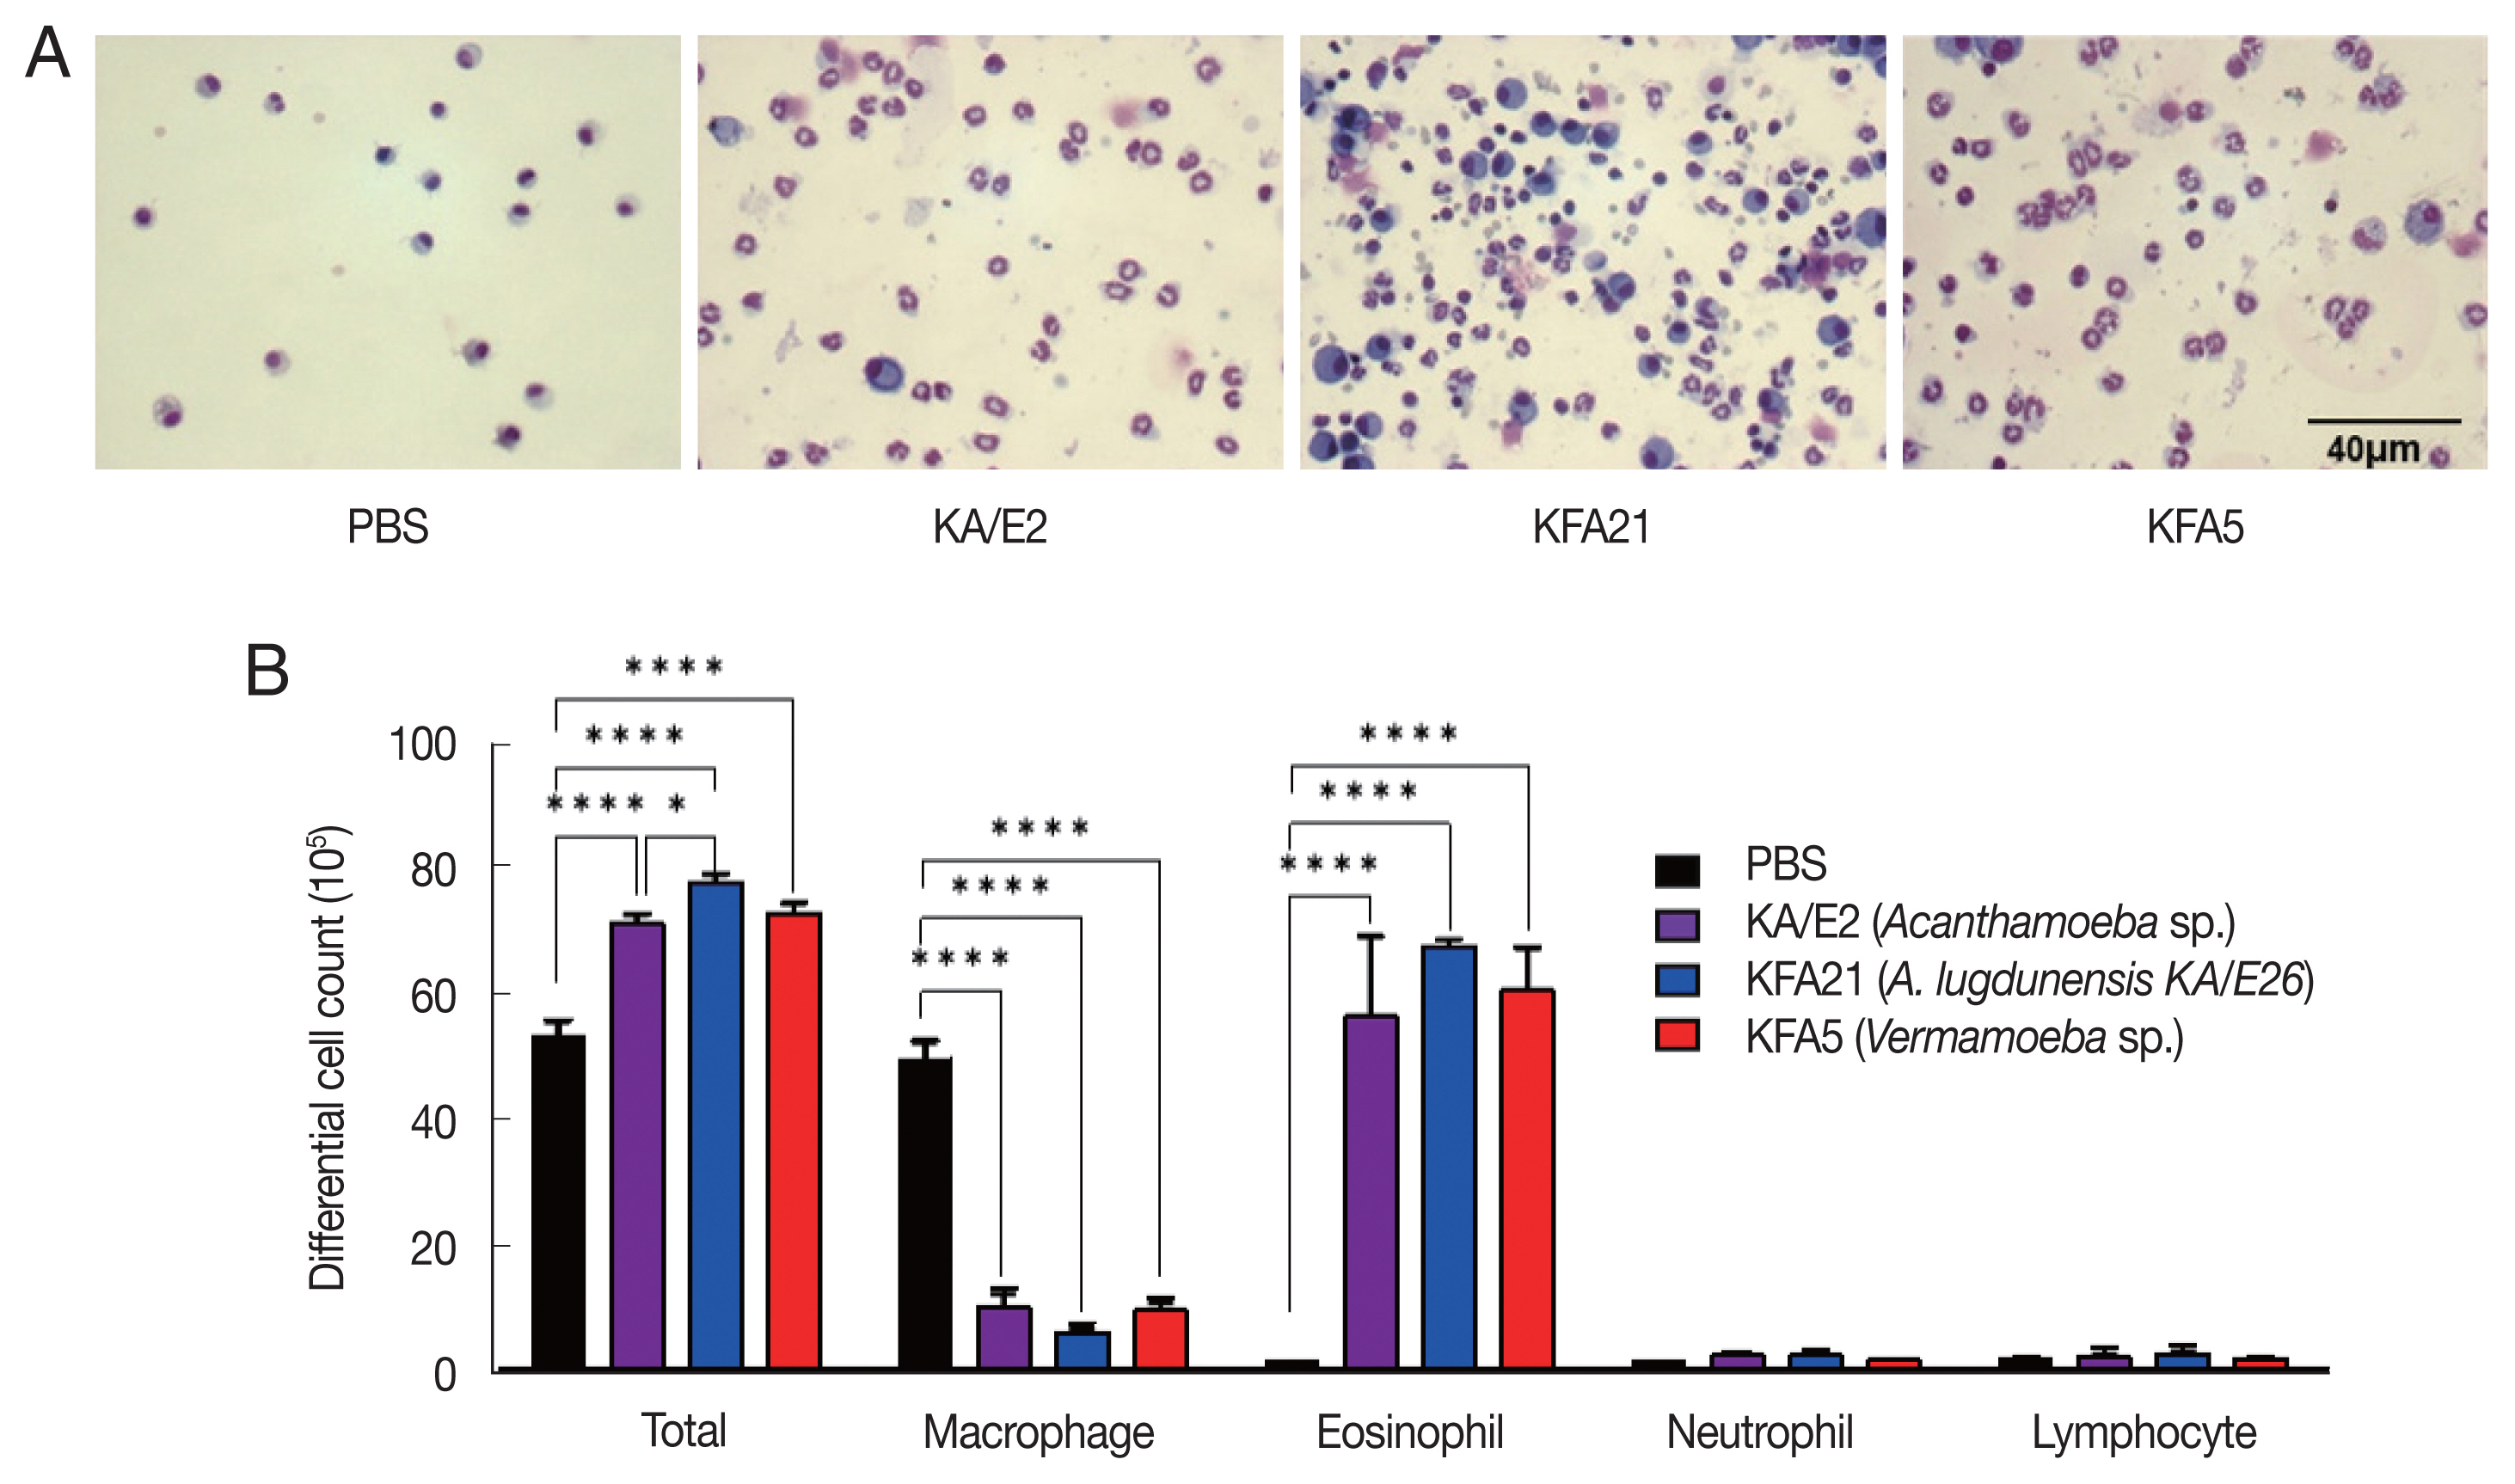
Inflammatory cell infiltration after FLA infection in BAL fluid. After sacrificing the mice, a number of inflammatory cells were isolated and counted. The inflammatory cells in bronchial lavage fluids were stained with Diff-Quick (A). Result of different cell count (B) (**P<0.01; ****P<0.0001, n=5 mice/group, 3 independent experiments).

Asthma signs after FLA treatment. The histological appearance of the lungs after FLA treatment was observed with hematoxylin-eosin staining (A, left panel), and the inflammation score was measured according to the scale described in the material and method (A, right panel). The lung sections were stained with PAS to determine the goblet cell hyperplasia (B). All histological changes were examined 8–10 tissue section per mouse (**P<0.01; ****P<0.0001, n=5 mice/group, 3 independent experiments).
KFA21 and KFA5 induced inflammatory cytokine gene expression in the lungs
In order to investigate the inflammatory reaction during KFA21 and KFA5 infection, the IL-4, IL-5, IL-13, IL-9, IL-17a, and IFN-γ gene expression levels were measured in the lung using quantitative PCR. Th2-related cytokines (IL-4, IL-5, and IL-13), Th17-related cytokines, and IL-17a were significantly increased after KFA21 and KFA5 infection. Th9-related IL-9 and IFN-γ were more highly increased in the KFA21- and KFA5-infected group than in the KA/E2-infected group (Fig. 4).
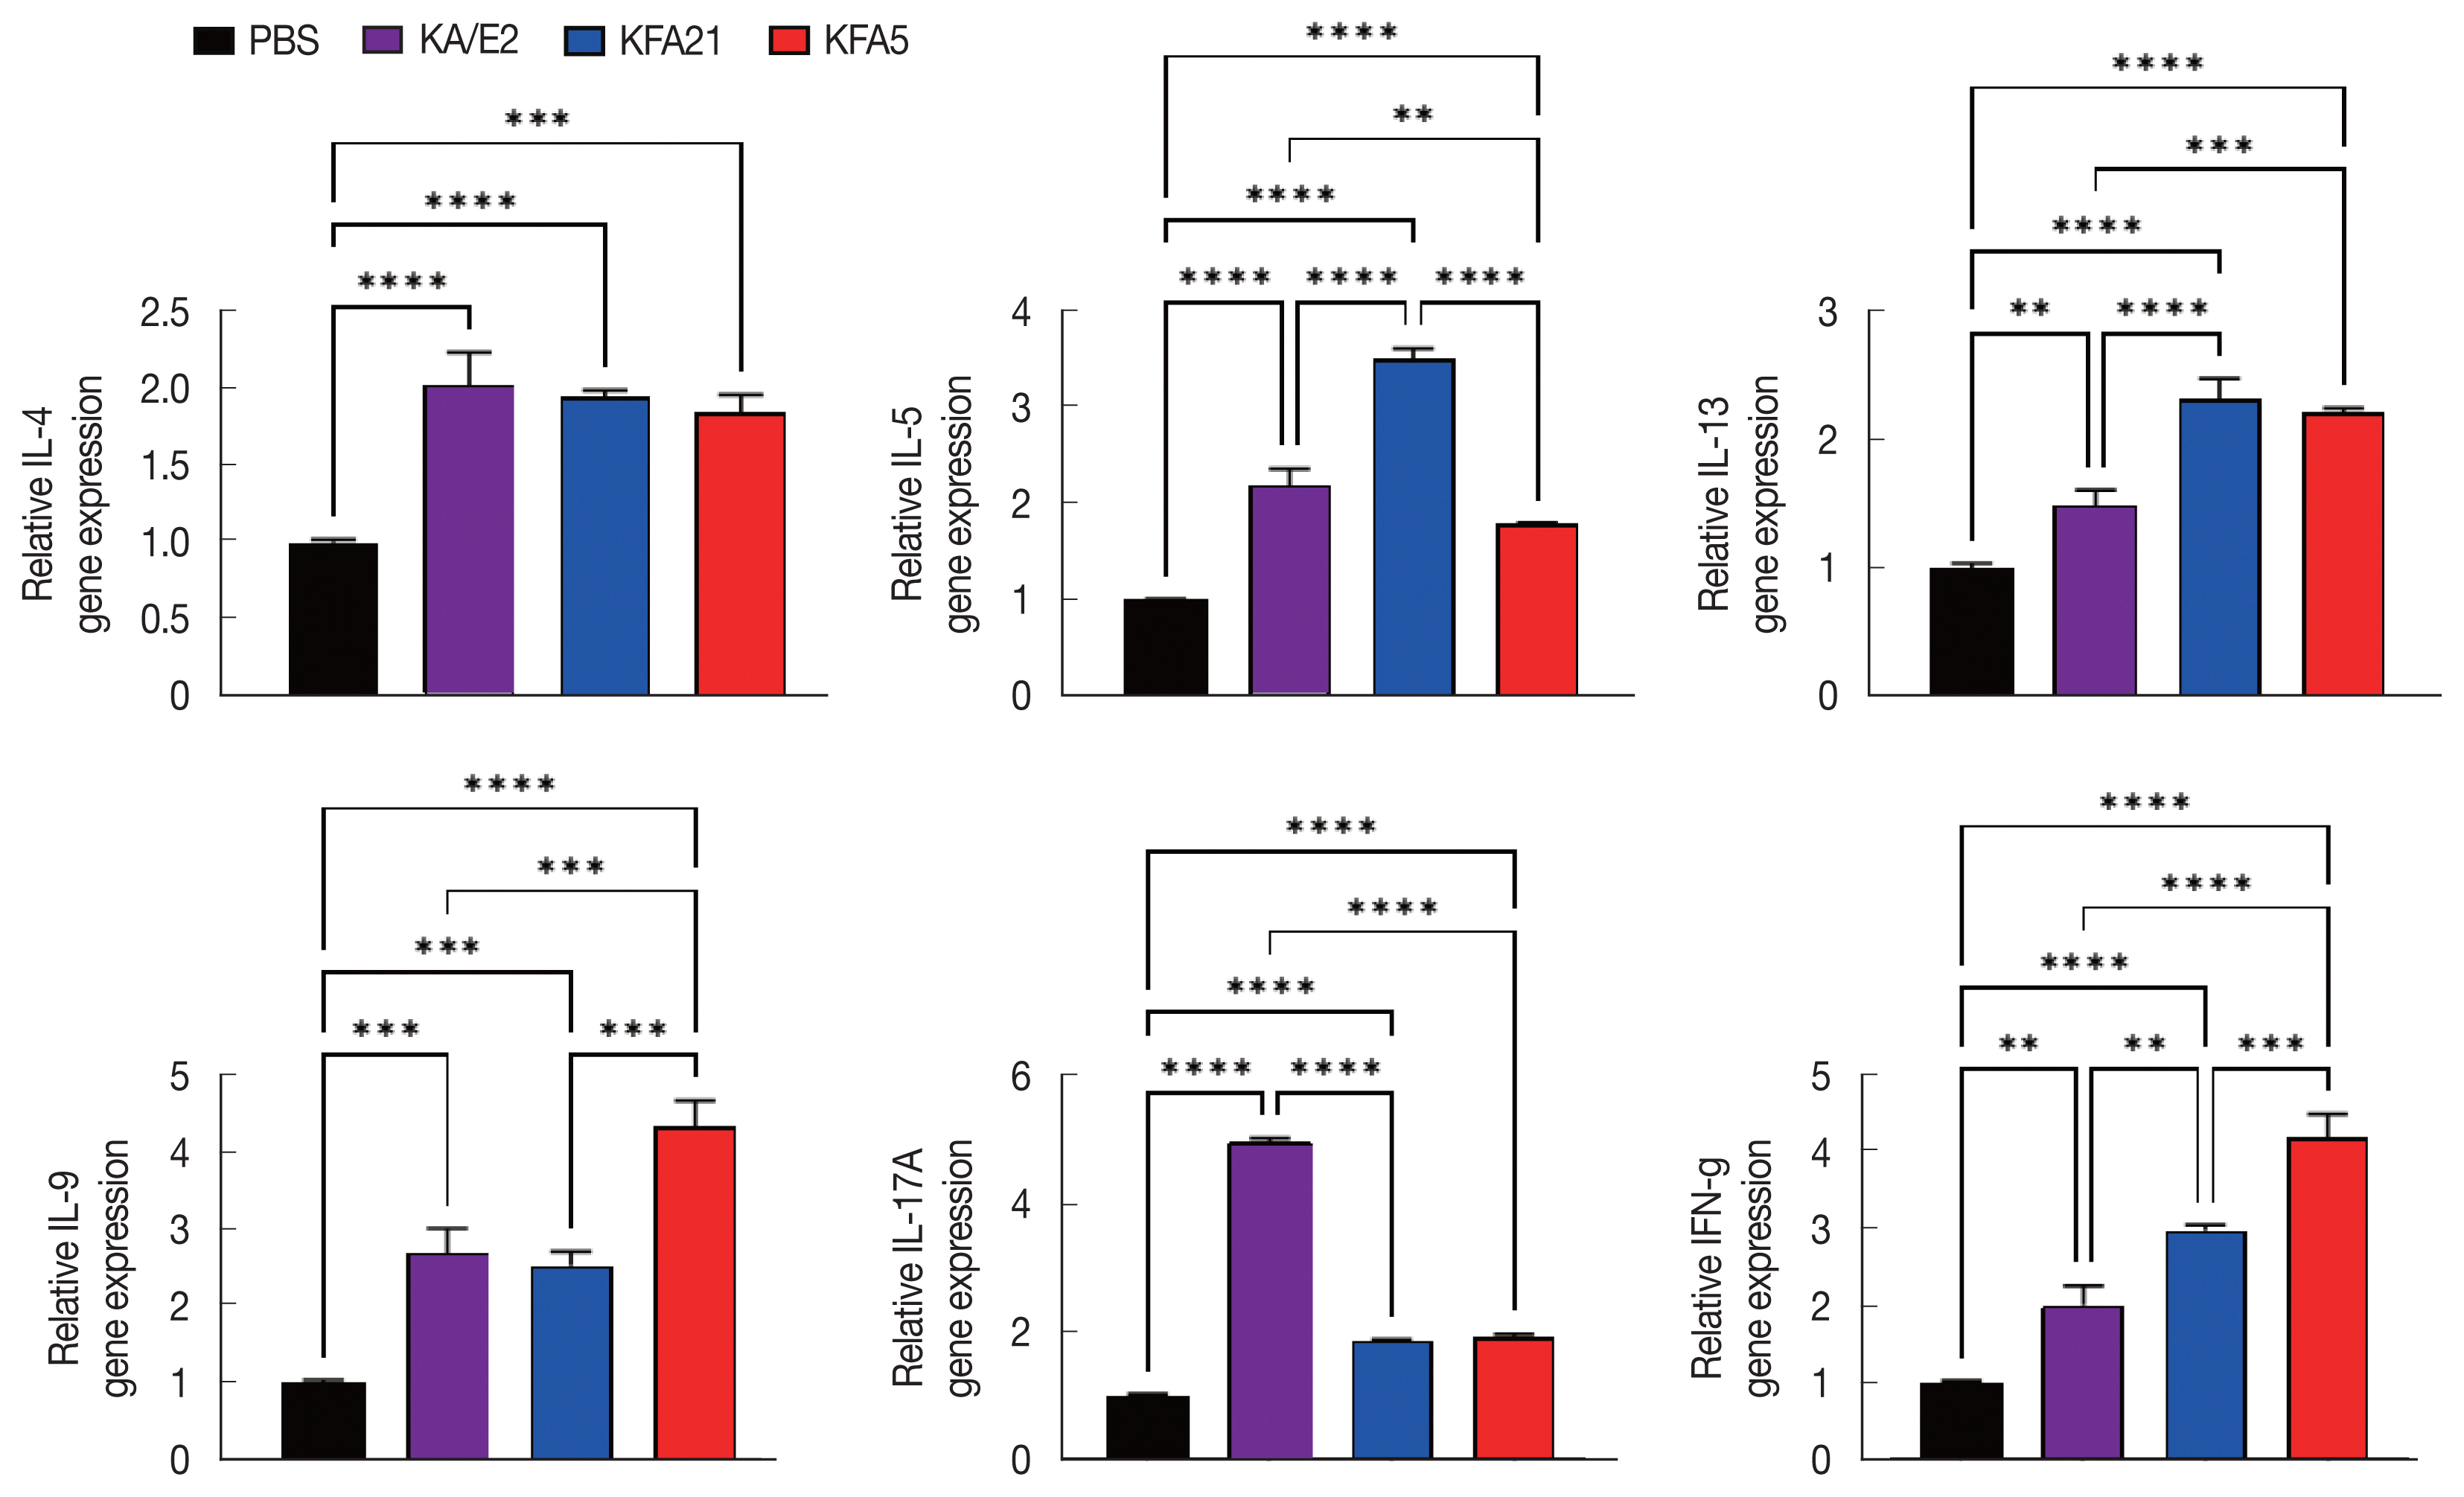
Cytokine gene expression in lung tissue after FLA infection. The expressions of IL-4, IL-5, IL-13, IL-9, IL-17A, and IFN-γ were analyzed by quantitative real-time PCR. GAPDH was used as a control (**P<0.01; ***P<0.001, ****P<0.0001. n=5 mice/group, 3 independent experiments).
Inflammatory cytokine production was increased in splenocytes and lung-draining lymph nodes following KFA21 and KFA5 infection
The population of CD4+ IL-4-secreting T cells was significantly increased in splenocytes after KFA21 and KFA5 infection compared with the PBS-infected group (Fig. 5A). The amount of CD4+ IL-4-secreting T cells in the lung-draining lymph nodes was as high as in the KA/E2-infected group (Fig. 5B). The cytokine concentration was measured with ELISA in the spleen, lung-draining lymph nodes, and BAL fluid. IL-4, IL-5, and IL-13 were markedly increased in the KFA21- and KFA5-infected group. In particular, IL-4 and IL-5 concentrations in the spleen were higher than in the KA/E2-infected group.

FLA infection induced IL-4 secreting cells. The IL-4 secreting CD4+ T cells from the spleen (A) and the lung-draining lymph nodes (B) were analyzed by flow cytometry analysis (*P<0.05; ***P<0.001; ****P<0.0001, n=5 mice/group, 3 independent experiments).
Although there were lower levels of IL-9, IL-17A, and IFN-γ in the KFA21- and KFA5-infected group than in the KA/E2-infected group, these levels were still significantly higher than in the PBS-infected group (Fig. 6A). In the lung-draining lymph nodes, a higher IL-4 concentration was observed in the KFA21-infected group than in the KA/E2-infected group. In the KFA21-infected group, IL-5, IL-13, and IL-9 production was found to be similar with those in the KA/E2-infected group. Th2-related cytokines (IL-4, IL-5, and IL-13) and Th1-related cytokines (IFN-γ) were lower in the lung-draining lymph nodes of the KFA5-infected group than in those of the other amoeba-infected groups. However, Th9-related IL-9 cytokines and Th17-related IL-17A cytokines were higher in the lung-draining lymph nodes of the KFA5-infected group than in those of the KFA21- and KA/E2-infected group (Fig. 6B). Higher concentrations of IL-4, IL-5, and IL-17A were observed in the BAL fluid of the KFA21-infected group than of the KA/E2-infected group. In the KFA21-infected group, IL-13, IL-9, and IFN-γ were lower than those in the KA/E2-infected group but were significantly higher than those in the PBS-infected group. Only IL-4 increased in the BAL fluid of the KFA5-infected group than in that of the KA/E2-infected group. Although expression levels of IL-5, IL-13, IL-9, IL-17A, and IFN-γ were lower in the BAL fluid of the KFA5-infected group than of the KA/E2-infected group, these were higher than than those of the PBS-infected group (Fig. 6C). We surmise that the inflammatory response was induced by KFA21 and KFA5 as well as by KA/E2.

Cytokine levels after FLA infection. The cytokine concentration was measured using an enzyme-linked immunosorbent assay. The spleen and lung-draining lymph nodes were isolated from FLA infected mouse. The splenocytes (1×10⁶) and lung lymphocytes were stimulated with CD3 for 72 h. IL-4, IL-5, IL-13, IL-9, IL-17A, and IFN-γ levels in the spleen (A) and Lung-draining lymph nodes (B). Cytokine concentration was measured in the bronchial alveolar lavage fluids (C) (*P<0.05; **P<0.01; ***P<0.001; ****P<0.0001, n=5 mice/group, 3 independent experiments).
Immunoglobulin levels were increased during KFA21 and KFA5 infection
IgE and IgG2a concentrations in infection sera were highly increased in the KFA21- and KFA5-infected group compared to the KA/E2- and PBS-infected groups. However, there were no significant differences in the IgG1 concentration in the KA/E2- and KFA21- and KFA5-infected groups (Fig. 7).
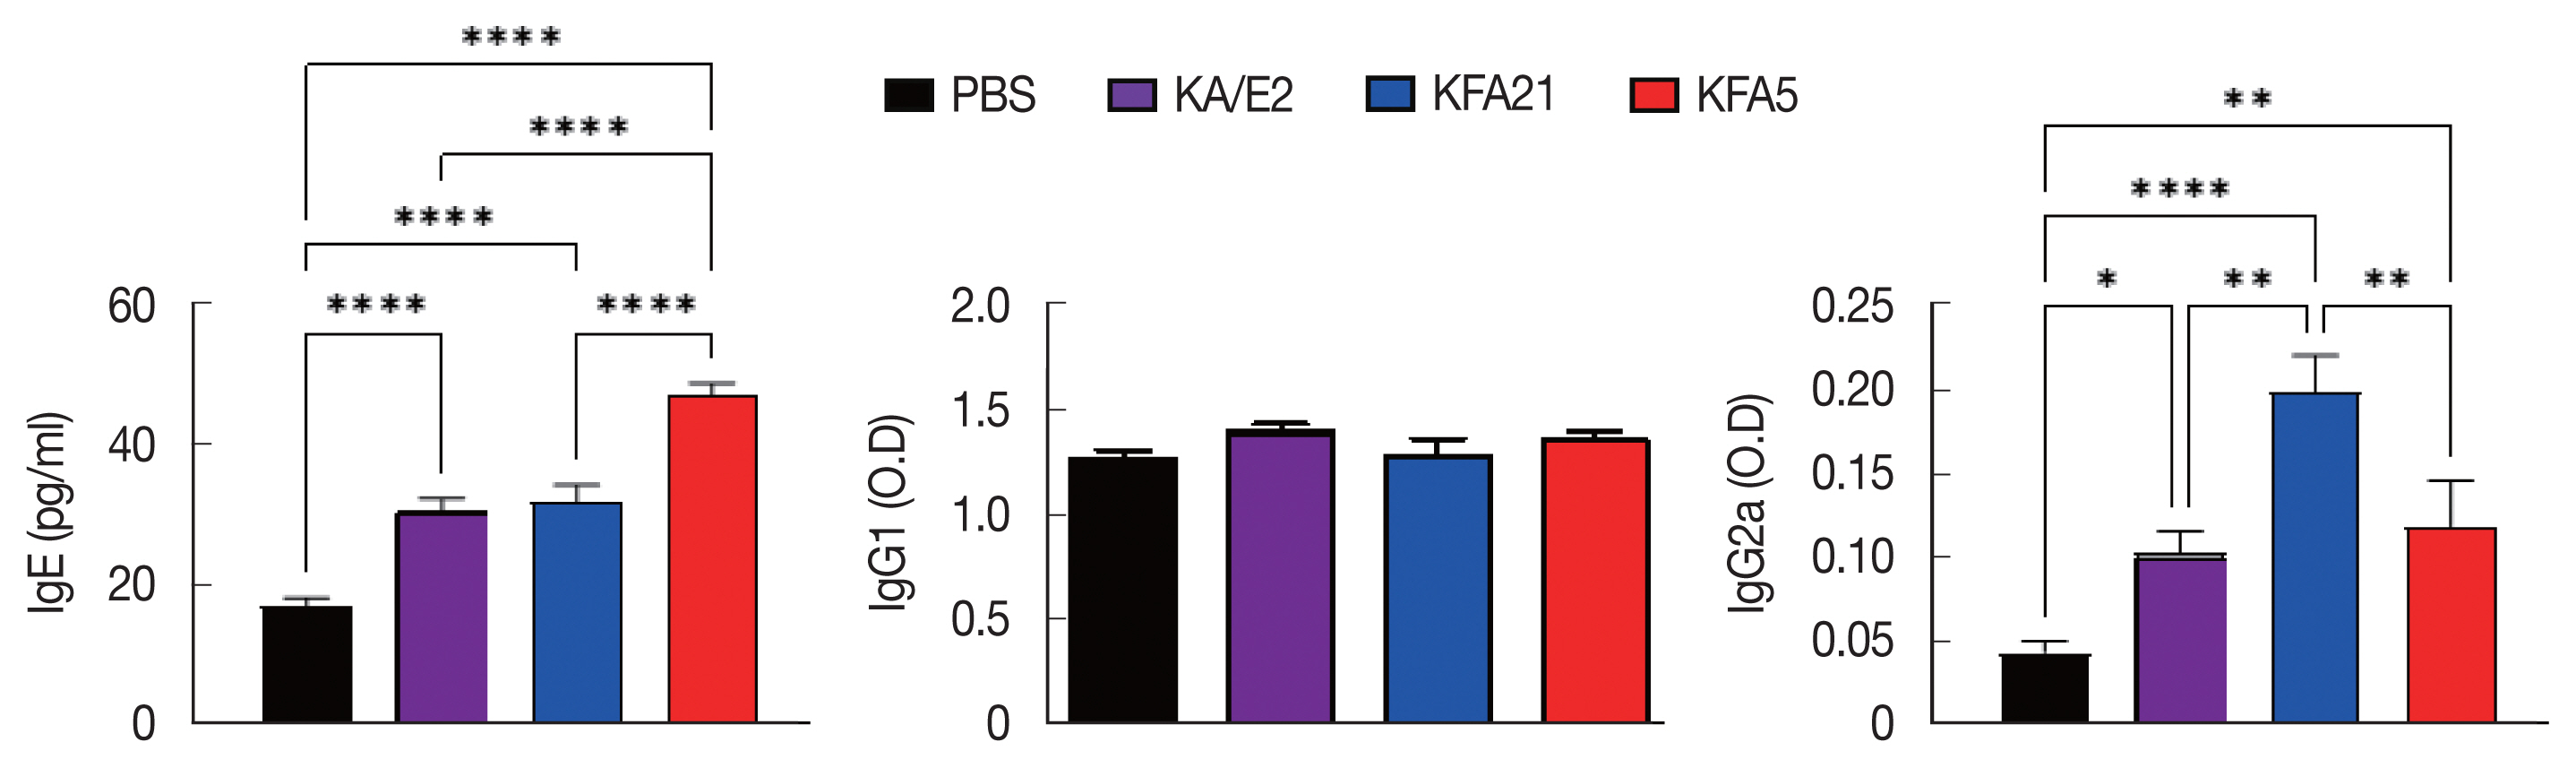
Immunoglobulin concentrations in FLA infection mouse sera. The levels of IgE, IgG1, and IgG2a were measured with ELISA (*P<0.05; **P<0.01; ****P<0.0001, n=5 mice/group, 3 independent experiments).
Th2-related gene expression was increased after sensitization with excretory-secretory products from KFA21 and KFA5
To investigate the biological effects of KFA21 and KFA5, excretory-secretory products were collected. We sensitized MLE12 cells (1×10⁶) with 10 μg of excretory-secretory products for 24 h. The Th2-related gene (IL-25, TSLP, and TARC) expression was measured using quantitative PCR. IL-25, thymic stromal lymphopoietin (TSLP), and thymus and activation-regulated chemokines (TARC) gene expressions were significantly increased after KA/E2, KFA21, and KFA5 excretory-secretory products treatment compared to those with PBS-treated cells (Fig. 8).
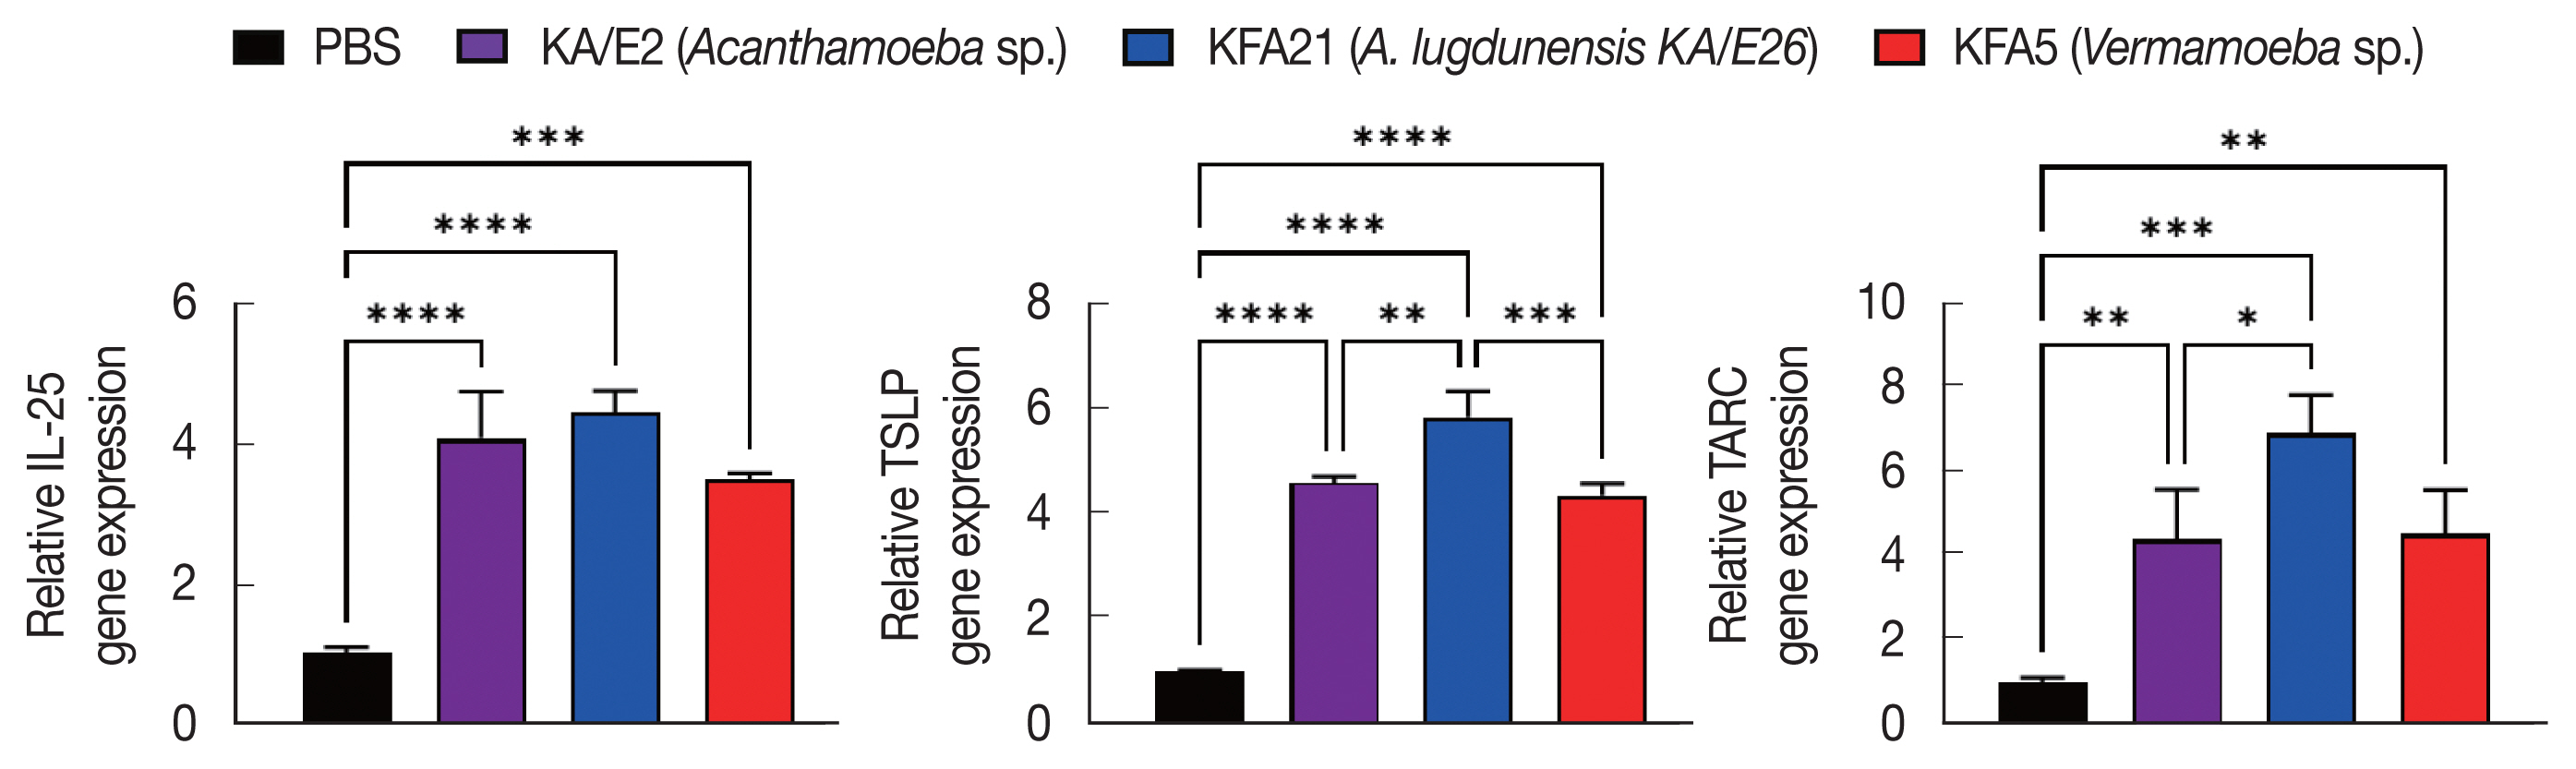
Expression levels of cytokine genes after treatment of FLA excretory-secretory products in mouse lung epithelial cells. FLA excretory-secretory products were treated to 1×10⁶ of MLE12 cell for 24 h. The IL-25, TSLP, and TARC gene expression levels were analyzed using quantitative real-time PCR (*P<0.05; **P<0.01; ***P<0.001; ****P<0.0001, n=3).
DISCUSSION
In this study, we found that both KFA5 and KFA21, to which humans are easily exposed, could induce allergic airway inflammation, such as asthma. We invoked allergic airway inflammation using 2 different FLAs, KFA5 and KFA21, isolated from the tap water. KFA5 and KFA21 caused allergic airway inflammation accompanied by severe immune responses. KFA21 and KFA5 infection induced eosinophil infiltration and goblet cell hyperplasia in experimental murine lungs (Fig. 2). Previous studies showed that BAL fluid obtained from asthma patients exhibit increased expression of TH2 cytokines, including IL-5, which are strongly related to eosinophilic inflammation [19,20]. Previous studies have also showed that Acanthamoeba induced eosionophilic allergic airway inflammation. The induction of allergic airway inflammation by protease allergens can activate dendritic cells (DC)s and induce IL-25, TSLP, and allergy-related chemokines [11,21]. Eosinophils are important cellular factors in the pathogenesis of allergic airways disease [22]. KFA21 and KFA5 also upregulated the gene expression of IL-4, IL-5, IL-13, IL-9, IFN-γ, and IL-17A. IL-25, TARC, and TSLP, which are caller mast regulators of allergic inflammation, are highly expressed in bronchial epithelial cells, smooth muscle cells, and lung fibroblasts (Fig. 4). Increased expression of IL-25, TARC, and TSLP induce the selective migration of Th2 cells [23] and IL-25-mediated Th2 responses in eosinophilia [21]. The excretory-secretory products of KFA21 and KFA5 induced high levels of IL-25, TARC, and TSLP gene expression (Fig. 8). Although little has been elucidated about these environmental FLAs, these isolates might contain one of the strongest human asthma inducer candidates, such as KA/E2 [11].
Asthma may be triggered by various factors, which included bacteria and viruses [12]. Asthma can be divided into 3 types. Type 1 asthma involves frequent sudden attacks that are more acute. Type 2 asthma is characterized by Type 2 inflammation. All types of asthma cause respiratory symptoms because asthma invoked airway narrowing and bronchial alveolar swelling [24]. In the course of type 2 asthma, the Th2 cell population increases, and these events stimulate eosinophil recruitment in lung tissue. Unlike other types, type 2 asthma is caused by irritant or allergens. The disease is severe and frequently progresses to worsening symptoms, hospitalization, and reduced lung compliance. It is often combined with inflammatory reactions, such as dermatitis, chronic sinusitis, gastrointestinal reflux disease, and lung-related allergic reactions [25]. Type 2 asthma stimulates the production of cytokines, such as IL-4, IL-5, and IL-13, which cause type 2 inflammation. Our results demonstrated that type 2 asthma is an allergic airway inflammation as previously reported [25,26].
The environment in which we live contains various substances. We are easily exposed to FLAs while we are drinking water, washing, breathing, playing, and etc [27]. These FLAs cause such diseases as encephalitis and keratitis [28]. FLAs live in dust, seawater, atmosphere, soil, contact lens, and lens retention solution. With the increase of contact lens wearers, the prevalence of amoebic keratitis also increase [29]. Amoebic keratitis are hard to treat, but can cause visual impairment [30]. Recently studies indicated that Acanthamoeba, an FLA, can cause allergic airway inflammation [11,31]. Acanthamoeba were identified from patient nasal cavities, pharyngeal swabs, lung tissues, and skin [8,32], which suggests that we can encounter FLAs easily in our daily life. Unfortunately, there are no restriction about FLA contamination. Unlike Acanthamoeba, there are few reports regarding pathogenicity of Vermamoeba. Recent study has reported that Vermamoeba (Hartmannella) vermiformis as the etiological agent of an infection close to the eye of a female patient [5]. Some investigators checked localization of FLAs in our environments because they thought that FLA is a potential pathogen or vector of bacterial pathogens [33–36]. FLAs were detected with potential human pathogenic bacteria in stored water in rural households in South Africa [34]. Several bacteria are ingested by FLAs and digested as a food source, whereas others have adapted to survive and grow within the amoebae by resisting against FLA, which are known as amoeba-resistant bacteria [2]. These potential harmful bacteria are protected from adverse conditions until they excyst the amoebas [2,4].
The studies about changes of pathogenicity of the pathogen after a long period in vitro culture of the pathogen were very few, especially in cases of FLAs, including Acanthamoeba. In this study, we compared the pathogenicity of KFA21 and KA/E2 because KFA21 and KA/E2 have highly homologous 18S rDNA sequences (99.9% identical). However, some data were significantly different between 2 isolates, although entire pathogenicity might be similar to each other. This fact indicated that most pathogenic factors (some allergenic factors) of Acanthamoeba seems are very necessary for their survival.
In conclusion, the FLAs that inhabit the environment, KFA5 and KFA21, might be pathogenic and cause allergic airway inflammation characterized by high release of Th2-related responses. Living with FLAs in a polluted environment may cause such diseasees as asthma, dermatitis, and keratitis. We need to be aware of FLA exposure and control FLA contamination.
ACKNOWLEDGMENT
This work was supported by a 2-Year Research Grant of Pusan National University.
Notes
The authors declare that they have no conflict of interest.