Spatiotemporal Clusters and Trends of Pneumocystis Pneumonia in Korea
Article information

Abstract
This study determined the recent status and trend of Pneumocystis jirovecii pneumonia (PcP) in the non-human immunodeficiency virus (HIV) (non-HIV-PcP) and HIV (HIV-PcP) infected populations using data from the Health Insurance Review & Assessment Service (HIRA) and the Korea Disease Control and Prevention Agency (KDCA). SaTScan and Joinpoint were used for statistical analyses. Non-HIV-PcP cases showed an upward trend during the study period from 2010 to 2021, with the largest number in 2021 (551 cases). The upward trend was similar until 2020 after adjusting for the population. Seoul had the highest number of cases (1,597) in the non-HIV-PcP group, which was the same after adjusting for the population (162 cases/1,000,000). It was followed by Jeju-do (89 cases/1,000,000). The most likely cluster (MLC) for the non-HIV-PCP group was Seoul (Relative Risk (RR)=4.59, Log Likelihood Ratio (LLR)=825.531), followed by Jeju-do (RR=1.59, LLR=5.431). An upward trend was observed among the non-HIV-PcP group in the Jeju-do/Jeollanam-do/Jeollabuk-do/Gyeongsangnam-do/Busan/Daejeon/Daegu/Ulsan joint cluster (29.02%, LLR=11.638, P<0.001) located in the southern part of Korea. Both women and men in the non-HIV groups showed an overall upward trend of PcP during the study period. Men in the 60–69 age group had the highest annual percentage change (APC 41.8) during 2014–2019. In contrast, the HIV groups showed a falling trend of PcP recently. Men in the 60–69 age group had the most decrease (APC −17.6) during 2018–2021. This study provides an analytic basis for health measures and a nationwide epidemiological surveillance system for the management of PcP.
INTRODUCTION
Pneumocystis jirovecii (formerly P. carinii) pneumonia (PcP) is an opportunistic respiratory infection in immunocompromised hosts, particularly those infected with the human immunodeficiency virus (HIV) and showing low CD4 T cell counts. Its incidence has decreased over the decades due to the use of highly efficient antiretroviral therapy and PcP prophylaxis [1,2]. However, it shows an upward trend in the general population with non-HIV immunocompromised status such as malignancy, organ transplants, and long-term use of immunosuppressants, and is a clinically significant disease [3]. The incidence of PcP in the general population is also increasing in Korea [4]. Hematologic malignancy was the highest underlying condition, and immunosuppressive therapies had highly significant association with PcP occurrence, but there are limitations to the study due to selection bias of hospital data. There are few studies on regional variance and temporal trends of PcP both in the general and HIV-infected populations for the entire region of Korea.
It is important to understand the regional and temporal trends of PcP incidence and prevalence to identify and provide evidence of epidemiological features of Korean patients with or without HIV infection, and to help customize medical guidelines and treatment strategies for the patients. This study determined the current disease status and most recent long-term trend (2010–2021) of PcP in the non-HIV and HIV groups to better understand its epidemiologic trends in Korea.
MATERIALS AND METHODS
Ethics statement
This study was performed under the regulation of the IRB Committee of The Catholic University of Korea (No. MIRB-20201127-002). This research adhered to the tenets of the Declaration of Helsinki.
Data source and definition
The nationwide PcP cases for 12 years (2010–2021) from 16 administrative districts in Korea were obtained from the Health Insurance Review & Assessment Service (HIRA) of Korea (https://opendata.hira.or.kr/home.do [cited 2022 July]) under the keyword “pneumocystis pneumonia”. The query returned “HIV disease resulting in Pneumocystis jirovecii pneumonia” (ICD-10 Version:2019, B206). Further query returned “pneumonia in parasitic diseases” (B59) and “pneumonia in P. jirovecii” (B485). The B206 cases were assigned to the PcP in HIV (HIV-PcP) group, and the B59 and B485 cases were assigned to the non-HIV PcP (non-HIV-PcP) group. The HIRA collects and connects all relevant data including heath information of all the patients across the country, and the accuracy and reliability of its data have been systemically validated [5].
The population data of the 16 administrative districts from 2010 to 2021 were obtained from the Korean Statistical Information Service (https://kosis.kr/index/index.do [cited 2022 May]). The geographical locations of the cases were set to the latitude and longitude of administrative center as the search point since the case data were made up according to administrative district unit. Average population of the districts were calculated for the full period to evaluate overall disease status. Non-HIV-PcP case numbers were adjusted for the district’s population (cases/1,000,000) in the corresponding year to enable comparison between the different districts (Table 1). Non-HIV-PcP case numbers were also adjusted for age and sex (cases/1,000,000) in the corresponding year (Table 2).
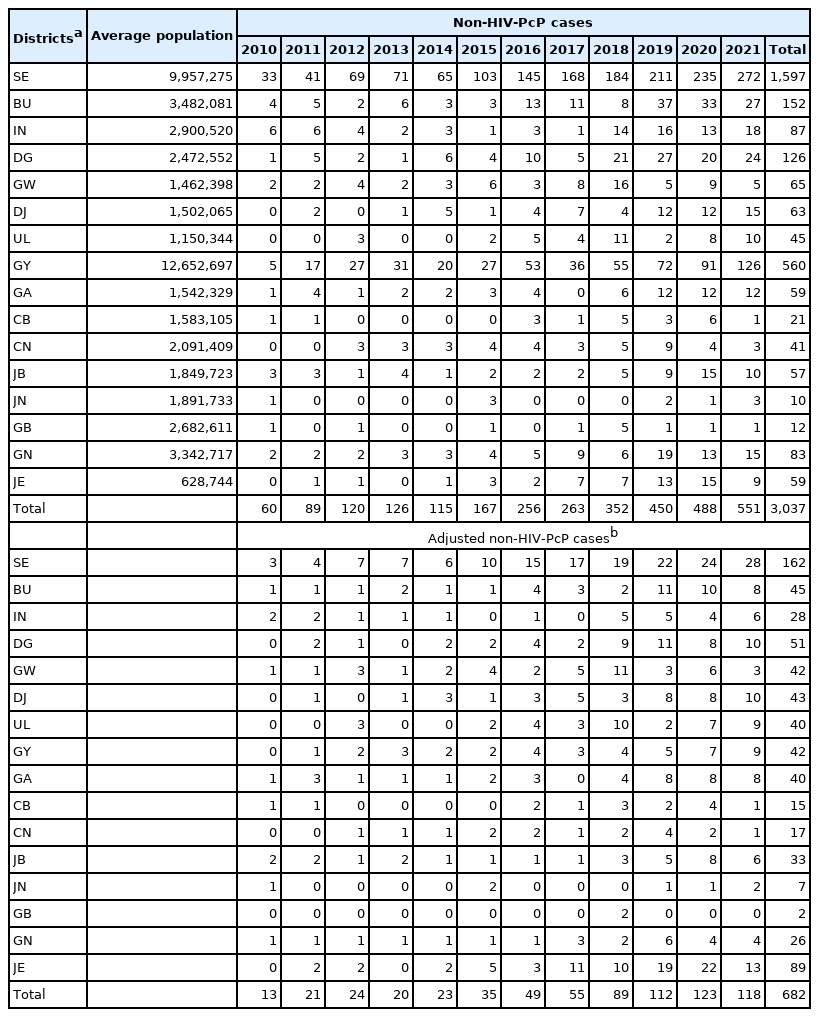
Total number of PcP cases in non-HIV group for 2010–2021 according to districts

Total number of PcP cases in non-HIV group for 2010–2021 according to sex and age
Although the HIRA data is nationwide, it is based on claims by healthcare services, therefore it might not be suitable for evaluating the disease status in chronic diseases as multiple reimbursements can be claimed. HIV itself has mainly become a controllable chronic disease, therefore, a new database for an HIV population was required for evaluating the PcP in HIV cases. Annual HIV infectious status for 2010 to 2021 were extracted from the “Annual Report on the Notified HIV/AIDS in Korea”, which was obtained from the Infectious Disease Portal of the Korea Disease Control and Prevention Agency (KDCA: https://www.kdca.go.kr/npt/biz/npp/portal/nppPblctDtaMain.do [cited 2022 July]). HIV-PcP case numbers were adjusted for the HIV population (cases/1,000) in the corresponding year to enable comparison between the different age and sex groups (Table 3).

Total number of PcP cases in HIV group for 2010–2021 according to sex and age
Spatiotemporal analyses of clusters and trend
SaTScan (v10.0) [6] was used to identify clusters and evaluate their significance through simulation. This was only possible for the non-HIV group, as the HIV annual report had no data on location. The discrete Poisson model was used since the case data was associated with the background population at risk. Spatial scan statistic is known to work the best for detecting spatial clusters and can be effective for a small number of case studies, such as rare outbreaks and help to find appropriate setting for cluster size [7–9].
SaTScan creates a circular window on the map and scans the study area by varying the window size to detect clusters with highest likelihood ratio. The window size determines a percentage of the population at risk within its boundaries [10]. Various studies have been performed to address this issue, and SaTScan has been progressively updated to address these results and implemented them on the new versions [11,12]. In this study, a window size of 50% was used to enable detection of the significant clusters.
General trend of the disease according to administrative districts was determined through spatial variation in temporal trend analysis, by scanning for clusters with either increasing or decreasing rates. The Monte Carlo simulations with an inference of 9,999 was used to evaluate the statistical significance of the clusters [13]. A significance level of α<0.05 was used as a standard. QGIS software (v3.16) was used to visualize cluster patterns on a map. The clusters and trends are shown in order of log likelihood ratio (LLR).
Trend analysis
PcP trend for both non-HIV and HIV groups, according to sex and age, was determined using Joinpoint Regression Program from the National Cancer Institute website (v4.9.1.0) (https://surveillance.cancer.gov/joinpoint/) [14,15]. The present study used crude rates, computed by the Joinpoint software, which is expressed as the number of cases for a given population at risk. A maximum number of 2 joinpoint was used, making it possible to see whether the incidence is better explained by a single trend or by the existence of multiple trend segments during the study period. Briefly, joinpoint regression identifies the best-fitting breakpoints (years), in which there was a significant change in the incidence rate (crude rates) [16]. The results were summarized as annual percentage changes (APC) with the best model fit for each trend segment. Statistical significance was calculated with an inference of 9,999 and expressed as P-value. A significance level of α<0.05 was used as a standard. The results were also output in graphs by the software. The final selected model from statistically significant age groups according to sex was output into a single graph to view multiple models simultaneously. These graphs were then recreated for enhanced legibility using the output data.
RESULTS
General characteristics
The non-HIV-PcP cases showed an upward trend during the study period of 2010 to 2021, with the largest number of cases in 2021 (551 cases). Adjusted PcP infection rate followed a similar trend, increasing through 2020 and then decreasing to some extents thereafter. Seoul had the highest number of cases (1,597) of PcP, followed by Gyeonggi-do (560). The highest number of adjusted cases was also observed in Seoul after adjusting for the population (162 cases/1,000,000) (Table 1). Interestingly, Jeju-do had the second highest number of adjusted cases after adjusting for the population (89 cases/1,000,000).
In the non-HIV-PcP age groups, the 60–69 and 70–79 age groups in women showed the highest average cases of PcP (24.4 and 21.2/year, respectively). Similarly, 60–69 and 70–79 age groups in men showed the highest average cases (40.8 and 39.3/year, respectively). After adjusting for the population (cases/1,000,000), women and men in the 70–79 age group had the highest adjusted cases (11.0 and 25.5/year, respectively). Men tended to have a higher crude rate of PcP, but it continued to increase with some fluctuation in both men and women (Table 2).
In the HIV-PcP age groups, the 60–69 and 50–59 age groups in women showed the highest average cases of PcP (4.4 and 4.2/year, respectively). In contrast, the 40–49 and 30–39 age groups in men showed the highest average cases of PcP (78.6 and 67.5/year, respectively). After adjusting for the corresponding HIV case numbers (cases/1,000), women in the 60–69 and men in the 40–49 age groups had the highest average adjusted cases of PcP (32.1 and 29.8, respectively). Men also tended to have a higher crude rate of PcP in the HIV-PcP group, but it peaked around 2017–2018, and continued to decrease steadily in both men and women (Table 3).
Pure spatial analysis for clusters and spatial variation in temporal trends by districts
When regional cluster analysis was performed for the non-HIV-PcP group, the most likely cluster (MLC) for PcP was Seoul with a relative risk (RR) and log likelihood ratio (LLR) of 4.59 and 825.231, respectively. The Jeju-do cluster also had a high RR (1.59) and LLR (5.431) of non-HIV-PcP (Fig. 1; Table 4).
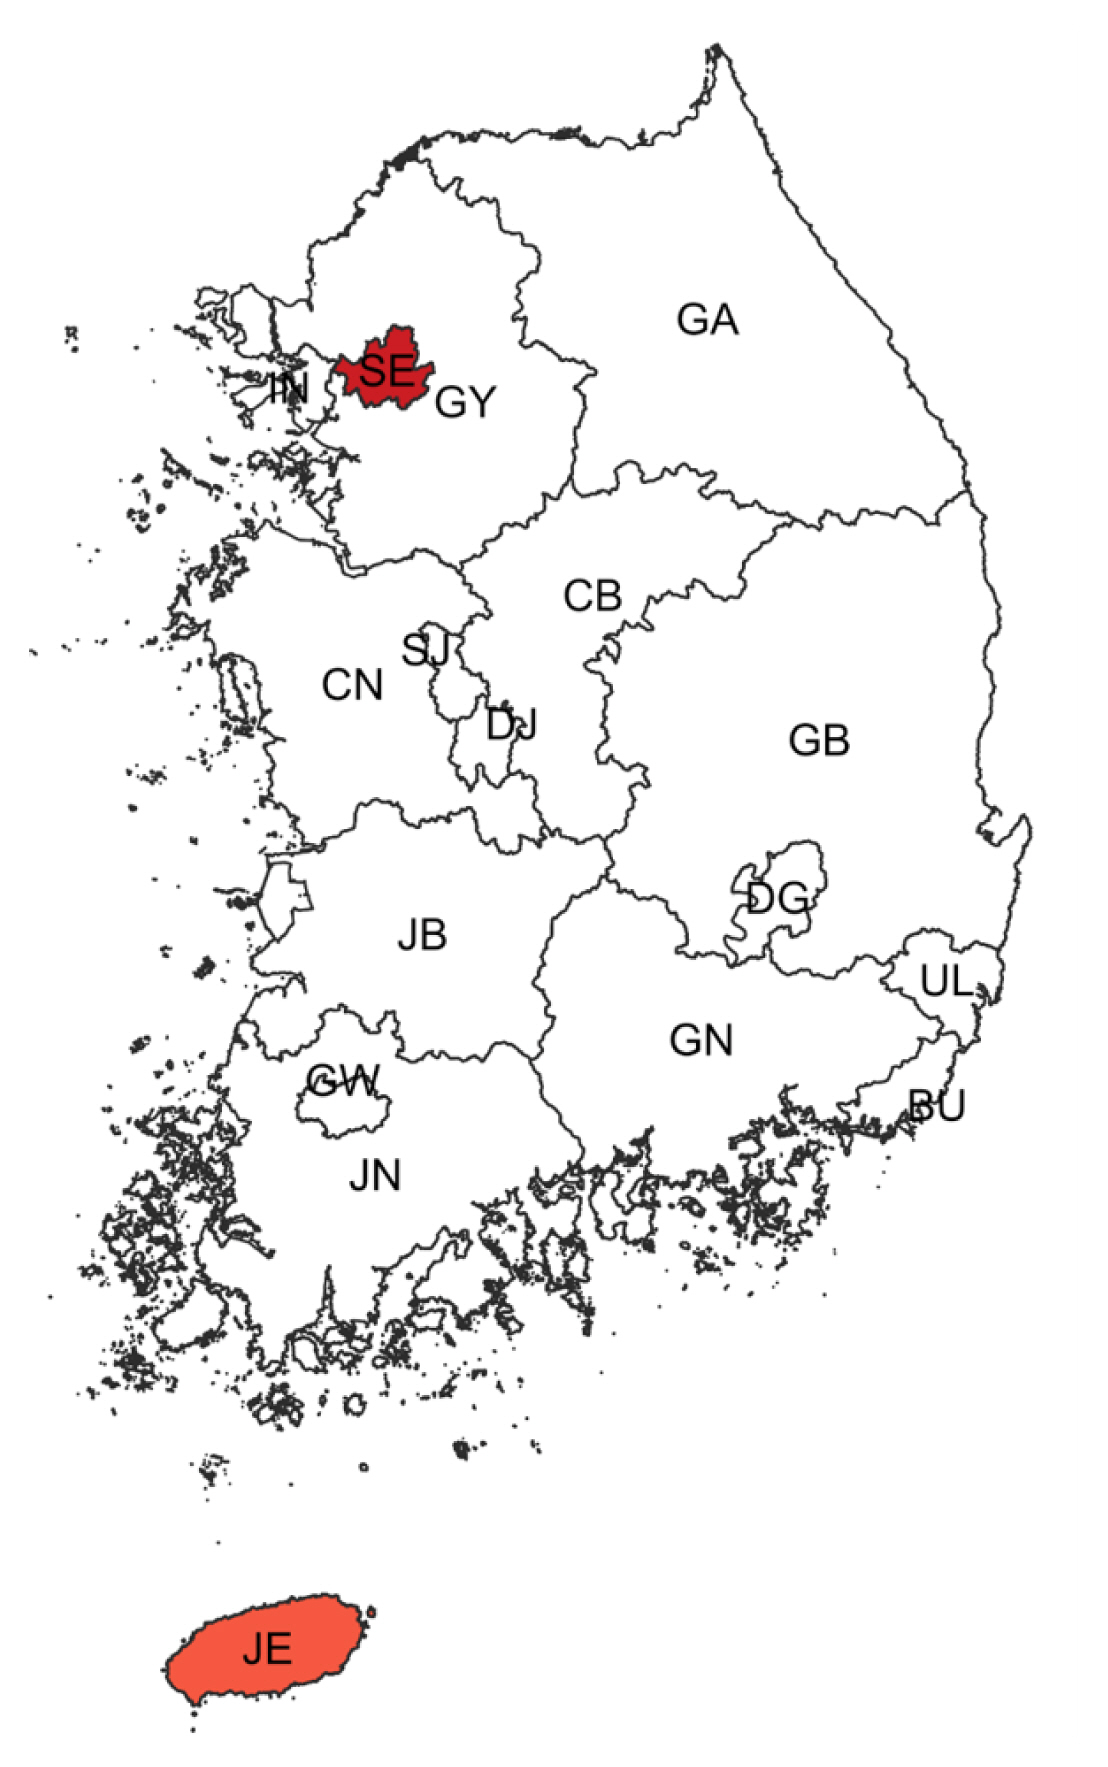
Regional clusters detected for non-HIV-PcP cases. Light to dark gradient represents increasing order of log likelihood ratio. Area codes represent administrative districts of the Korean government. SE, Seoul; BU, Busan; IN, Incheon; DG, Daegu; GW, Gwangju; DJ, Daejeon; UL, Ulsan; GY, Gyeonggi-do; GA, Gangwon-do; CB, Chungcheongbuk-do; CN, Chungcheongnam-do; JB, Jeollabuk-do; JN, Jeollanam-do; GB, Gyeongsangbuk-do; GN, Gyeongsangnam-do; JE, Jeju-do.
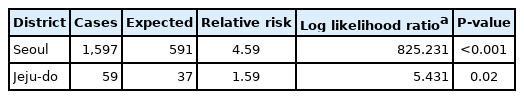
Regional clusters detected for PcP in the non-HIV group from 2010 to 2021
Spatiotemporal trends analysis showed an upward trend among the non-HIV-PcP group in the Jeju-do/Jeollanam-do/Jeollabuk-do/Gyeongsangnam-do/Busan/Daejeon/Daegu/Ulsan joint cluster (29.02%, LLR=11.638, P<0.001) that is mostly located in the southern part of Korea (Fig. 2; Table 5). Gangwon-do also showed an upward trend, but was not significant.
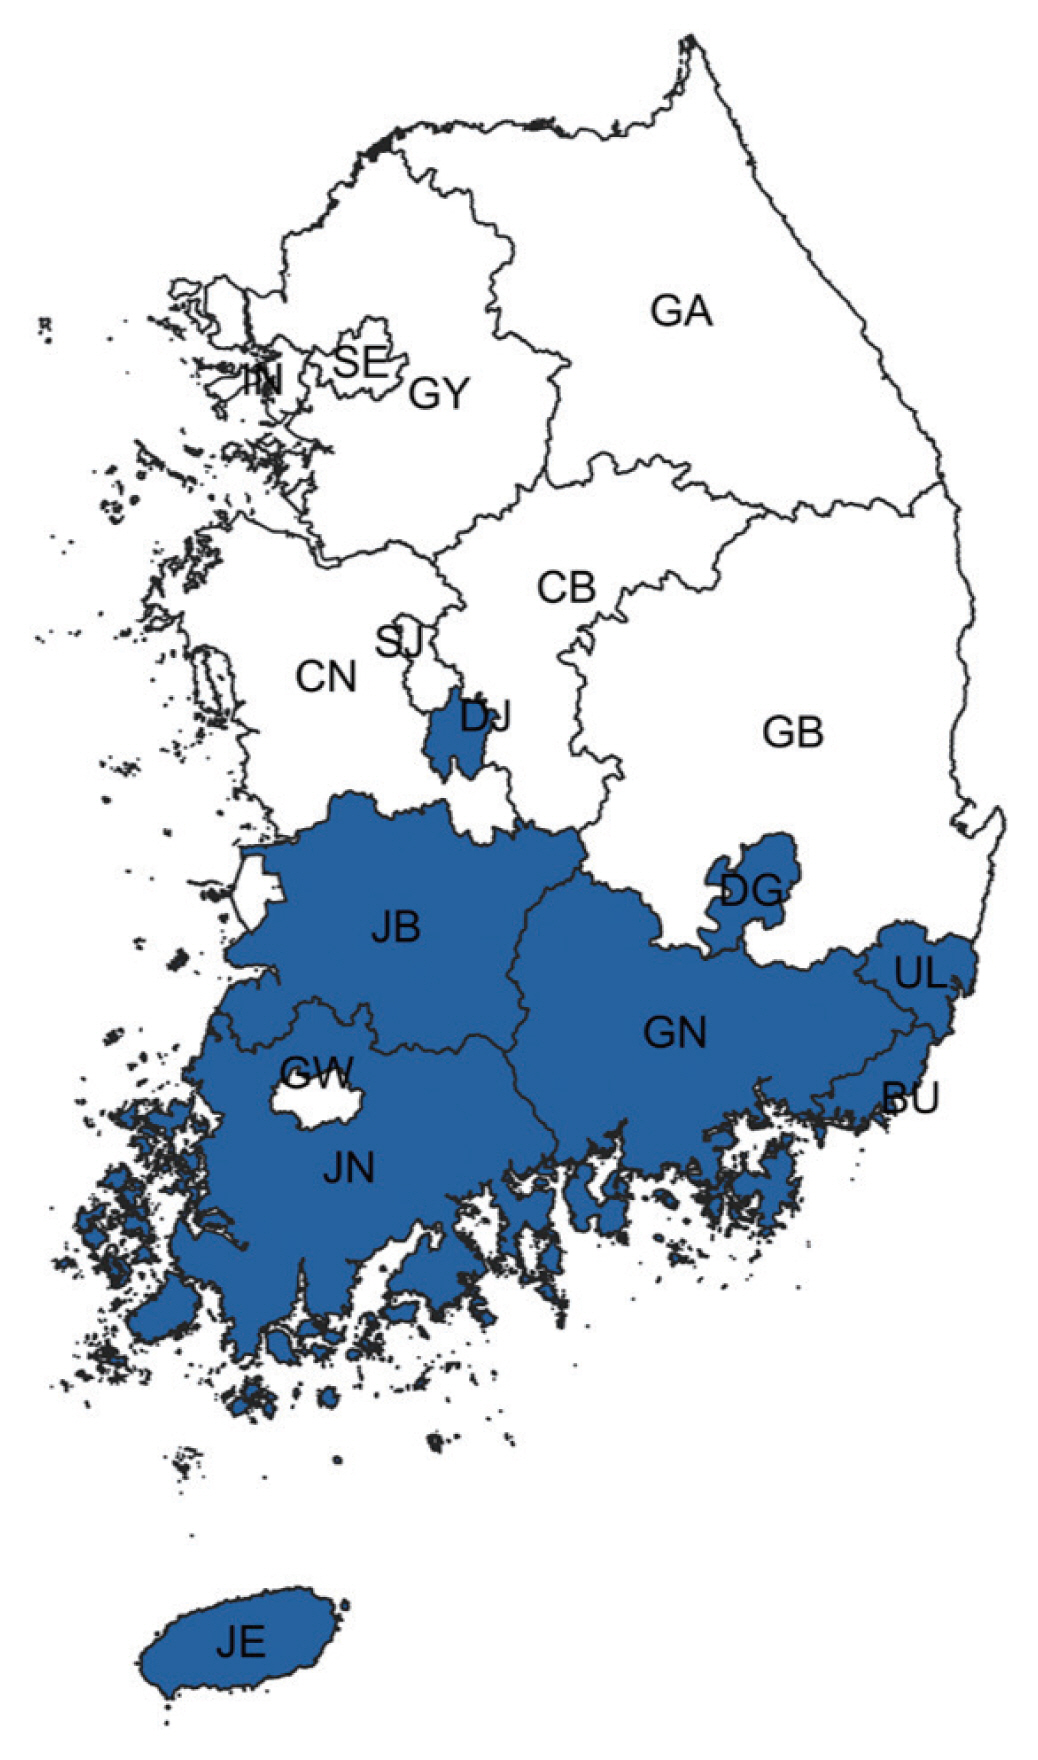
Spatiotemporal trend analysis of non-HIV-PcP cases for 2012–2020. Blue districts represent a joint cluster with an increasing trend of PcP. Area codes represent administrative districts of the Korean government. SE, Seoul; BU, Busan; IN, Incheon; DG, Daegu; GW, Gwangju; DJ, Daejeon; UL, Ulsan; GY, Gyeonggi-do; GA, Gangwon-do; CB, Chungcheongbuk-do; CN, Chungcheongnam-do; JB, Jeollabuk-do; JN, Jeollanam-do; GB, Gyeongsangbuk-do; GN, Gyeongsangnam-do; JE, Jeju-do.

Spatiotemporal Trends analysis of PcP in non-HIV group according to administrative districts (2010–2021)
Trends of PcP in age groups according to sex in both non-HIV and HIV groups
Change in crude rate of PcP in non-HIV and HIV groups according to sex and age are shown in Fig. 3. In the non-HIV-PcP group, women in the 40 and over age groups showed significant upward trends of PcP throughout the study period. In contrast, men showed different trends according to age. The 30–59, 70 years and over age groups in men showed significant upward trends during the entire study period (trend 1). The 20–29 age group showed an upward trend, but was not significant during 2010–2015 (trend 1) and 2015–2018 (trend 2), but fell afterwards (trend 3) with an annual percentage change (APC) of −46.8 (P=0.045). The 60–69 age group showed significant upward trend only during 2014–2019 (trend 2, APC 41.8, P<0.001) (Fig. 3; Table 6).
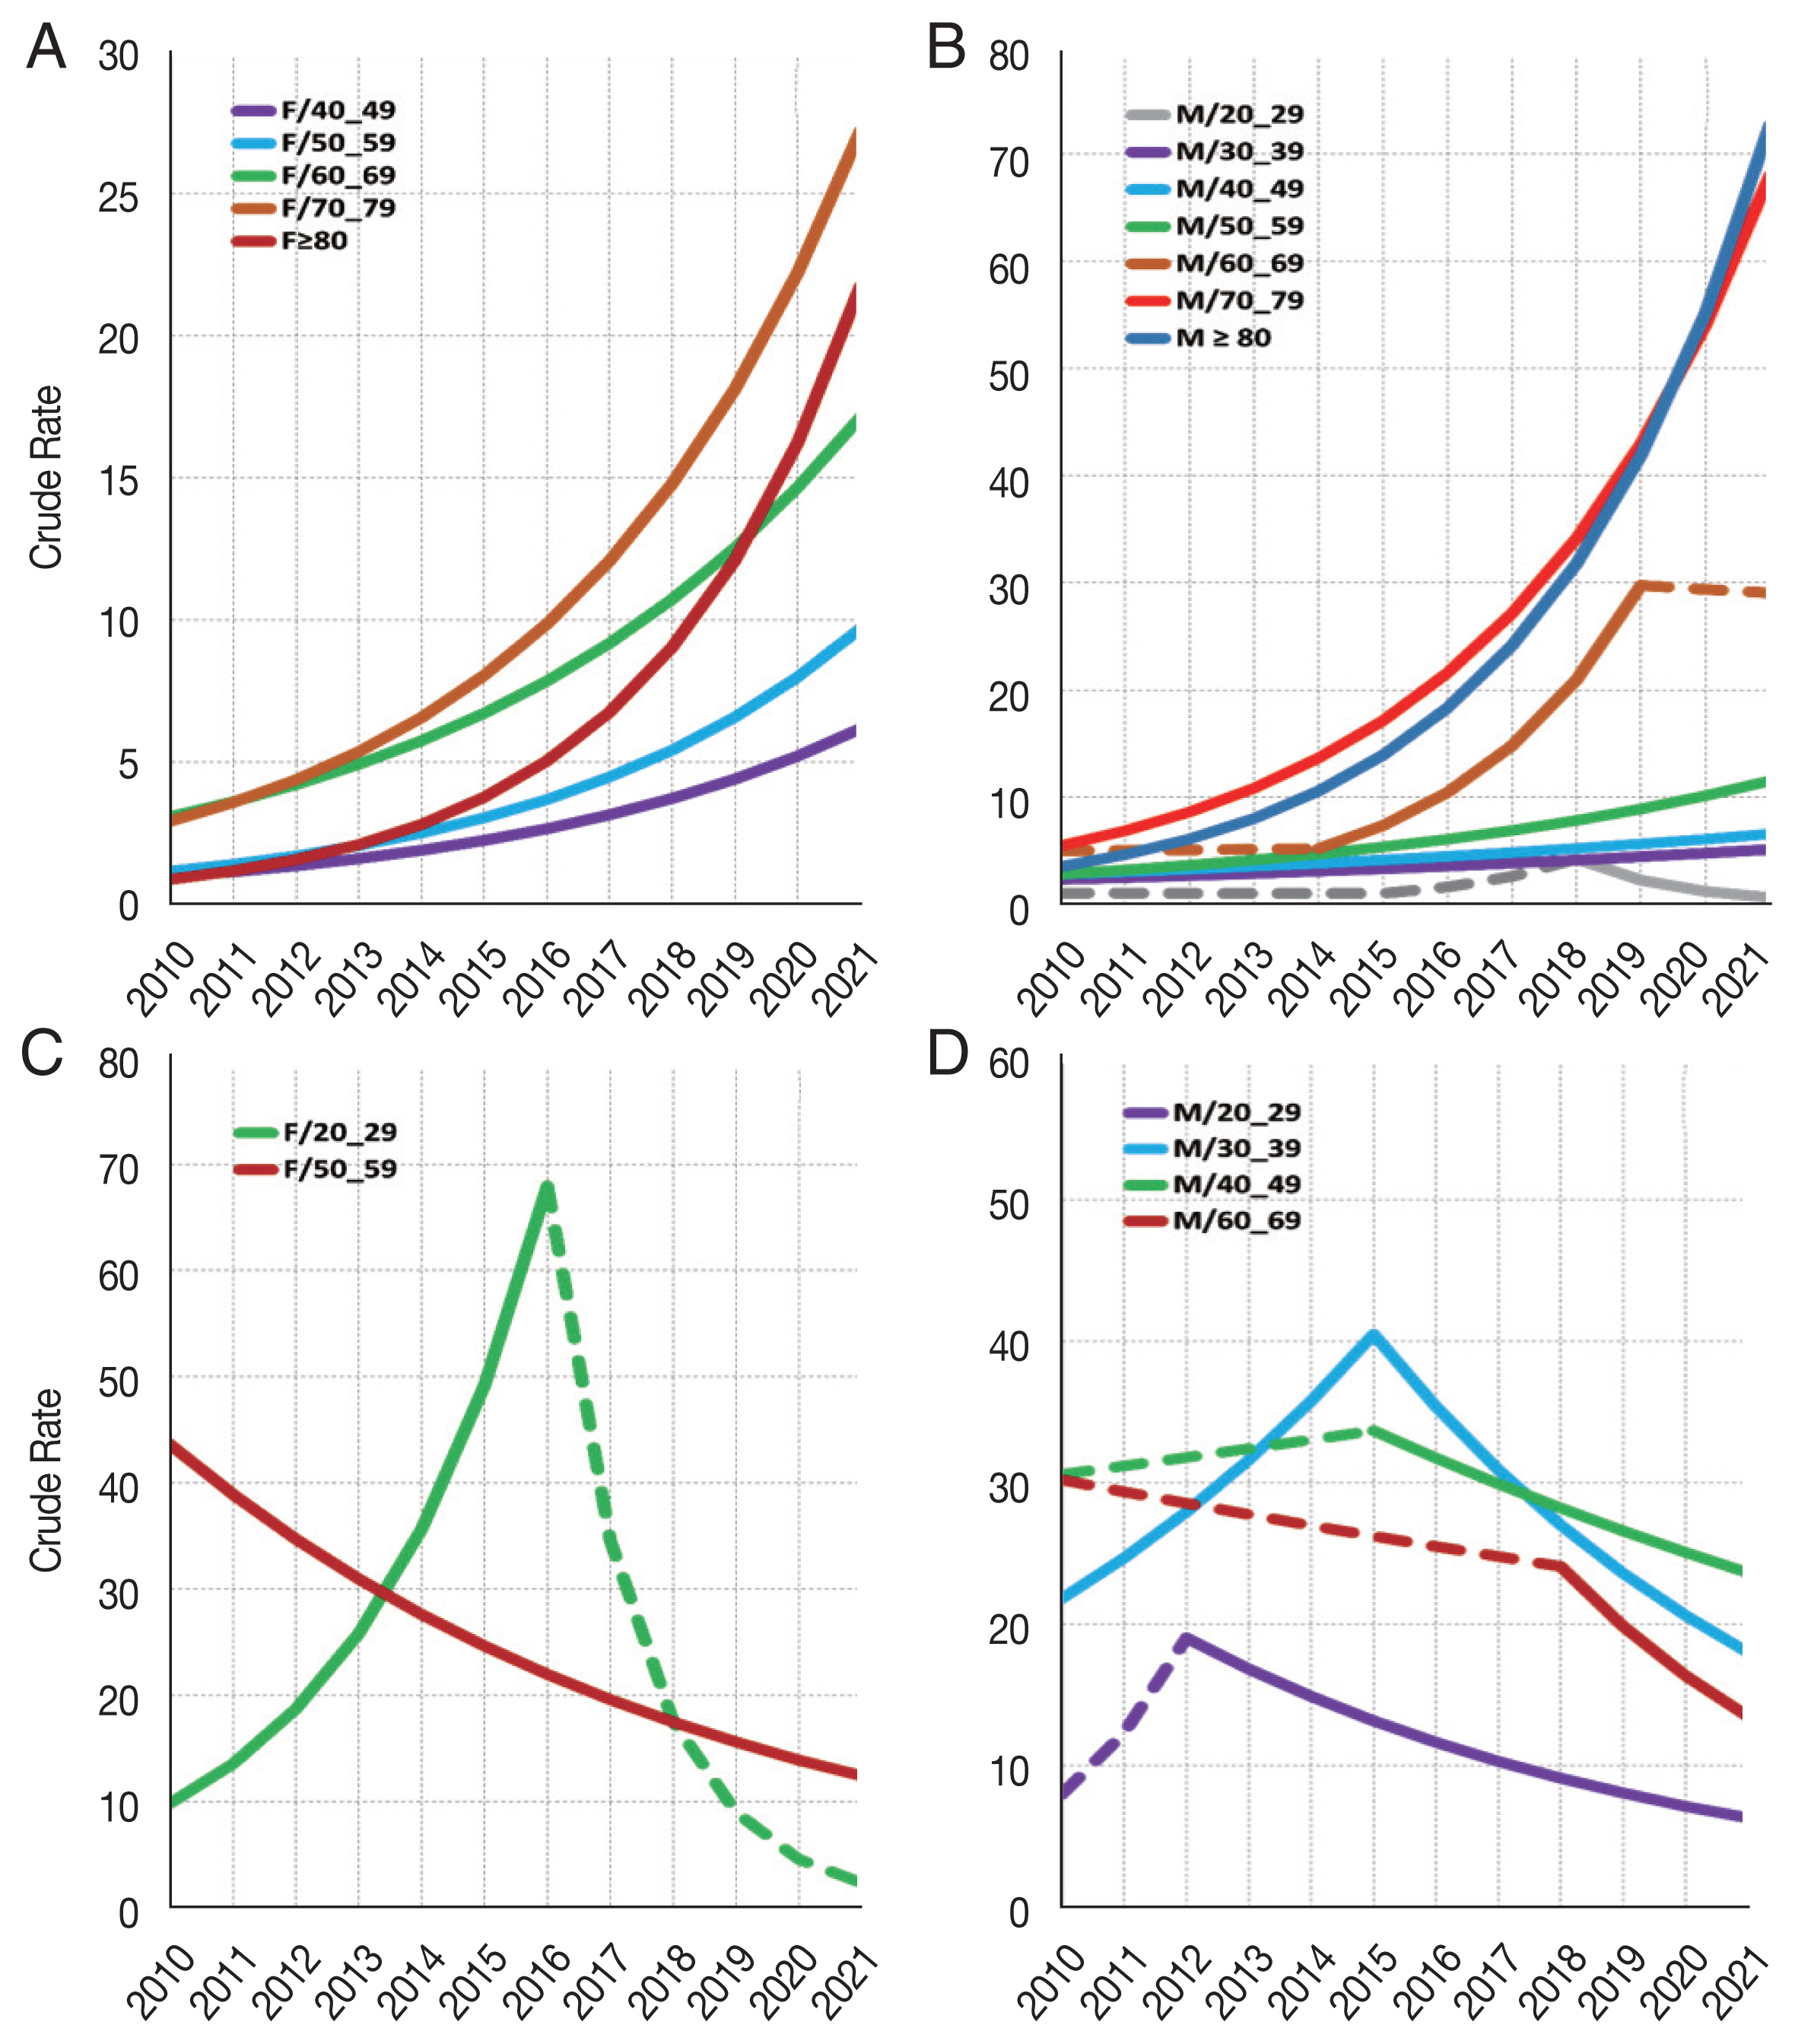
Trend analysis for PcP in non-HIV and HIV groups according to age and sex. (A) Non-HIV female 40 and over age groups show significant increase of PcP. (B) Non-HIV male 20–29 age group shows significant decrease during the third trend (2018–2021). The remaining age groups show significant increase of PcP during the study period. (C) HIV female 20–29 age group shows significant increase of PcP during the first trend (2010–2016). The 50–59 age group shows significant decrease of PcP. (D) HIV male 30–39 age group shows significant increase of PcP until peaking in 2015, and then decreases significantly. Age groups 20–29, 40–49 and 60–69 show significant decrease of PcP in the second trend (2012–2021, 2015–2021, and 2018–2021, respectively). Only age groups with significant trends are shown. Crude rates are calculated by mid-year in the Joinpoint software. Joinpoint graphs have been recreated for enhanced legibility using the output data. Dashed lines represent trends that are not significant.
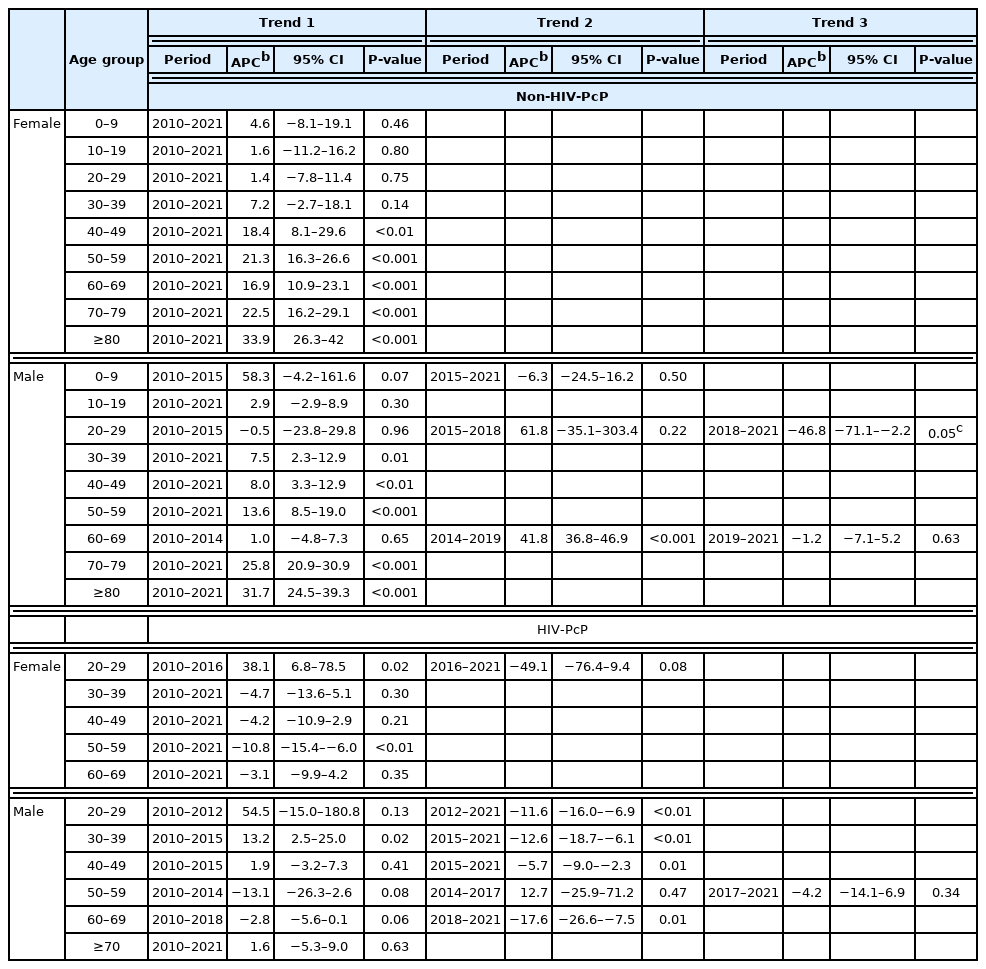
Falling trends of PcP were observed mainly in the relatively younger age groups living with HIV (HIV-PcP). This was in contrast to the non-HIV-PcP group, which showed overall upward trends of PcP in all age groups. The 20–29 age group in women showed significant upward trend of PcP until 2016, and then fell continuously to 2021, but it was not significant. On the other hand, the 50–59 age group in women showed significant decrease of PcP during the entire study period. Men in the HIV-PcP group showed varying trends for most age groups. The 20–29 age group showed a falling trend from 2012 to 2021 (trend 2, APC −11.6, P<0.01). The 30–39 age group showed a sharp increasing rate until 2015 (trend 1, APC 13.2, P=0.02), but fell afterwards significantly (trend 2, APC −12.6, P<0.01). The 40–49 age group showed a falling trend from 2015 to 2021 (trend 2, APC −5.7, P<0.01), while the 60–69 age group showed a more prominent fall during 2018–2021 (trend 2, APC −17.6, P<0.01) (Fig. 3; Table 6).
DISCUSSION
The purpose of the present study was to evaluate the latest PcP status, and whether there have been changes in temporal trends from 2010 to 2021 in Korea. Although there have been previous studies on the prevalence and incidence of PcP in Korea, this study is significant in that it provides statistically more recent data from the entire Korean population [17,18]. We separately assessed PcP cases in the non-HIV and the HIV groups, since PcP occurs more frequently in the immunocompromised individuals [3].
In the non-HIV group, Seoul, the capital city of Korea where almost a quarter of the Korean population live, had the highest number of PcP cases. Furthermore, Seoul was the major cluster for PcP during the study period. Medical resources are densely concentrated in Seoul facilitating the development of diagnostic and treatment measures for individuals with rare, or incurable disease such as solid organ or hematopoietic cell transplantation [19]. Advanced health care facilities and providers in the major city may have contributed to the increasing PcP diagnostic rate in the non-HIV group.
Pneumocystis is air-borne and transmitted from human to human [20,21]. It can colonize in the immunocompetent people, roam from individual to individual, and then may develop PcP when the host become immunocompromised, or if it encounters an immunocompromised human host [22]. Thus, an immunocompetent human host could serve as a reservoir of Pneumocystis, and its transmission is augmented when individuals are close enough to each other [23]. These transmission characteristics of Pneumocystis may explain the high number of cases of PcP in densely populated districts such as Seoul and Gyeonggi-do.
Gyeonggi-do, which is the second largest district of Korea, showed the second highest number of PcP cases, but we found that in the non-HIV-PcP group, Jeju-do has the second highest PcP rate after adjusting for the population; it was also the second largest cluster. PcP incidence tends to be relatively high in non-HIV immunocompromised patients who are using advanced medical resources in large cities. Environmental factors such as temperature, humidity, and the scale of green space may provide evidence supporting the association with an increased incidence of non-HIV-PcP. Jeju-do is an island at the southern part of Korea characterized by warm weather and high humidity. These factors may play a role in becoming the second likely cluster for PcP. Studies have shown that PcP cases are mainly found during outdoor activities such as hiking, camping, and gardening in affluent greenery where Pneumocystis has a high potential to spread airborne exposure to a human [24]. Peak incidence of PcP were correlated with climatic factors such as warm temperature and high humidity contributing to the high burden of Pneumocystis in air [25,26].
Non-HIV-PcP showed an increasing tendency in districts mainly located in the southern part of Korea, which is consistent with studies showing that PcP is mainly diagnosed more in regions with a warm weather [25,26]. Other than the climatic and regional factors associated with the southern districts of Korea, lack of awareness for PcP prophylaxis in non-HIV immunocompromised patients seems to contribute to an increase in the overall incidence and prevalence in the non-HIV-PcP group [27]. The guideline for prophylaxis against PcP in the HIV infected population is rather clear, which is based on the CD4 count, but the range for prophylaxis against PcP is broad and varied in non-HIV immunocompromised individuals, such as rheumatic diseases, inflammatory bowel diseases, malignancies, and solid organ transplant recipients [28–30]. The increase in organ transplantation appears to increase in the PcP incidence of non-HIV individuals. The number of transplantations of various human organs and tissues has been growing for several decades with the advances of medical resources such as transplant techniques and immunosuppressants [31]. Although Seoul has the highest number of transplantations, these advances appear to be nationwide including the southern districts of Korea.
PcP cases increased in the older age groups in both men and women among the non-HIV-PcP group during the study period, suggesting these age groups are at a high risk for PcP due to immunosenescence, which is described by a progressive deterioration of the immune system related to aging [32]. The reduced ability of the immune system in this population might provoke further diseases that aggravate the immunocompromised conditions, leading to higher mortality [32–34]. In addition to the issue of declined immune function in the elderly, whether chemoprophylaxis for PcP was performed on the immunocompromised individuals or not, appears to reflect the opposite temporal trends observed between the non-HIV-PcP and HIV-PcP groups [35–37]. Recent studies have shown that PcP incidence is globally decreasing due to the early use of effective antiviral agents to treat HIV, followed by careful monitoring and management for their health status including PcP prophylaxis [38,39]. Thus, the incidence of PcP is rising and the elderly are at high risk, so extending the range of prophylaxis against PcP should be required to lower the mortality due to PcP in the non-HIV group.
Although a downward trend was observed in the HIV-PCP group, men tended to have a higher incidence than women. This tendency might be due to the HIV infection status itself, and not to the sexual predilection of Pneumocystis. It is similar to the studies that have shown specific genotypes of Pneumocystis have strong correlation with the underlying diseases or conditions of the human host that caused the immunocompromised status [40]. Additionally, various genotypes of Pneumocystis based on the status of HIV infection itself and/or the underlying health conditions, including any combined complications, in people living with HIV have been reported, supporting genetic epidemics of Pneumocystis [41–43]. Although the genetic epidemics of Pneumocystis may not be representative of a link with PcP incidence, it may be helpful in predicting PcP occurrence in Korea.
We excluded the regional cluster and trend analysis for the HIV-PcP group in this study. The HIRA resource, which we analyzed, is a data claimed by clinics or hospitals that may be in regions different from that of the individual’s actual address, so there is a limit to reflecting the regionality, especially for people who live with HIV. They may not visit a local healthcare provider where they live, expecting treatment to be refused due to self-imposed discrimination stemming from social stigma, which may lead to behaviors such as remaining anonymous, using false identification, leaving home, and moving to other regions for treatment [44,45].
HIV infection in Korea has been declining since first reported back in 1985, and PcP has been studied as one of its opportunistic infections in the past [46–48]. However, it has been vigorously studied in non-HIV immunocompromised patients such as those with rheumatic diseases, auto-immune diseases, and transplantation recipients [49–52]. Our study revealed the status and trend of PcP in Korea. i) The PcP of the non-HIV population depends on regional environmental and climatic conditions as observed in Jeju-do and the southern parts of Korea, ii) the high risk of elderly, and iii) reinforcing studies based on data from tertiary-care hospitals showing similar trends in PcP over a decade in both the non-HIV and the HIV groups [17]. This study provides an analytic basis for health measures and a nationwide epidemiological surveillance system for the prevention of PcP.
Notes
The authors declare no conflict of interest related to this study.