Genetic Diversity and Clustering of the Rhoptry Associated Protein-1 of Plasmodium knowlesi from Peninsular Malaysia and Malaysian Borneo
Article information

Abstract
Human infection with simian malaria Plasmodium knowlesi is a cause for concern in Southeast Asian countries, especially in Malaysia. A previous study on Peninsular Malaysia P. knowlesi rhoptry associated protein-1 (PkRAP1) gene has discovered the existence of dimorphism. In this study, genetic analysis of PkRAP1 in a larger number of P. knowlesi samples from Malaysian Borneo was conducted. The PkRAP1 of these P. knowlesi isolates was PCR-amplified and sequenced. The newly obtained PkRAP1 gene sequences (n=34) were combined with those from the previous study (n=26) and analysed for polymorphism and natural selection. Sequence analysis revealed a higher genetic diversity of PkRAP1 compared to the previous study. Exon II of the gene had higher diversity (π=0.0172) than exon I (π=0.0128). The diversity of the total coding region (π=0.0167) was much higher than those of RAP1 orthologues such as PfRAP-1 (π=0.0041) and PvRAP1 (π=0.00088). Z-test results indicated that the gene was under purifying selection. Phylogenetic tree and haplotype network showed distinct clustering of Peninsular Malaysia and Malaysian Borneo PkRAP1 haplotypes. This geographical-based clustering of PkRAP1 haplotypes provides further evidence of the dimorphism of the gene and possible existence of 2 distinct P. knowlesi lineages in Malaysia.
INTRODUCTION
Malaria is an infectious disease affecting many parts of the world and causes high rates of morbidity and mortality. The infection is caused by the blood protozoa of the genus Plasmodium with 5 species responsible for human malaria: P. falciparum, P. vivax, P. malariae, P. ovale, and P. knowlesi. P. knowlesi, a simian malaria parasite of macaques, is the first significant species to cause zoonotic malaria in Southeast Asian countries [1,2]. This is attributed to the geographical distribution of the parasite’s natural reservoir and mosquito vector hosts [3].
Currently, P. knowlesi is the main cause of human malaria in Malaysia [4]. In 2019 and 2020, a total of 3,213 and 2,609 cases of knowlesi malaria were reported respectively. The 2 states of Malaysian Borneo (Sabah and Sarawak) have recorded significant incidence compared to those in other states in Peninsular Malaysia [5]. A previous analysis has suggested that the genetic difference of P. knowlesi may be the reason for the difference in case numbers and disease severity in these 2 regions [6,7]. This highlights the complexity of infection that may hinder efforts to develop control measures against infection. The dynamic of the antigen variants is important to serve as a guide for an efficient vaccine since studies have reported evidence of selective immunity toward specific parasite strains [8].
Plasmodium species, like many other apicomplexan parasites, have specialized organelles such as microneme, rhoptry and dense granule at the anterior end of the parasite invasive .form. These organelles sequentially secrete proteins in a synchronized manner to ensure the parasite invasion into host cells [9]. Following the initial release from microneme, rhoptry proteins are secreted to form the parasitophorous vacuole in the host cells [10]. The rhoptry associated protein (RAP) complex is linked to the membranous material discharged from the rhoptries during merozoite invasion [11]. The RAP1 protein, which forms part of the low molecular weight RAP complex with the RAP2 and RAP3, is important in the localization of the protein complex [13].
RAP1 has been widely studied for its immunological properties and potential as a candidate vaccine against P. falciparum and P. vivax infection [13]. Recombinant P.falciparum RAP1 (PfRAP1) protein has been demonstrated to prevent lethal P. falciparum infection in Samiri monkeys by effectively inhibiting early multiplication of the parasite [14]. In addition, monoclonal antibodies against RAP1 inhibited parasite growth in vitro, suggesting that protective immunity was induced by the protein [15].
A recent phylogenetic study of P. knowlesi RAP1 (PkRAP1) of Malaysia isolates highlighted separation of the protein into 2 distinct groups [16]. However, the number of isolates used in the previous study was too small to represent the genuine genetic diversity of the PkRAP1 in Malaysian P. knowlesi. In this study, the genetic diversity of additional isolates collected from Peninsular Malaysia and Malaysian Borneo was analyzed for deeper studies into the dimorphism and genetic variation between the 2 populations.
MATERIALS AND METHODS
Human blood sample collection and extraction of DNA
Seven and 27 blood samples were collected from Peninsular Malaysia and Malaysian Borneo hospitals, respectively. The samples were confirmed for P. knowlesi infection by microscopic examination and nested PCR based on the Plasmodium small subunit ribosomal RNA gene [17,18]. Genomic DNA was extracted from the blood samples using QIAGEN Blood DNA Extraction kit (QIAGEN, Hilden, Germany) following the manufacturer’s protocol. For each extraction, 100 μl blood were used. The extracted DNA sample (50 μl) was kept in −20°C prior to use.
PCR amplification of PkRAP1
The PCR amplification of PkRAP1 gene was performed by using oligonucleotide primers pair PkRAP1 MINF: 5′-ATGCCATCCCGCATGGAC-3′ and PkRAP1 MINR: 5′-CCACGTGCGCGCAAAAAG-3′ to target the full length PkRAP1 gene based on the P. knowlesi strain H (GenBank Accession No. AM 910995.1: 1782148–1784781). Extracted P. knowlesi DNA was used as the template and ddH2O as negative control. The PCR reaction used high fidelity DNA polymerase GoTaq Long PCR Mastermix (Promega, Madison, Wisconsin, USA) to increase the efficiency for long DNA amplification. The prepared PCR mixture was subjected to amplification according to the following cycling conditions: initial denaturation at 95°C for 3 min, followed by 35 cycles of denaturation at 94°C for 30 sec, annealing at 58°C for 30 sec and extension at 68°C for 3 min. Lastly, the reaction was terminated at final extension 72°C for 10 min. The expected band size of 2,634 bp was observed on 1% agarose gel electrophoresis.
Purification of PCR products and DNA cloning
PCR products were purified using the QIAquick PCR Purification Kit (QIAGEN) following the manufacturer’s protocol. The concentration and purity of purified products were measured using the NanoDrop 2000 (Thermo Fisher Scientific, Waltham, Massachusetts, USA). The purified PCR products were ligated into the cloning vector pGEM-T (Promega). The ligation mixture was incubated at 4°C overnight before being transformed into the Escherichia coli TOP10F’ competent cells. Colony PCR was performed to determine recombinant clones harbouring the PkRAP1 fragment. Positive recombinant clones were selected, and their plasmid was sent to a commercial laboratory (First BASE Laboratories Sdn. Bhd., Malaysia) for DNA sequencing. In addition to the universal sequencing primers (M13 Forward and M13 Reverse), the internal primers PkRAP1 INT_F2: 5′-GGAGCAGAGAGTTCGTAAG-3′ and PkRAP1 INT_R2: 5′-ACAGGGTCTTCTCCCATAAG-3′ were used for sequencing. This was for the sequencing of the central part of the PkRAP1, which could not be achieved using the universal sequencing primers.
Analysis of PkRAP1 sequences
The full length PkRAP1 gene sequence for each isolate was obtained from the consensus sequence of each DNA fragment. The generated sequence was trimmed at both ends to remove non-PkRAP1 (i.e., pGEM-T) sequence using the Bioedit sequence editor v7.2.0. The generated sequences from Peninsular Malaysia (n=7), Malaysian Borneo (n=27) together with PkRAP1 gene sequences from a previous study (n=26) [16], were then aligned with the reference H strain PkRAP1 sequence. Taken together, a total of 60 sequences were used in the analysis. The sequences were also translated into amino acid sequences and multiple-aligned using MEGA10 [19].
PkRAP1 sequence polymorphism analysis
The estimated average number of pairwise nucleotide differences within population (K), nucleotide diversity (π), and haplotype diversity (Hd) were determined using DnaSP v5.10.00 [20]. The step-wise π diversity across sequence was generated in a sliding window of 100 bases with a step size of 25 base pairs. The rate of synonymous (dS) and nonsynonymous (dN) substitutions was measured and Z-test evaluation for natural selection were performed using MEGA10 [19] by employing the Nei and Gojobori’s method with Jukes and Cantor correction [21]. The Tajima’s D statistic to test the departure from neutral theory of evolution [22], and the fixation index (FST) to measure the genetic differentiation between Peninsular Malaysia and Malaysian Borneo sequences were performed using DnaSP v5.10.00 [20].
Phylogenic analysis and haplotype network of the PkPAP1 gene
The Neighbour Joining method in MEGA10 [19] was employed to construct the phylogenetic tree. Bootstrap replicates of 1,000 were applied to assess the robustness of the tree. The P. coatneyi RAP1 sequence was used as an outgroup for the analysis. A haplotype network based on the PkRAP1 was generated using the median-joining method in NETWORK v4.6. 1.2 (Fluxus Technology Ltd, Suffolk, UK).
Ethics statement
The collection and use of human blood samples in this study was approved by the Medical Research Committee of the Malaysia Ministry of Health (Ref. No. NMRR-15-67223975).
RESULTS
Analysis of PkRAP1 sequences
The PkRAP1 genes were amplified from the 34 human blood samples and sequenced. The newly obtained sequences, together with sequences retrieved from GenBank (Supplementary Table S1), were aligned and trimmed to obtain full length PkRAP1 sequences of 2,412 bp. Analysis of the PkRAP1 sequences showed that the gene consisted of 2 exons and 1 intron. The 278 bp exon I and 1,927 bp exon II were separated by an intron of 205 bp. The total coding sequence (CDS) of PkRAP1 consisted of 2,205 nucleotides, which encoded 735 amino acid residues.
Analysis of genetic diversity and natural selection of PkRAP1 of Malaysian isolates
Table 1 presented DNA sequence polymorphism analysis of PkRAP1. The CDS average number of pairwise nucleotide differences (K) was 37.186. The nucleotide diversity was highest in exon II (π=0.01747), followed by the CDS (π=0.01686) and exon I (π=0.01264). The highest haplotype diversity (Hd) was observed in the CDS (Hd=0.999) followed by exon II (Hd=0.998) and exon I (Hd=0.929). The sliding window plot showed that the π across the CDS ranges approximately between 0.002 to 0.046 (Fig. 1). The highest π was observed between the nucleotide positions 600–800 while the lowest diversity was at the nucleotide positions 2,000–2,200.
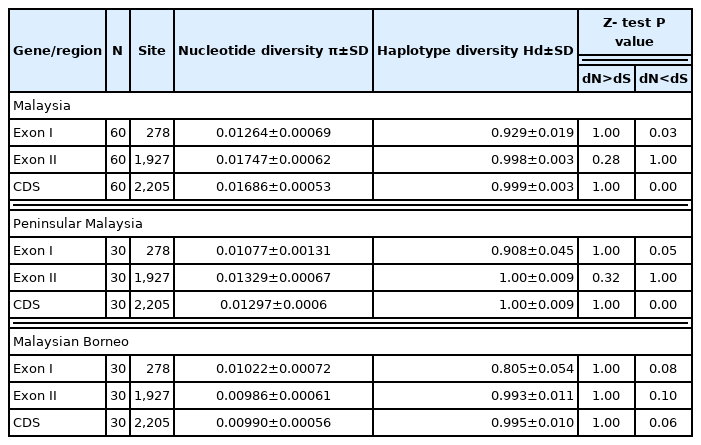
Estimates of genetic diversity and natural selection of the total coding region and exon I and exon II of PkRAP1 gene from Peninsular Malaysia and Malaysian Borneo isolates
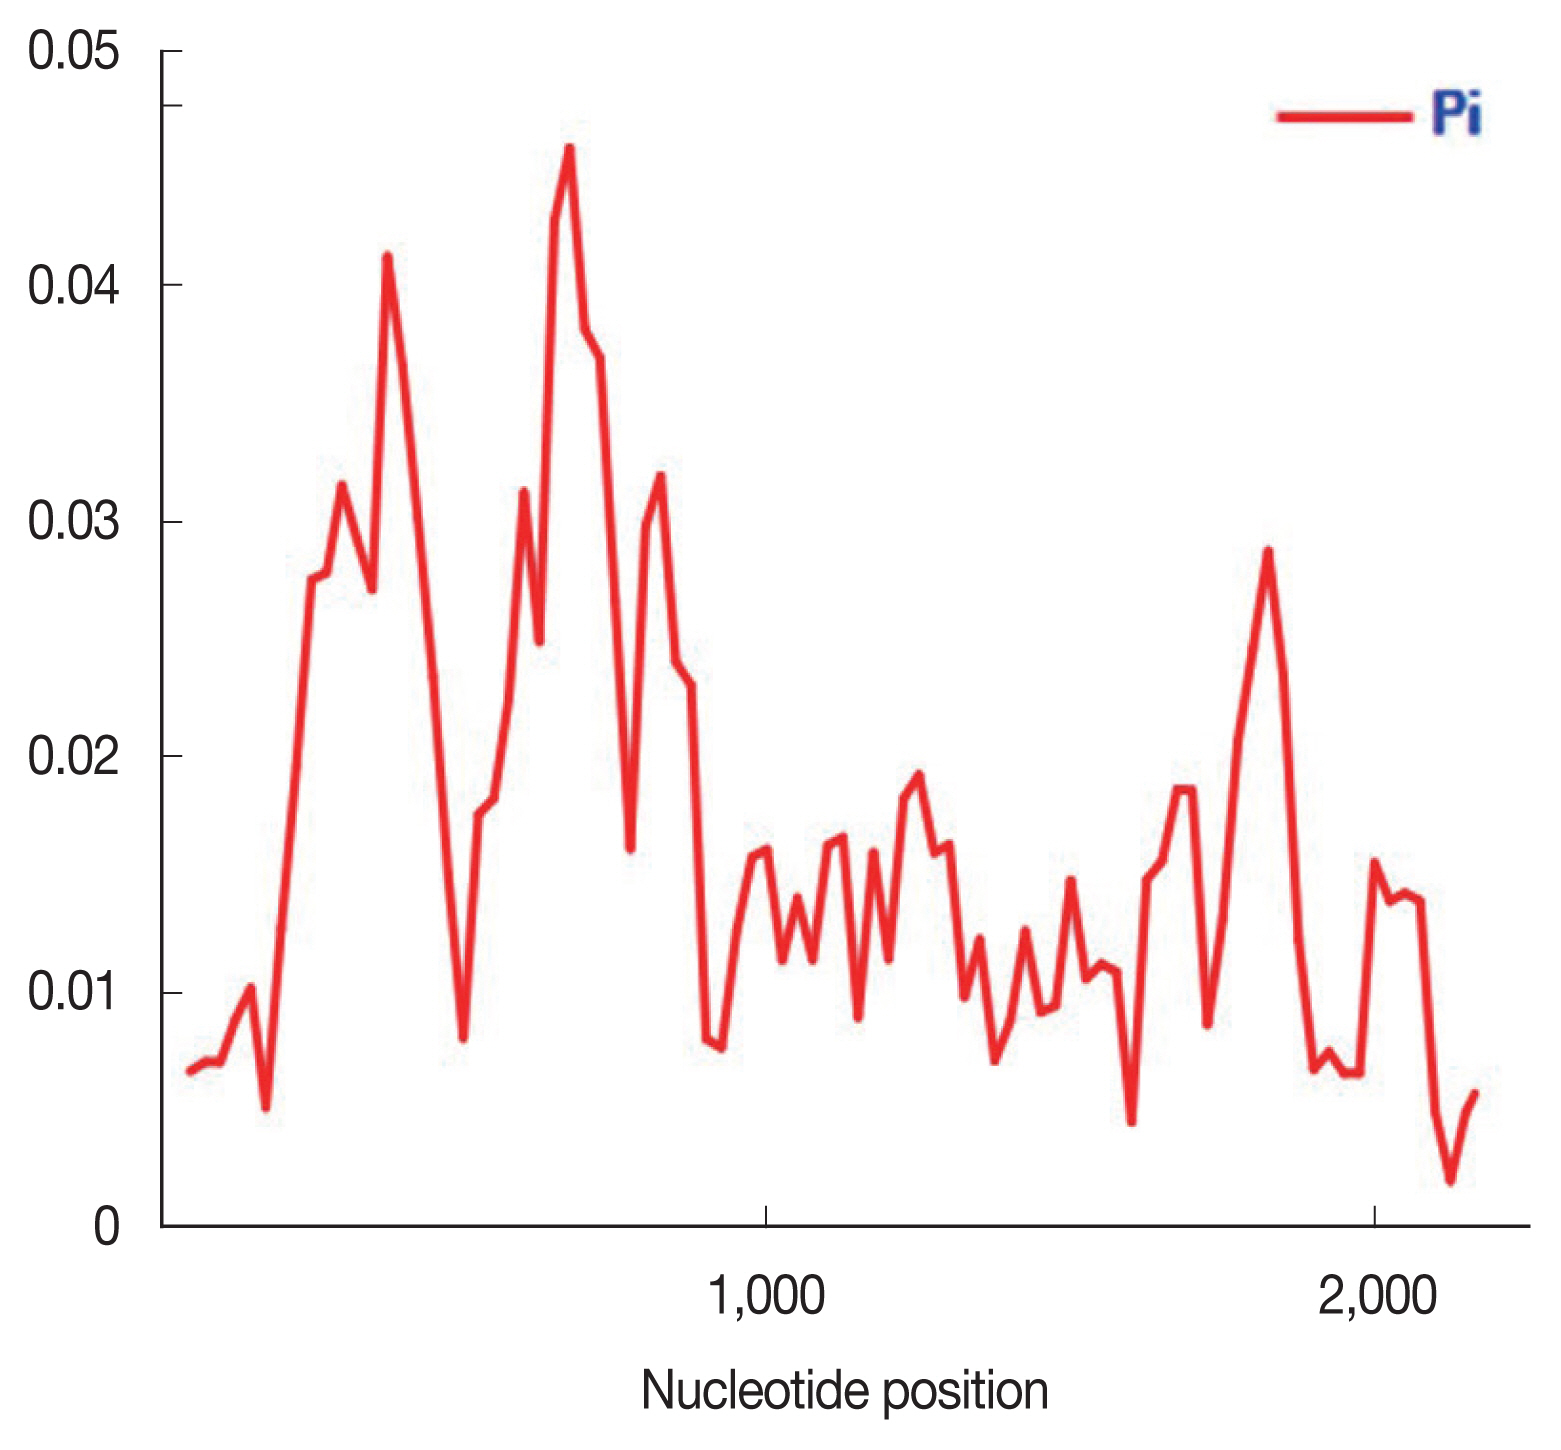
Nucleotide polymorphism in the PkRAP1 of Malaysian isolates (n=60). Sliding window plot of the nucleotide diversity π (pi) along the PkRAP1 was generated with a window length of 100 bp and step size of 25 bp.
A test for natural selection of the PkRAP1 sequence was conducted to determine the effect on the sequence diversity. The rate of synonymous (dS) and nonsynonymous (dN) substitutions of all the Malaysian isolates’ sequences (n=60) was calculated. The dN was found to be lower than dS in the exon I (dN=0.01, dS=0.03) and the CDS (dN=0.01, dS=0.03). Meanwhile, an equal value of dN and dS (0.02) was observed in exon II. The overall Z-test analysis on the Malaysian isolates’ sequences based on the dN<dS value showed that exon I (P=0.03) and the CDS (P=0.00) were under negative selection. Tajima’s D statistic revealed no significant departure from neutrality for exon I, exon II and CDS (−0.80081, −1.02467 and −1.13479, P>0.10).
Comparison of genetic diversity and natural selection of PkRAP1 from Peninsular Malaysia and Malaysian Borneo isolates
The sequence analysis at the subpopulation Peninsular Malaysia (n=30) and Malaysian Borneo (n=30) levels revealed that Peninsular Malaysia PkRAP1 have slightly higher diversity compared to that of Malaysian Borneo. For the Peninsular Malaysia sequences, exon I was revealed to have the lowest π (0.01077). In contrast, exon I of Malaysian Borneo sequences had the highest π (0.01022). The highest π in Peninsular Malaysian sequences was observed in exon II (0.01329) followed by CDS (0.01297). Meanwhile, exon II of Malaysian Borneo had the lowest π (0.00986), followed by the CDS (π= 0.00990). Both Peninsular Malaysia and Malaysian Borneo sequences showed the lowest Hd in exon I with the values of 0.908 and 0.805, respectively. In the Peninsular Malaysia sequences, high Hd was observed in both exons II and CDS with the value of 1.00. On the other hand, the Hd of CDS in Malaysian Borneo was slightly higher than the exon II (Hd=0.995 and 0.993 respectively).
The test on natural selection of Peninsular Malaysia and Malaysian Borneo sequences showed relatively similar results. The overall Z-test indicated that Peninsular Malaysia and Malaysian Borneo exon I (dN<dS, P=0.05 and P=0.08 respectively), CDS (dN<dS, P=0.00 and P=0.06 respectively) and Peninsular Malaysia exon II (dN<dS, P=0.10) were possibly shifting towards negative selection. Tajima’s D statistic did not show any significant departure from neutrality in the Peninsular Malaysia and Malaysian Borneo exon I (−0.87733 and −0.20215, P>0.10), exon II (−0.67215 and −1.20998, P>0.10) and CDS (−0.71063 and −1.11684, P>0.10).
Amino acid sequence polymorphism in PkRAP1
Multiple alignments of PkRAP1 amino acid sequences of Malaysian isolates revealed that 118 polymorphic sites were identified (Fig. 2). Among these, 62 were the singleton and 56 were parsimony-informative sites. There were 97 single amino acid substitutions, 20 double substitutions, and 1 quadruple substitution [at position 228 (K » D, Q, N, H)]. Overall, 51 haplotypes were deduced from the amino acid sequence analysis. Of these haplotypes, samples from Peninsular Malaysia showed 25 haplotypes while Malaysian Borneo samples had 26 haplotypes.
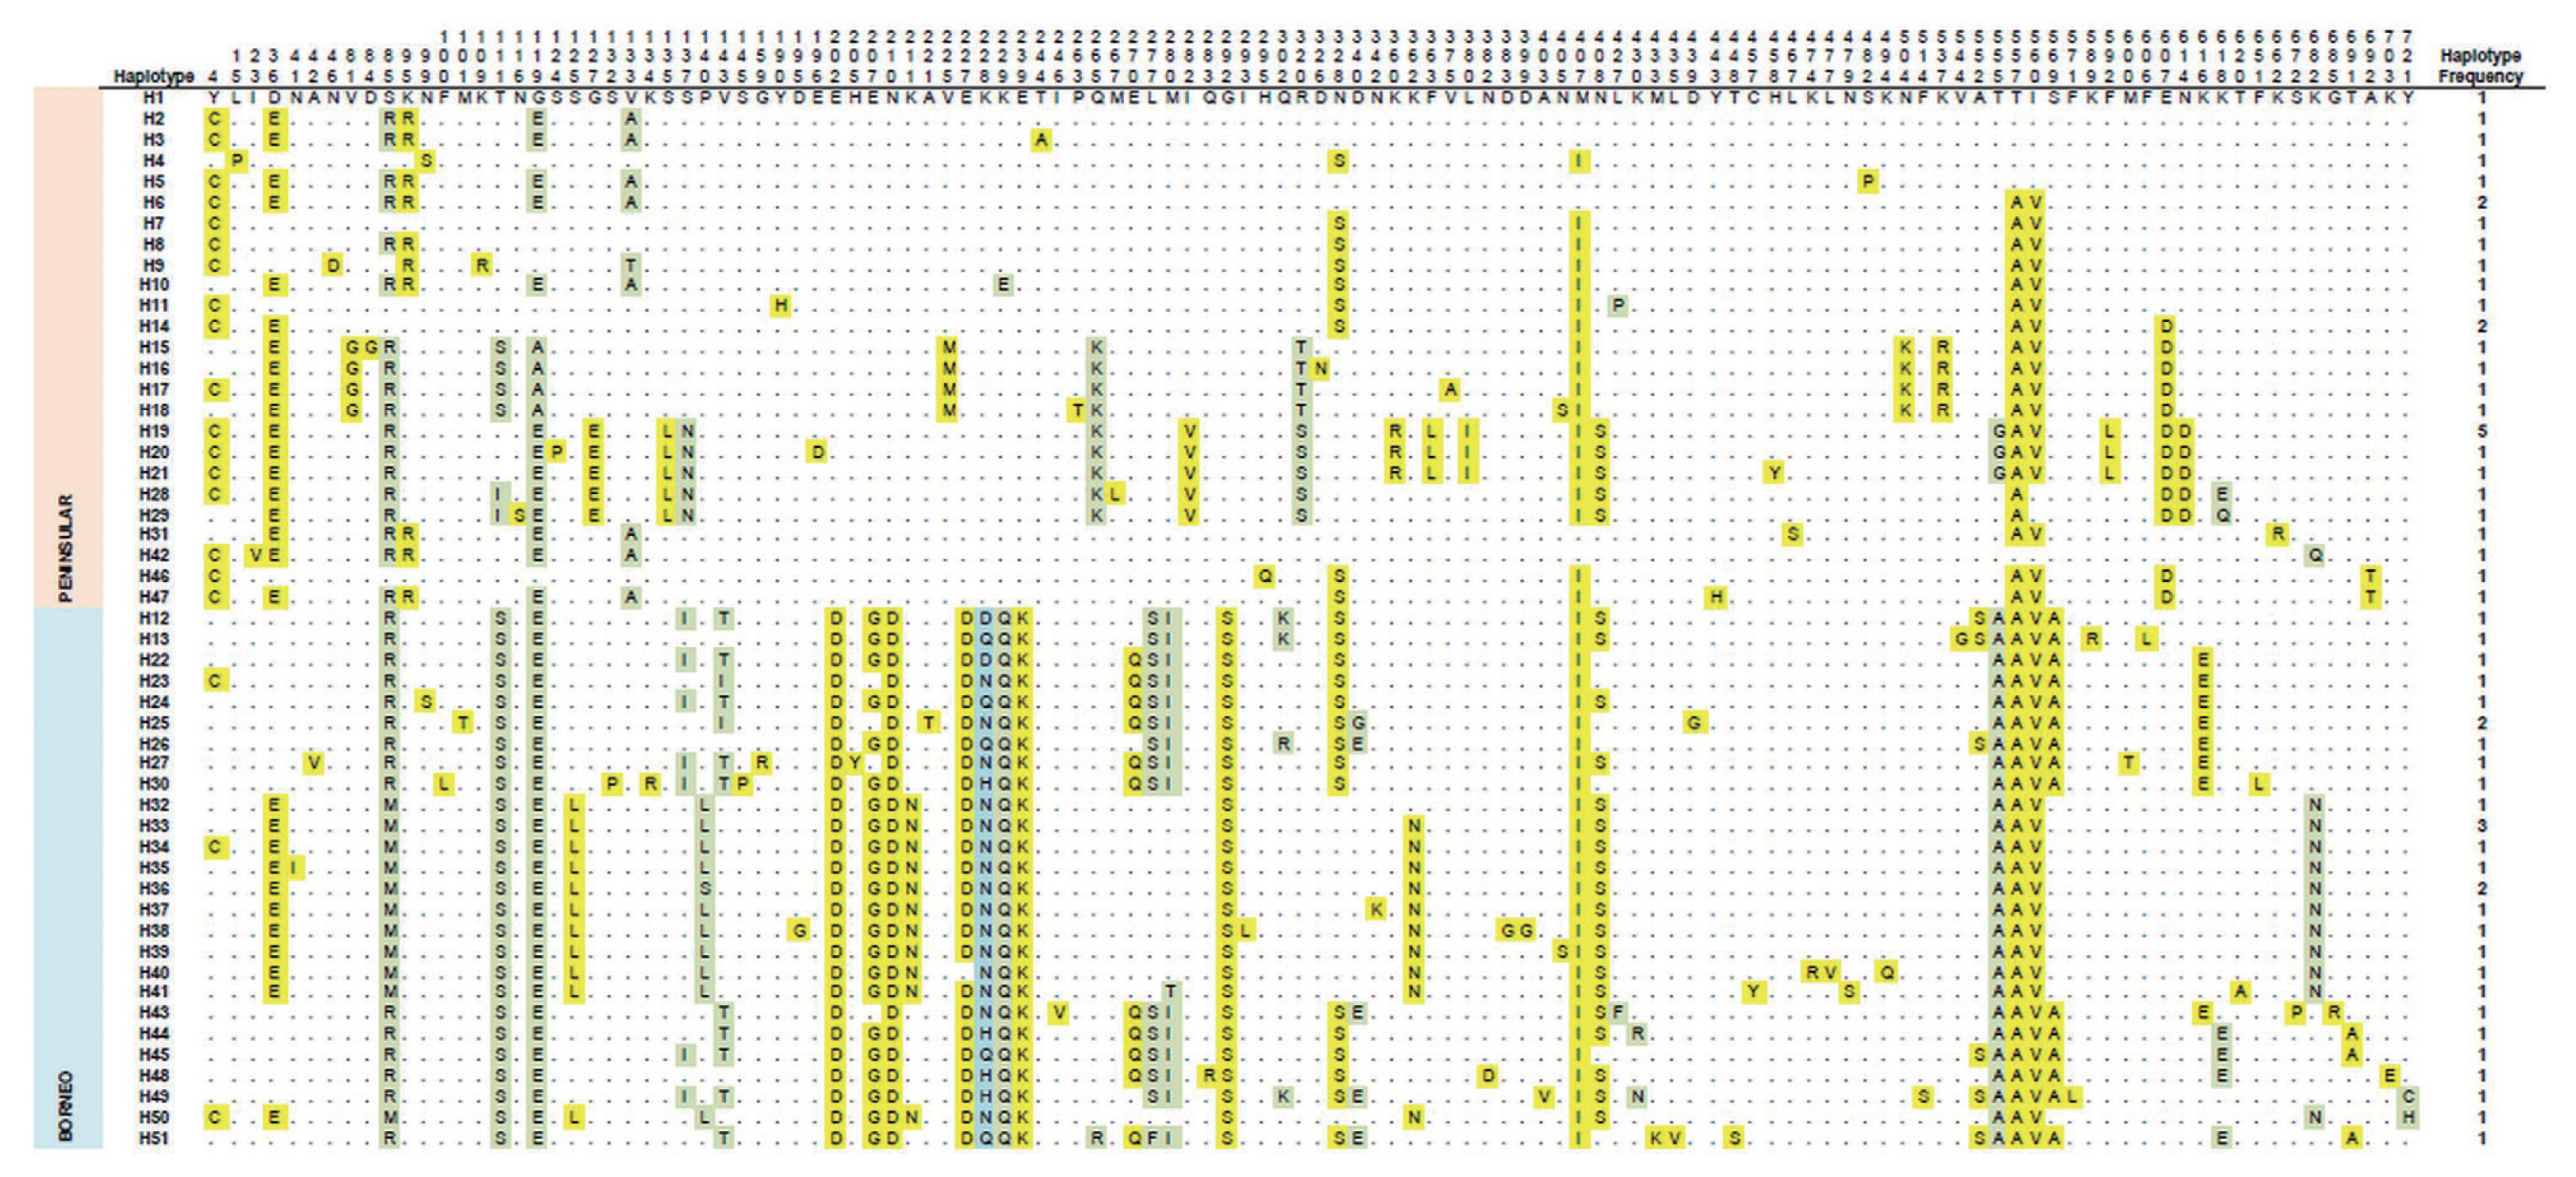
Amino acid sequence polymorphism in PkRAP1 from Peninsular Malaysia and Malaysian Borneo P. knowlesi isolates. Polymorphic amino acid residues are listed for each haplotype. Amino acid residues identical to those of the reference sequence (strain H (haplotype 1)) are marked by dots. Monomorphic, dimorphic and quadrimorphic amino acid positions are marked in yellow, green and blue shadings respectively. Haplotype frequency for each haplotype is listed in the right panel.
Phylogenetic tree and haplotype network analysis of PkRAP1
A phylogenetic tree was constructed based on the 51 haplotypes (Fig. 3). The tree was separated into 2 distinct clustering of Peninsular Malaysia and Malaysian Borneo haplotypes. The PcRAP1 sequence formed a separate branch as an outgroup. In addition to that, a haplotype network (Fig. 4) was constructed for the same dataset. Like the phylogenetic tree, the network showed distinct clustering of the haplotypes according to the geographic origin of the isolates. The size of each node indicated the number of isolates in the haplotypes, and haplotype H19 (5/51) and H33 (3/51) were the predominant haplotype in Peninsular Malaysia and Malaysian Borneo respectively. The FST value between Peninsular Malaysia and Malaysian Borneo PkRAP1 was 0.48269, indicating high genetic divergence between the populations.
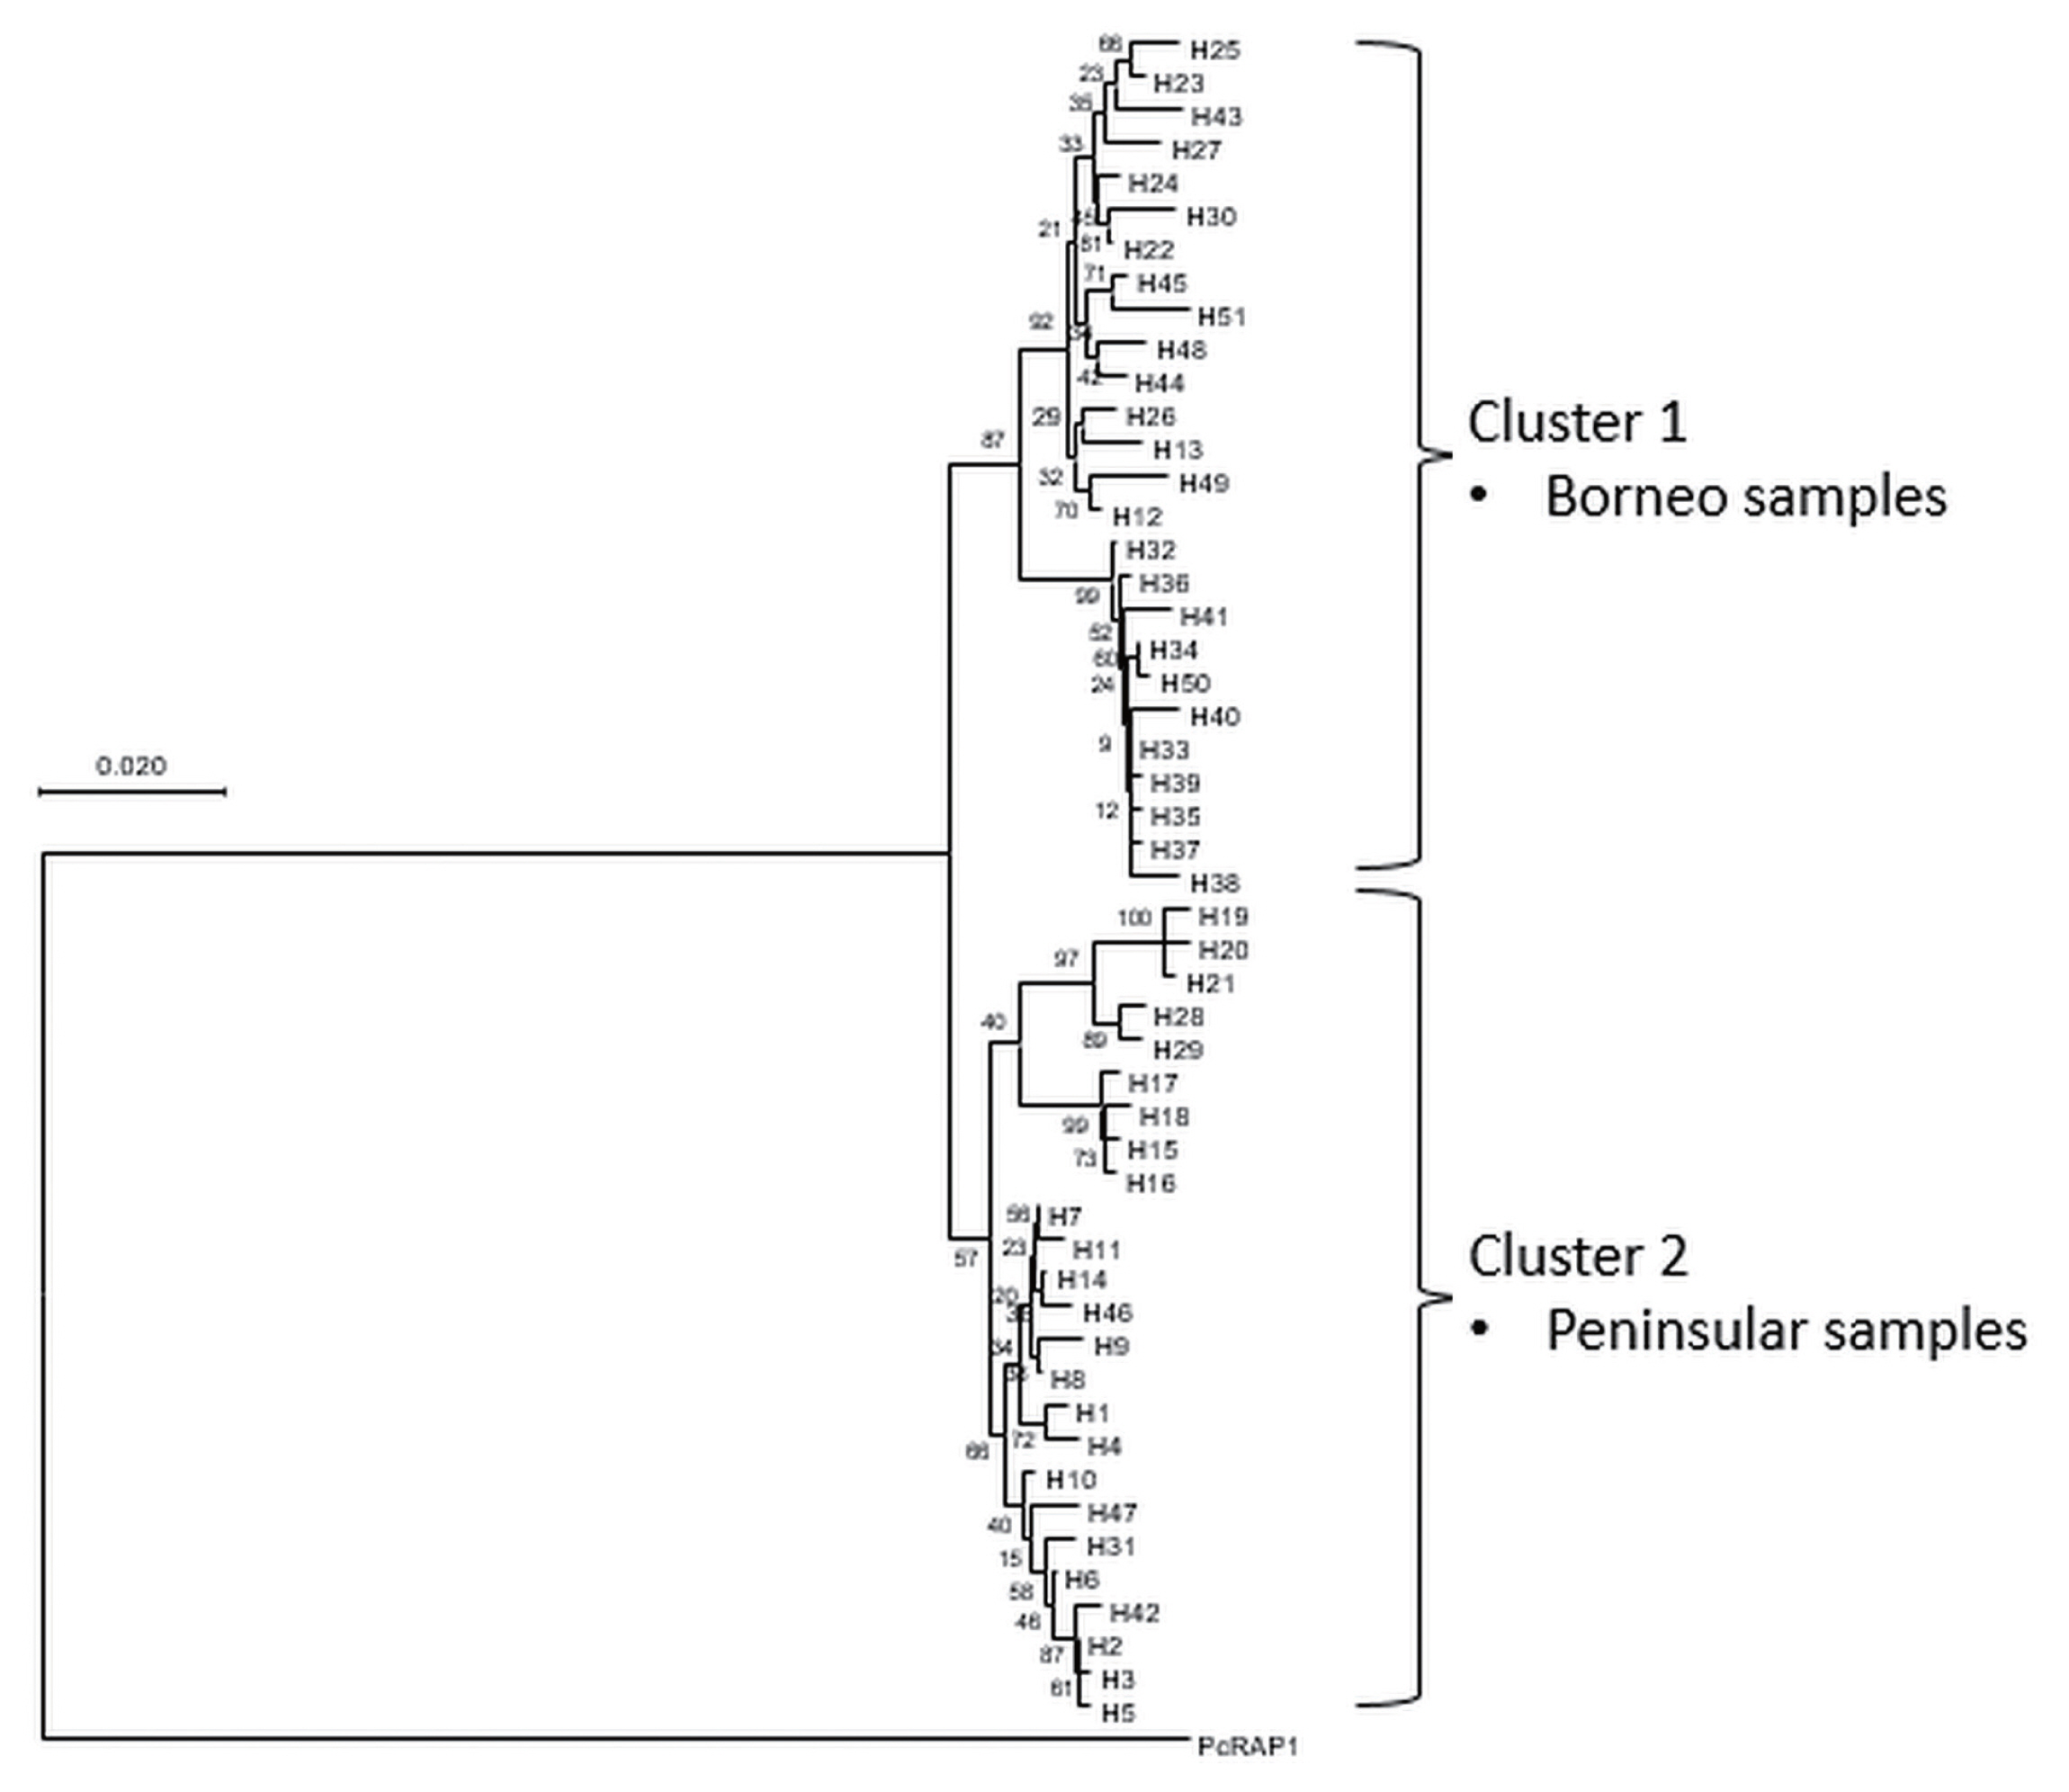
Phylogenetic tree of PkRAP1 haplotypes employing Neighbour-Joining Method with numbers at the node indicating percentage supporting 1,000 bootstrap replicates. P. coatneyi RAP1 is used as an outgroup.
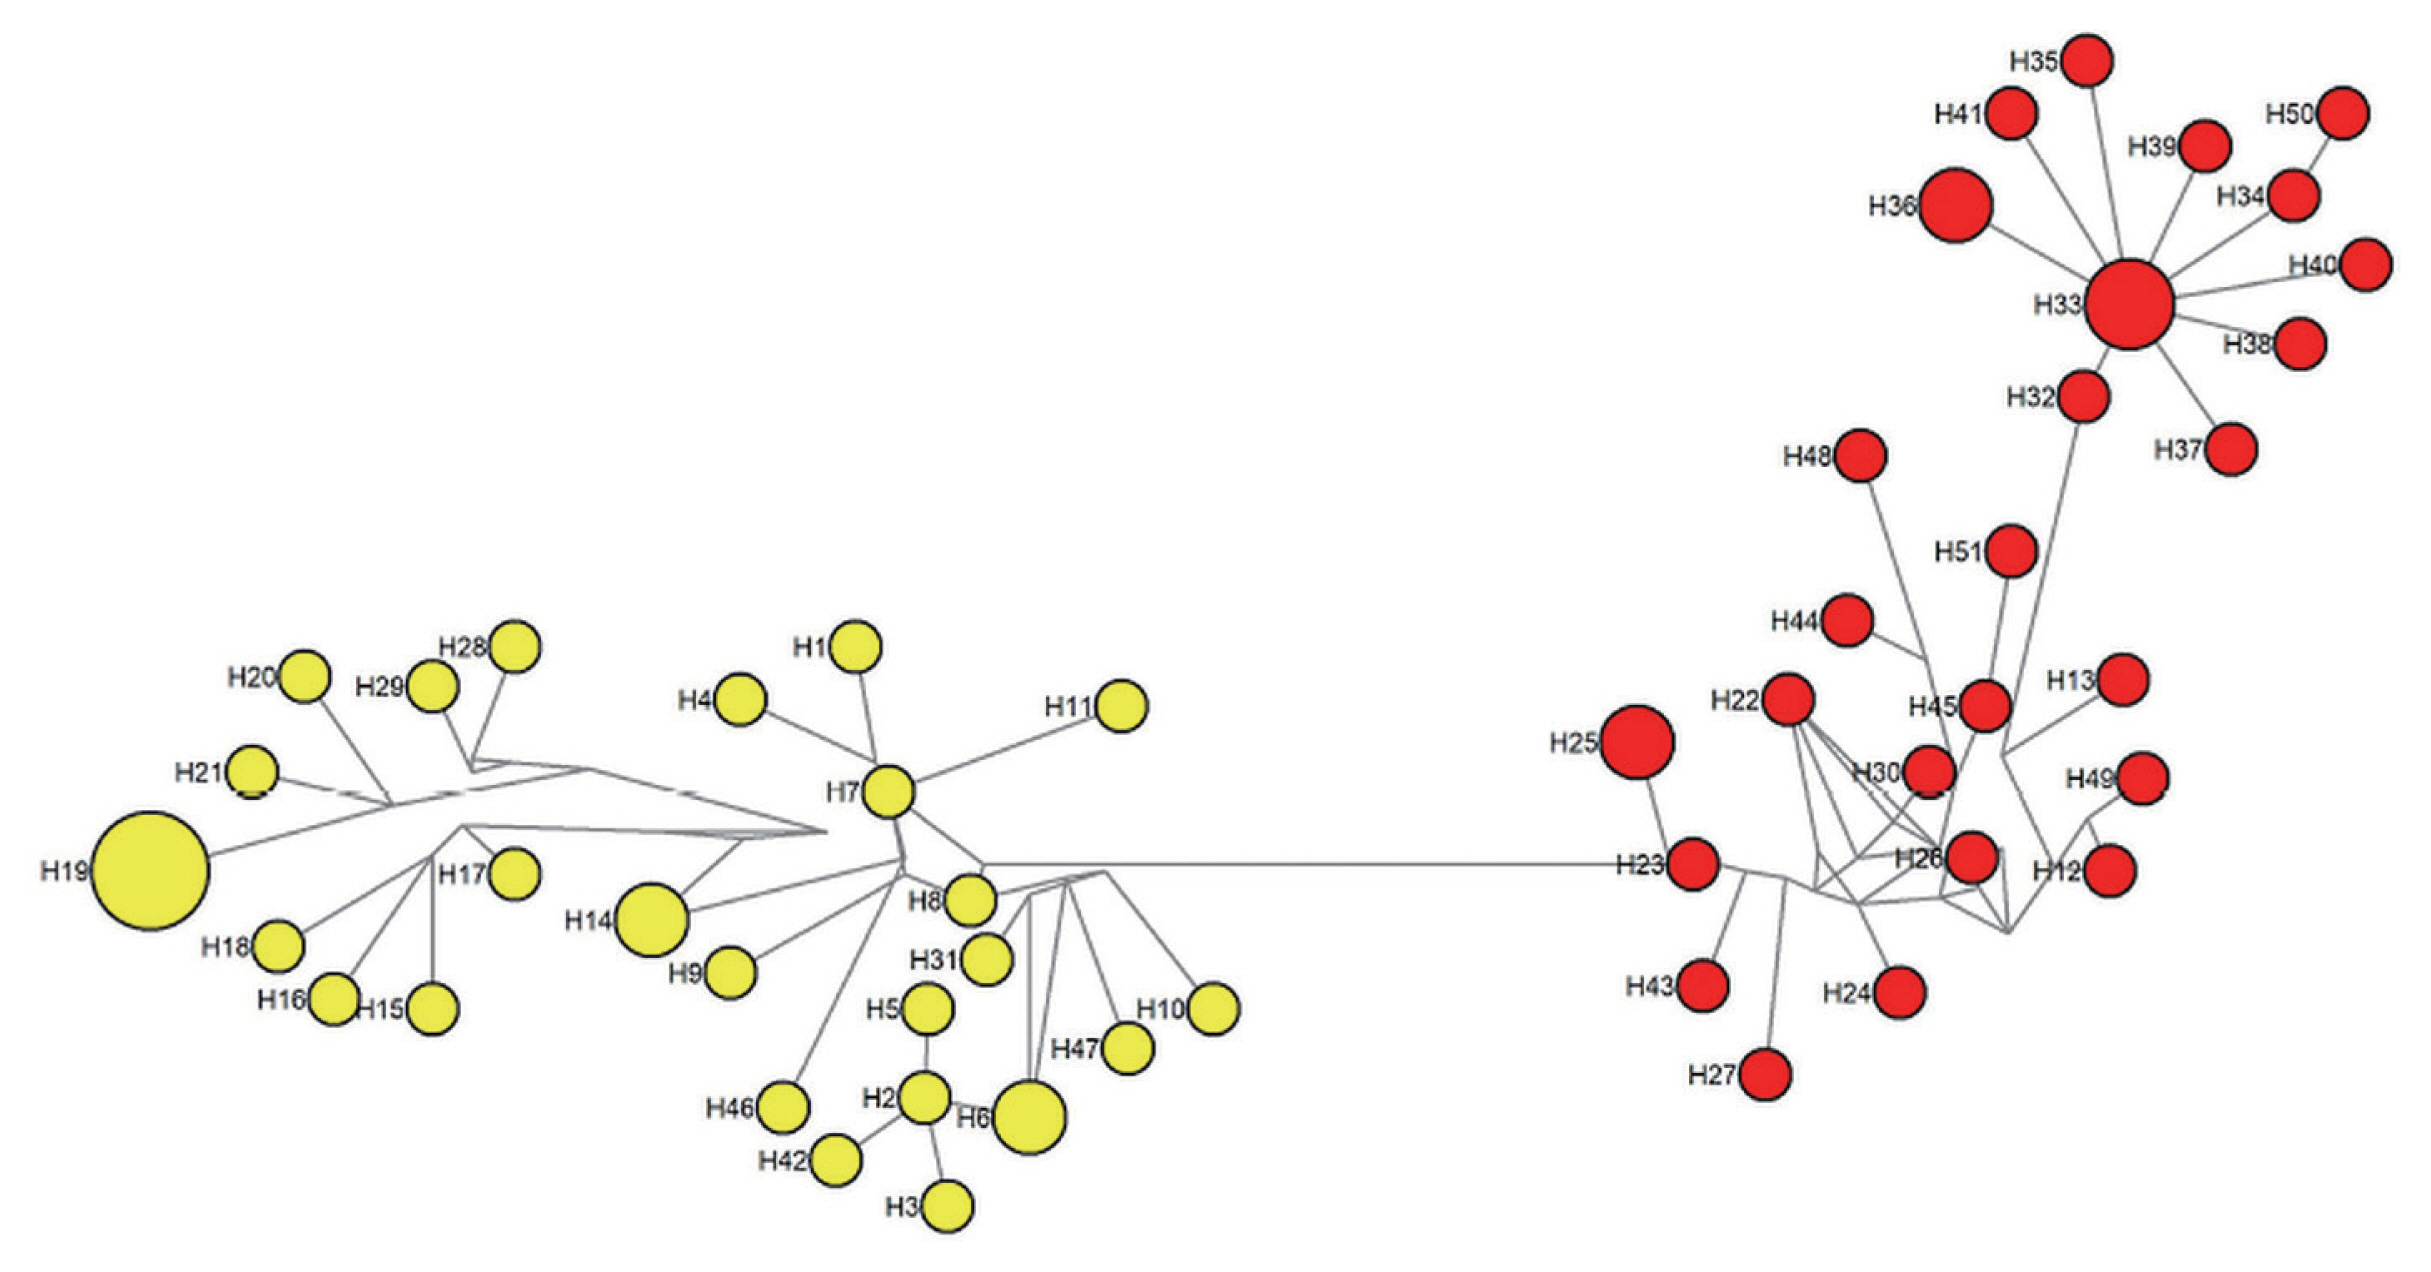
Network analysis of PkRAP1 haplotypes. Yellow nodes indicate Peninsular Malaysia haplotypes and red nodes indicate Malaysian Borneo haplotypes. The size of each node reflects the number of isolates of each haplotype.
DISCUSSION
PkRAP1 is similar to PvRAP1 but was as found to contain 2 exons unlike PfRAP1 which has a single exon [23]. Our study found that the diversity of PkRAP1 was relatively higher than previously reported [16]. This may possibly be due to the larger number of isolates used in this study. The overall level of π in PkRAP1 is higher than PfRAP1 (π=0.0041) [23] and PvRAP-1 (π: 0.00088) [24]. Difference in π across RAP1 of different Plasmodium species may be the result of host immune pressure to adapt to their respective target host cells. Nonetheless, the level of polymorphism was observed to be within the same range as many low polymorphic P. knowlesi genetic markers such as PkDBPαII (π=0.012) [6] and PkNBPXa (π= 0.02186) [25]. On the contrary, high Hd was observed in the PkRAP1, which can be explained by the presence of a high number of singleton sites in the sequences, possibly due to the effect of population expansion [26]. Besides, after a phase of low effective population size, a high Hd could be the result of protein adaptation to population growth [27,28].
The excess of synonymous substitution over the non-synonymous in exon I and CDS of the PkRAP1 is an indication of negative selection [23]. Exon II, which possessed high diversity, displayed evidence of positive selection and this may possibly be due to host immune pressure on this region of the protein [29]. The C-terminal of PkRAP1 is conserved mainly because of the presence of important amino acid residues that play a key role in protein localization to host during the parasite invasion [12,30].
Phylogenetic and haplotype network analyses revealed the distinct separation between the Peninsular Malaysia and Malaysian Borneo PkRAP1. This bifurcation suggests the possible dimorphism of the gene level, as was observed in other P. knowlesi genes such as PkDBPαII [31] and PkNBPXa [25]. The FST index to measure population differentiation based on the genetic structure support the evidence of difference between PkRAP1 gene of Peninsular Malaysia and Malaysian Borneo isolates. A FST value >0.25 indicates exceptionally high genetic differentiation between populations [16,32]. The current study observed FST value of 0.48269 signifies high genetic difference of PkRAP1 of the 2 populations. The occurrence of these distinct genetic differences may be the result of the separation of the fauna of Malaysian Borneo on Borneo Island from those of Peninsular Malaysia on mainland Asia. Thus, the isolated P. knowlesi populations including their natural vertebrate and insect hosts co-exist and evolve separately as different populations [7,26].
In conclusion, this study provides a clearer picture of genetic diversity of the PkRAP1 gene in Malaysia using a larger sample size encompassing isolates from Peninsular Malaysia and Malaysia Borneo. The PkRAP1 gene displays a low level of polymorphism with indication towards negative selection. High genetic differentiation was observed between Peninsular Malaysia and Malaysian Borneo PkRAP1 sequences. Phylogenetic and haplotype network analyses revealed distinct clustering of the gene sequences, providing evidence for the existence of 2 P. knowlesi lineages in Malaysia.
Supplementary Information
ACKNOWLEDGMENTS
This study was supported by the Long Term Research Grant Scheme (LRGS/1/2018/UM/01/1/1) of the Ministry of Higher Education, Malaysia. We would like to express our gratitude to Dr. Mohd Hafizi Abdul Hamid and Dr. Jenarun Jelip from Vector Borne Disease Sector, Disease Control Division, Ministry of Health, Malaysia, Dr. Rose Nani Mudin (Sabah Health Department Director) and Dr. Ooi Choo Huck Sarawak Health Department Director) for their contribution in coordinating nationwide sample collection. We also thank the public health officials from the Malaysian State Health Department and District Health offices in Pahang, Kelantan, Johor, Kedah, Terengganu, Perak, Negeri Sembilan, Selangor, Sabah, Sarawak and Federal Territory of Kuala Lumpur for their help in sample collection.
Notes
The authors declare no conflict of interest related to this study.