General properties and phylogenetic utilities of nuclear ribosomal DNA and mitochondrial DNA commonly used in molecular systematics
Article information
Abstract
To choose one or more appropriate molecular markers or gene regions for resolving a particular systematic question among the organisms at a certain categorical level is still a very difficult process. The primary goal of this review, therefore, is to provide a theoretical information in choosing one or more molecular markers or gene regions by illustrating general properties and phylogenetic utilities of nuclear ribosomal DNA (rDNA) and mitochondrial DNA (mtDNA) that have been most commonly used for phylogenetic researches. The highly conserved molecular markers and/or gene regions are useful for investigating phylogenetic relationships at higher categorical levels (deep branches of evolutionary history). On the other hand, the hypervariable molecular markers and/or gene regions are useful for elucidating phylogenetic relationships at lower categorical levels (recently diverged branches). In summary, different selective forces have led to the evolution of various molecular markers or gene regions with varying degrees of sequence conservation. Thus, appropriate molecular markers or gene regions should be chosen with even greater caution to deduce true phylogenetic relationships over a broad taxonomic spectrum.
INTRODUCTION
During the past decade, the field of molecular systematics which uses various molecular data to infer the phylogenetic relationships among taxa has been rapidly developed and improved with progress of molecular biological tools such as DNA hybridization, polymerase chain reaction-restriction fragment length polymorphisms (PCR-RFLP), randomly amplified polymorphic DNA (RAPD), allozyme data, microsatellite DNA, and so on (O'Brein et al., 1991; Bernatchez and Danzmann, 1993). Biologists such as parasitologists, geneticists, and taxonomists have preferred to use RFLP, RAPD, or allozyme data rather than sequence-based molecular markers to resolve phylogenetic problems, because the former methods have provided economical and rapid ways to obtain the final result. Furthermore, aquisition of DNA sequence data is more difficult and needs much more time and money. Nevertheless, DNA sequencing is the best way to directly estimate genetic variations of specific genes among taxa examined. Thus, we will focus on sequence-based molecular markers or gene regions related only to nuclear ribosomal DNA (rDNA) and mitochondrial DNA (mtDNA) in this paper, although numerous molecular markers or genes have been employed in broad ranges to elucidate a variety of phylogenetic problems.
Due to the arbitrariness of taxonomic categories and the differences in the evolutionary rates of analyzed genes or molecular markers among the taxa examined, no sweeping generalizations could be made about the taxonomic rank at which particular markers or gene regions are useful. For instance, in the case of parasites, the evolutionary rate (the degree of sequence variation) of the selected molecular markers or gene regions is much faster than that of independent organisms (Hwang et al., 1998). To elucidate phylogenetic relationships among parasites, therefore, we should employ more conserved (slowly evolving) molecular markers or gene regions than those generally used for independent organisms. It is difficult to establish a general and uniform scheme concerning the molecular markers applicable and suitable for each categorical level. However, it is necessary to review general properties and phylogenetic utilities of nuclear rDNA and mtDNA that have been most commonly used as molecular markers.
General properties and phylogenetic utilities of the nuclear rDNA
Nuclear rDNA, which encodes rRNAs, has been most commonly applied in phylogenetic approaches. Eukaryotic nuclear rDNA is tandemly organized with high copy numbers up to ca. 5,000. Each repeat unit consists of genes coding for the nuclear small subunit (SSU), large subunit (LSU), and 5.8S rDNAs. These coding regions are separated from each other by spacers. The SSU and LSU rDNAs are separated by the two external transcribed spacers (ETS) and a non-transcribed spacer (NTS). Both spacers are mainly called an intergenic spacer (IGS). The 5.8S rDNA is embedded in the two internal transcribed spacers (ITS1 and ITS2) as shown in Fig. 1.
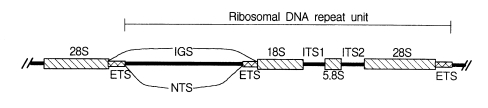
Schematic diagram of a tandem repeat unit of rDNA.
The nuclear rDNA spacer regions evolve much faster than the nuclear rRNA coding regions because the substitutions occurring in spacer regions do not show lethal effects on the organisms. Spacer regions have conducted neutral mutations without any strong constraints. It results in a relatively fast evolutionary rate of spacer regions. In contrast, variations of rRNA coding regions yield mutations of encoded rRNA sequences. They can prevent the successful ribosome construction, which could affect negatively on the protein synthesis machinery. Thus, the rRNA coding regions are more conserved relative to the spacer regions. Because of such different rates of evolution among different regions of nuclear rDNA, the nucleotide sequences of nuclear rDNA have been used to infer a broad spectrum phylogenetic relationships, which include studies among the basal lineages of life and the relationships among closely related species or populations.
The nuclear SSU rDNA is one of the most highly conserved DNA regions and has been used to reconstruct deep phylogenetic branches that include kingdoms, phyla, classes, or orders (Field et al., 1988; Abele et al., 1989; Friedrich and Tautz, 1995; Aguinaldo et al., 1997; Whiting, 1998). It has been used most successfully for reconstructing phylogenetic events from the Precambrian (540 mya).
The degree of nucleotide conservation of 5.8S rDNA which is the smallest nuclear rDNA of the cluster is similar to that of SSU rDNA, but its length (ca. 150 bp) is too short to contain enough phylogenetic information. Due to the short length in DNA sequence, it is not advisable to use 5.8S rDNA region for phylogenetic reconstruction.
Nuclear LSU rDNA is much lager and shows more variation in the rate of evolution of its different domains compared to the SSU rDNA. It has many divergent domains or expansion segments, so the size of the gene varies considerably among phyla. Nuclear LSU rDNA is known to be useful in examining phylogenetic relationships in slightly low categorical levels such as the orders or families (Friedrich and Tautz, 1997; Hwang et al., 1998; Whiting, 1998).
The nuclear SSU and LSU rDNAs consist of several domains. Some of these are highly conserved, whereas others are not. The rapidly evolving segments of high variability have been called "expansion segments" or "variable regions". The large size variations of nuclear SSU and LSU rDNAs are mainly caused by expansion of variable regions (Volger et al., 1997; Hwang et al., 1998, 2000; Choe et al., 1999a, 1999b). Their sequences are too variable to obtain an unambiguous alignment of distantly related species (among class or above). Thereby, the nucleotide sequences of variable regions of nuclear SSU and LSU rDNAs have been sometimes used for relatively low categorical levels such as families or rare genera.
The secondary structures of variable regions of nuclear SSU and LSU rDNAs have also become a useful tool for phylogenetic studies on relatively higher levels (above order) of animal evolution than their primary structure (Bachellerie and Michot, 1989; Hwang et al., 2000). These studies showed that the major features of rRNA secondary structure are strongly conserved despite continued evolution of the primary sequence, because compensatory mutations occur between the paired nucleotides.
Due to the high variability, rDNA spacer regions, IGS and ITS have been employed to resolve phylogenetic problems in lower categorical levels among genera, species, or populations (Morgen and Blair, 1998; Navajas et al., 1998; Perera et al., 1998). The size of IGS (ca. 4-5 kb) is far larger than those of ITS regions (ca. 1 kb). In the case of ITS, there exist some dramatic size variations as shown in human (ca. 2 kb) and strepsipteran insects (ca. 1.8 kb, unpublished data). Due to the large size of the IGS, ITS regions have been preferred to IGS in phylogenetic approaches. The IGS has been used less frequently for phylogenetic studies, except in RFLP of entire rDNA arrays (Wheeler, 1989). RFLP studies have shown that the spacer regions can be used to infer phylogeny among closely related taxa that have diverged within the last 50 million years (Hillis and Dixon, 1991). In recent years, PCR amplification of the relatively large size IGS becomes possible with two primers designed from 28S rDNA 3'-end and 18S rDNA 5'-end by using long PCR technology (Ryu et al., 1999).
IGS consists of subrepeats, differing in sequence and copy number. Recently, we have determined a primary structure (5,376 bp) of IGS from the swimming crab, Charybdis japonica by long PCR (Ryu et al., 1999). The length of ETS was 1,979 bp, which is the longest one among those of arthropods ever known. It is the first report of a complete IGS sequence from a member of the order Decapoda and the second from the subphylum Crustacea since a branchiopod crustacean, Daphnia pulex (Crease, 1999), was published. In addition, the repeats and subrepeats within the IGS were discribed in detail (Fig. 2) and hypothetical evolutinary process responsible for generating the repeat structure was proposed using unequal crossing over and gene conversion and so on (Ryu et al., 1999). In contrast to the IGS, the ITS has no internal repetitive structure, making this region more accessible to direct DNA sequence analysis.
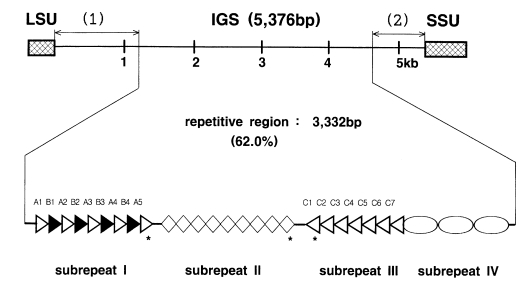
Structural organization of the IGS region of a branchiopod crustacean, Charybdis japonica rDNA. The 1,195 bp non-repetitive region 1 and the 813 bp non-repetitive region 2 are marked with numbers in parentheses at the top. The 3,332 bp repetitive region is composed of 4 subrepeats. The tandem array of 960 bp repeat units is represented by various arrow heads. The array of 9 open diamonds represent the 142 bp repeat units. The array of the 3,390 bp repeat unit is represented by open oval. The asterisks indicate the truncated repeat unit. (Courtesy of Ryu et al., 1999)
Hillis and Dixon (1991) presented many conserved sites that could be used as primer sites for PCR amplification of specific regions of nuclear rDNA. Their review provides additional information related to phylogenetic approaches based on the rDNA.
General properties and phylogenetic utilities of the mtDNA
The mtDNA of multicelluar animals consists of a closed circular DNA molecule except in some cnidarians, where it consists of one or two linear molecules (Warrior and Gall, 1985; Bridge et al., 1992). Its usual size ranges from 14 to 17 kb, but variations as large as 40 kb are known (Wolstenholme, 1992). Despite this size variation, there is little variation in the gene content, since all cases analyzed show that the larger size is due to either the variation in the length of a noncoding region (Harrisson, 1989) or the iteration of some portion of the mtDNA (Moritz and Brown, 1987; Staton et al., 1994).
Metazoan mtDNAs ordinarily contain 36 or 37 genes as shown in Fig. 3; two for ribosomal RNAs (16S rRNA and 12S rRNA), 22 for tRNAs and 12 or 13 for subunits of multimeric proteins of the inner mitochondrial membrane (cytochrome oxidase I-III [COI-III], ATP synthase 6 and 8 [A6 and A8], NADH dehydrogenase 1-6 and 4L [ND1-6, ND4L], and cytochrome b apoenzyme [Cytb]). In addition, there is usually at least one sequence of variable length that does not encode any gene (e.g. control region or A+T rich region). In vertebrates and insects, these noncoding sequences are known to include elements that regulate and initiate mtDNA replication and transcription. Complete mitochondrial DNA sequences have been published for 23 invertebrates; 3 echinoderms, 11 arthropods, 1 annelid, 4 mollusks, 3 nematods, and 1 cnidarian (Hwang, 1998).
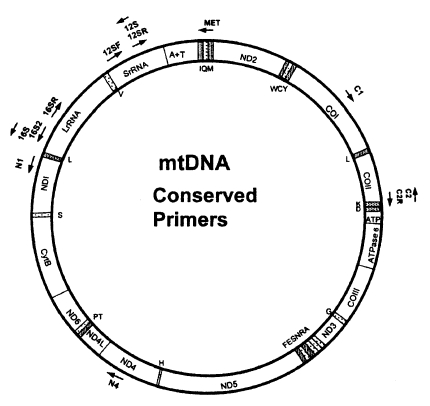
Position and orientation of conserved primers on a typical insect mtDNA map. (Courtesy of Roehrdanz and Degrugillier, 1998)
Mitochondrial DNA is known to evolve much faster than the nuclear genome. Consequently, most of the mitochondrial protein coding genes have been used to examine phylogenetic relationships in relatively lower categorical levels such as in families, genera, species or populations. Due to the high rate of substitution occurring in the third codon positions (wobble positions) of protein coding genes, the DNA sequences of protein coding genes have frequently been used for species level or population level phylogeny (Navajas et al., 1996). In contrast, because its amino acid sequences are much more conserved than nucleotide sequences, it has been applied to relatively higher levels such as in families or rarely among orders (Liu and Beckenbach, 1992; Frati et al., 1997).
The control region of mtDNA, the unassigned region, is hypervariable and there exist variations even between individuals. This region is generally variable in size and contains tandem repeats in many cases, like in the IGS of the nuclear rDNA. Thus, this region has been mainly used for phylogenetic studies among species, subspecies, or populations (Zhang and Hewitt, 1997).
Although mtDNA has evolved faster than nuclear genome, 12S rDNA, however, is highly conserved like the nuclear SSU rDNA, which has been employed to illustrate phylogeny of higher categorical levels such as in phyla or subphyla (Ballard et al., 1992). On the other hand, 16S rDNA is more variable than 12S rDNA. Thus, 16S rDNA is usually used for phylogenetic studies at mid-categorical levels such as in families or rare genera (Black IV and Piesman, 1994; Kambhampati et al., 1996).
The mtDNA gene arrangements in arthropods known so far appeared to be highly conserved, although two dramatic exceptions of the mtDNA gene rearragement were reported from a metastriate tick, Rhipicephalus sanguineus (Black IV and Roehrdanz, 1998) and a cattle tick, Boophilus microplus (Campbell and Barker, 1998). Generally, it is likely that the mtDNA gene arrangements in animal groups are usually highly conserved within the phyla; thus, when the rearrangements occur, they are known to be powerful markers for inferring deep evolutionary history (Sankoff et al., 1992; Boore et al., 1995, 1998; Hwang et al., 1998).
Compared to the nuclear rDNA, it is more difficult to design universal primers for amplifying specific regions in mtDNA due to a high variability. That is why only a few mitochondrial genes such as 12S rDNA, 16S rDNA, Cytb, ND1 and COI have been employed in phylogenetic studies. In general, 12S and 16S rDNAs are the most conserved regions among the mitochondrial genes. COI is the most conserved among 3 cytochrome oxidase coding genes, and also ND1 among 7 NADH dehydrogenase coding genes. Cytb is more conserved than ND1 but less than COI. Until now, 12S and 16S rDNAs, Cytb, COI, ND1 genes have been employed most commonly among gene regions derived from mtDNA. It implies that the frequency used as gene regions in phylogenetic studies is closely related with the degree of the gene conservation. That is why high degree of conservation makes it possible to easily construct universal primers.
Kocher et al. (1989) successfully constructed three pairs of mtDNA primers possessing unexpectedly wide taxonomic utility from the regions. Thereafter, an advanced review about phylogenetic utility and evolution of mtDNA was published by Simon et al. (1994), which compiled the conserved PCR primers useful for amplifying and sequencing mtDNA. In addition, universal primers for amplifying the COI gene in insects were disigned by Lunt et al. (1996) and Zhang and Hewitt (1996). Most recently, Roehrdanz and Degrugillier (1998) designed 12 conserved primers which can be used to amplify partial mtDNA regions from 33 insect species representing 14 orders (Fig. 3). The resulting primers are very useful for phylogenetic and population researches in a wide range of taxa. As universal primers or primers specific to a certain taxon are continuously developed, DNA sequence data from the mtDNA are being used with increasing frequency to estimate phylogenetic relationship among animal taxa.
Selection criteria for appropriate molecular markers or gene regions
The process of choosing a region that is likely to be appropriate for a particular systematic question is perhaps the most critical step in any phylogenetic analysis. Applications of inappropriate molecular markers or gene regions have often been observed in publications made by biologists who do not major in molecular systematics. Most of such misuses are caused by a lack of understanding of properties of molecular markers or gene regions by the negligence in the categorical levels examined. Selecting molecular markers or gene regions, a number of special considerations are necessary because selection of inappropriate molecular makers or gene regions is not apt to result in correct phylogenetic relationships. For instance, for studies of relationships among closely related species, the use of nuclear rRNA coding regions (such as nuclear SSU, LSU, 5.8S rDNA) can be problematic, whereas unconstrained sites (third codon positions) in the mitochondrial protein coding genes such as Cytb, COI, COII, ND1, or ND2, and nuclear rDNA spacers such as IGS or ITS appear to have fewer problems. On the other hand, for deep levels of divergence, the protein coding genes are saturated at the amino acid level and highly conserved regions of rDNA are useful. We summarized in Table 1 the appropriate categorical levels of commonly used molecular markers or gene regions in rDNA and animal mitochondrial DNA.
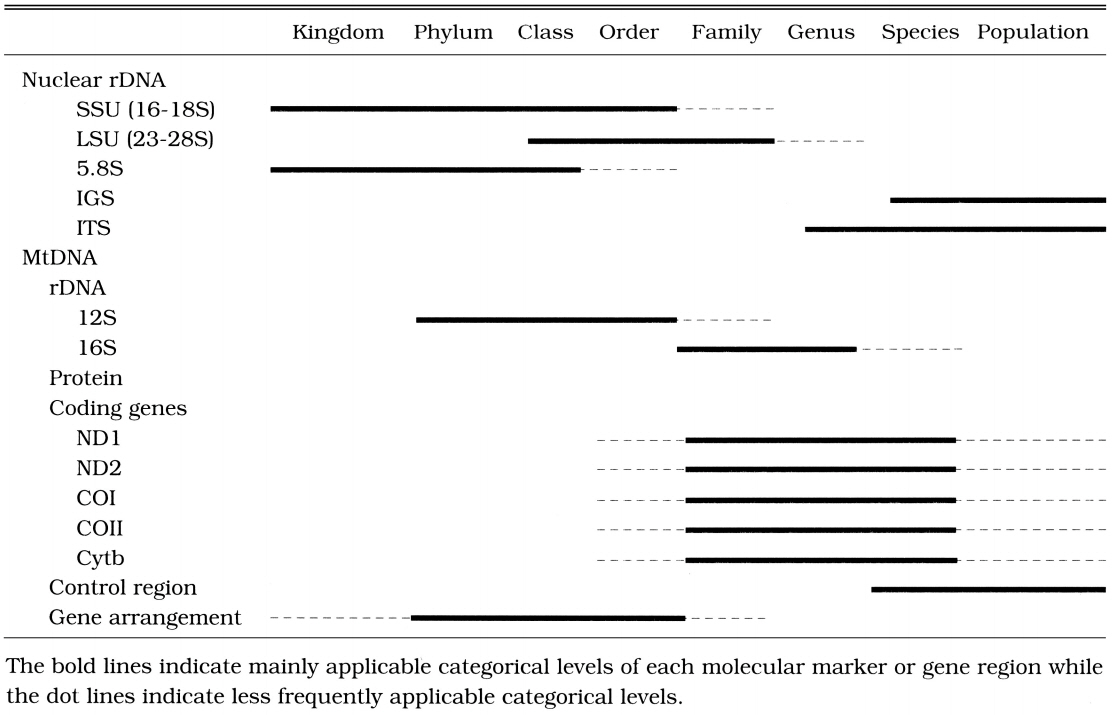
Applicable categorical levels of each molecular marker or gene region
Kingdom: nuclear SSU rDNA
Proposal for the domains Archaea, Bacteria and Eucarya
The detailed and comprehensive phylogeny inferred from SSU rRNA sequence comparisons showed that the life on this planet can be devided into three primary domains which are the Bacteria, the Archaea and the Eucarya, each containing two or more kingdoms (Fig. 4). The eucarya, for example, contains four kingdoms such as Animalia, Plantae, Fungi, and (eukaryotic) Protista (Woese et al., 1990). The result suggested that the conventionally accepted views of the natural relationships among living systems (i.e., the five kingdom sytstem or the eukaryote-prokaryote dichotomy) should be reconsidered.
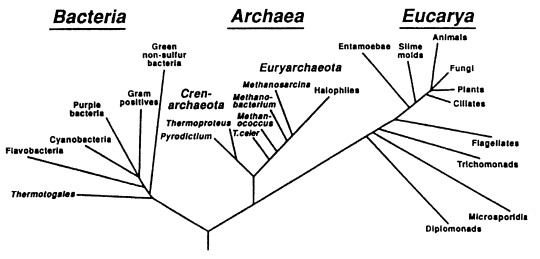
Phylogenetic tree showing the three domains based on nuclear SSU rRNA sequences. (Courtesy of Woose et al., 1990)
Phylum: (1) nuclear SSU rDNA
Inclusion of the phylum Pentastomida in the Crustacea
Pentastomes are vermiform, obligate parasites that, except for a mouth flanked by two paired hooks (Fig. 5A), are largely devoid of morphological characters. Before Ablele et al. (1989), various authors had suggested a variety of hypotheses related to the phylogenetic position of the parasites. At that time, for instance, parasitology texts had treated the group as an independent phylum (Cheng, 1986), a class of Mandibulata (Beaver et al., 1984), or an order of the Arachnida (Brown and Neva, 1983). To resolve phylogenetic status of pentastomes (tongue worms), Abele et al. (1989) determined the SSU rRNA sequences of the pentastome Porocephalus crotali. The result of the phylogenetic analysis performed with SSU rRNA sequences of the other major arthropod groups supported Argulus/Porocephalus clade (Fig. 5B). It provided a strong support for the proposal that tongue worms are highly modified crustacean closely related to fish lice.
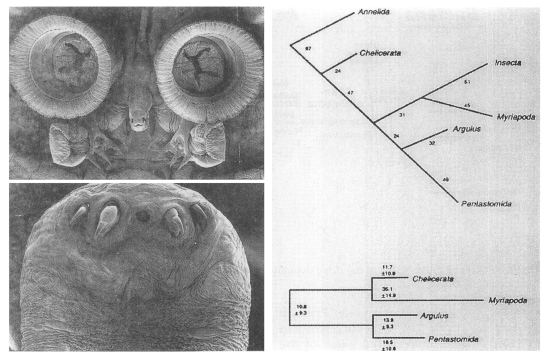
A. Anterior, ventral surface of Argulus nobilis (top) and anterior portion of Porcephalus crotali (bottom). B. Maximum parsimonious tree (top) showing that the Pentastomida phylogenetic position is within the Crustacea (total tree length=370, CI=0.681, on the basis of 164 informative sites). An annelid was used as an outgroup. The numbers on each branch indicate branch lengths (steps). Relationships (bottom) reconstructed by the method of invariants/operator metrics. Branch lengths are number of transversions/1,000 nucleotides and are to scale. (Courtesy of Abele et al., 1989)
(2) 12S rDNA
Onychophorans are modified arthropods
The phylogenetic position of the phylum Onychophora (velvet worms) has generated considerable debate to date. Assuming arthropod monophyly, onychophorans have been described as the missing link between arthropods and annelids (segmented worms) because of physical similarities to both groups, or as a sister group of myriapods and hexapods forming "Uniramia".
On the basis of mitochondrial 12S rDNA sequence data, Ballard et al. (1992) suggested that arthropods are monophyletic and they include the onychophorans (Fig. 6). It indicated that onychophorans are modified arthropods.
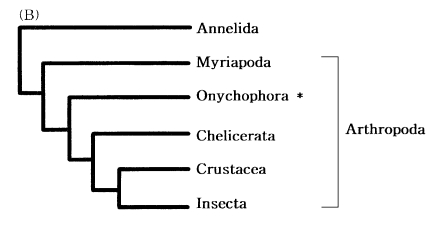
Phylogenetic position of the phylum Onychophora. Annelids were used as outgroups. (modified after Ballard et al., 1992)
Subphylum or Class: mtDNA gene rearrangement
Arthropod phylogeny
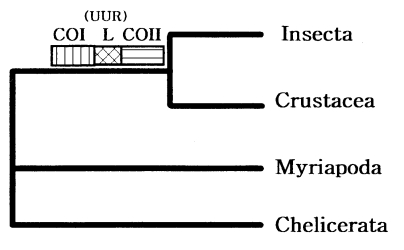
The four major arthropod groups are Chelicerata (scorpions and horse shoe crabs), Crustacea (crabs and brine shrimp), Myriapoda (centipedes and millipedes), and Insecta (flies and beetles). Much of arthropod evolution remains contentious, while there has been general agreement based on morphological characters that myriapods are the closest relatives of insects, forming a group known as the Atelocerata. In contrast, most of DNA sequence analyses related to arthropod phylogeny strongly supported an insect-crustacean relationship. Based on partial mitochondrial gene arrangements, Boore et al. (1998) also suggested a sister-group relationship of Insecta and Crustacea that excludes myriapods (Fig. 7).
Recently, to elucidate myriapod phylogenetic position, we completely determined the mtDNA sequence of a centipede Lithobius forficatus (Myriapoda) (Hwang, 1998). The Lithobius mitochondrial gene arrangements also support that insects form a sister group with Crustacea but not with myriapods. It was very similar to those in other arthropods, extending the observation that the mitochondrial gene arrangement is conserved in myriapods. Although some variations in the positions of the tRNA genes occurred, the relative arrangements of protein and the rRNA genes were identical in all arthropods investigated, except for a few exceptions discovered in ticks; thus, strongly supporting arthropod monophyly.
Superorder: Secondary structure of nuclear SSU rDNA
Insect phylogeny
We had previously determined the nuclear SSU rDNA from a number of collembolan species (Hwang et al., 1995; Lee et al., 1995a, 1995b). We found that the sequence length of the collembolan nuclear SSU rDNA is far shorter than those of dipteran insects and the differences of the sequence lengths are mainly caused by expansions of V4 and V7 regions (Fig. 8A) in dipteran insects (Hwang et al., 1995). This finding made it possible to deduce that the primary and secondary structures of these two variable regions may provide us with some critical information related to the insect phylogeny and the SSU rRNA evolution. In our recent investigation, we reported that the lengths of primary sequences and the shapes of secondary structures of these two hypervariable regions of insect SSU rRNA, even at superorder levels, are phylogenetically informative and reflect major steps in insect evolution as shown in Fig. 8B (Hwang et al., 2000). Compared to wingless insects (Apterygota), the long insertions of 17-74 bp and bifurcated shapes in helices E23-2 to E23-5 of the V4 region were unique synapomorphic characters for winged insects (Pterygota). Holometabolous (complete metamorphosis) insects of Pterygota had unique, long insertions of 20-106 bp in helix 43 of V7 region as well.
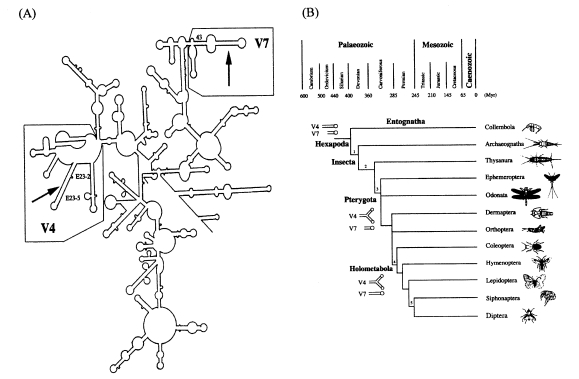
A. Putative nuclear SSU rRNA secondary structure of Hypogastrura dolsana, order Collembola. The two arrows indicate the helices E23-2 to E23-5 in the V4 region and the helix 43 in the V7 region, respectively. These two regions have the highest sequence variability in insect nuclear SSU rDNA. The helix E23-2 and the basal part of the helix 43 were used as anchored pairings for predicting partial secondary structures of all the insect SSU rDNAs accessible from the EMBL data base. The bold lines mark the two regions of anchored pairings. The entire regions of the V4 and V7 are shown in boxes. B. Secondary structure evolution of the helices E23-2 to E23-5 (the V4 region) and the helix 43 (the V7 region) of nuclear SSU rRNA. The paleontological record of major insect subclades according to Kukalova-Peck (1991) is superimposed onto the canonical view of insect phylogeny (Kristensen, 1991). Numbers above branches refer to conspicuous derived character states: (1) ectognathous mouth part, (2) double articulation of mandible, (3) possession of wings, (4) complete metamorphosis, (5) modification of hind wings to halteres, acquisition of a labellum. (Courtesy of Hwang et al., 2000)
Order: nuclear LSU and 5.8S rDNA
Phylogenetic position of the order Strepsiptera
Strepsipterans are a comparatively small group of insects with a very specialized life history and peculiar morphology (Kathirithamby, 1991). The larvae are free living in the first instar and develop thereafter into apodous endoparasites of other insect species.
The phylogentic position of the order Strepsiptera is still ambiguous. While most traditional systematists assumed a close relationship to Coleoptera because these share the hind-wing-based flight mechanism (Kinzelbach, 1990; Kathirithamby, 1991), even the classification as holometabolous insects has been questioned (Kristensen, 1991). However, recent molecular phylogenetic sudies by SSU rDNA sequences have supported a sister-group relationship between Diptera and Strepsiptera (Whiting and Wheeler, 1994; Chalwatzis et al., 1995, 1996). Nevertheless, the molecular evidence for a Diptera/ Strepsiptera sister-group relationship was questioned because Carmean and Crespi (1995) suggested that the Diptera/Strepsiptera sister-relationship is a typical case of a tree estimation bias commonly refered to as long branch attraction.
To resolve the strepsipteran problem, we recently sequenced 5.8S rDNA and the major parts of the nuclear LSU rDNA 5'-region of the strepsipteran species Stylops melittae (Hwang et al., 1998). According to the results of the phylogenetic analyses based on these two genes, when dipteran taxa were excluded in the phylogenetic analysis, all three different tree making methods employed (maximum likelihood, maximum parsimony, neighbor joining) consistently supported the placement of Strepsipera within the Holometabola. On the other hand, when dipteran taxa were included, a maximum likelihood continued to favor a sister-group relationship of Strepsiptera to Mecoptera while the two remaining methods strongly supported a sister-group relationship to Diptera.
Family: 16S rDNA
Phylogenetic relationship among termite families
16S rDNA is one of the most commonly used genes for elucidating the phylogenetic relationships among families (Black IV and Piesman, 1994; Kambhampati et al., 1996). Kambhampati et al. (1996) reported phylogenetic relationships among 10 termite genera of five families based on the DNA sequence analysis of a portion of the mitochondrial SSU rDNA. Their phylogenetic analysis using neighbor joining method and maximum parsimony method, supported the existing hypothesis that Mastotemitidae is the basal lineage among extant termites.
Genus, species, populations: IGS, ITS, ND1, COI, mtDNA control region
Relationships among Echinostoma species based on ITS, COI, and ND1
Trematodes of the family Echinostomatidae are abundant and cosmopolitan parasites that generally cycle through snails and aquatic vertebrates, usually birds. Echinostoma species were distinguished by Morgen and Blair (1995, 1998) using ITS, COI, and ND1 sequence data. Although all three DNA regions successfully distinguished the nominal species, ND1 appears to be the most informative for investigating relationships within the 37 collar-spine group. By examining the degree of saturation, Morgen and Blair confirmed that there exists a high level of saturation in the mitochondrial protein coding genes (ND1 and COI). It indicated that ND1 and COI should not be used to estimate relationships among distantly related species of trematodes and that ITS is better suited for these comparison.
Species-specific repeat units in the IGS of Anopheles aquasalis Curry
Anopheles aquasalis Curry (Subgenus Nyssorhynchus) is an important vector of malaria throughout the coastal regions of South America and on several Caribbean islands. The females of A. aquasalis are confused with A. benarrochi Gabaldon, Cova Garcia, and Lopez, a sympatric species in some regions. Perera et al. (1998) designed a DNA probe specific to A. aquasalis from IGS that can be used for the identification of A. aquasalis using dot blot analysis. The IGS part chosen for making the A. aquasalis specific probe is four tandemly repeated 36-bp units. Three of these repeat units were identical, and the fourth was 94% identical to the others. The dot blot analysis performed with the A. aquasalis specific probes are shown in Fig. 9.
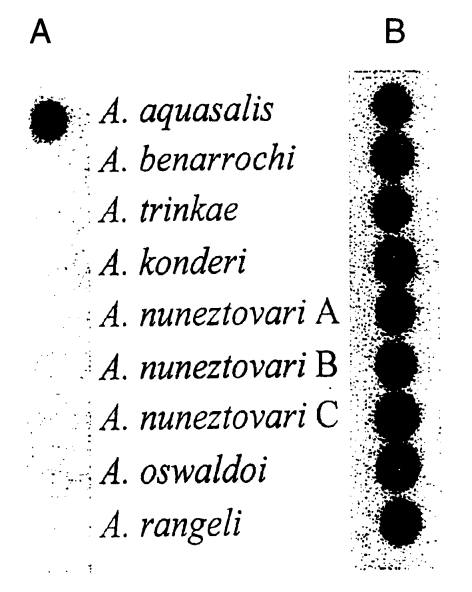
A. Autoradiogram of dot blots made with radiolabeled Anopheles aquasalis-specific oligonucleotide probe and chromosomal DNAs isolated from 9 Anopheles species including A. aquasalis. B. Striped and reprobed with ribosomal DNA of A. smaragdinus to show the presence of equal amounts of chromosomal DNA in each dot. (Courtesy of Perera et al., 1998)
Geographical structure within Paragonimus westermani based on COI and ITS2
Blair et al. (1997) determined COI and ITS2 sequences from geographical isolates of the human lung fluke, P. westermani, from Japan, China, Korea, Taiwan, the Philippines, peninsular Malaysia and Thailand. The phylogenetic analyses based on the nucleotide sequence of the two genes showed that P. westermani is divided into at least two groups such as the northeastern group (host snail, pleurocercids) including diploids and triploids from China, Japan, Taiwan and Korea, and the southern group (host snail, thiarids) including the isolates from Malaysia, Thailand and the Philippines. However, their results did not show any distinguishable relationships among the isolates within the northeastern group. To resolve relations among the isolates, many more variable molecular markers should be applied. Compared to ITS2, the COI gene exhibited many more variable sites due to a high variability of the third codon position and gave a clear indication of the genetic structure within P. westermani.
The coming of age of molecular systematics in the field of parasitology
Recently, Monis (1999) emphasized the importance and necessity of molecular systematics in parasitological research, providing relationships among Giardia intestinalis isolates based on allozyme and nucleotide sequence data of glutamate dehydrogenase as a representative example. However, it is quite difficult for parasitologists to successfully apply molecular systematic methods to their own field because it requires too much time and endeavors to completely understand the principles and techniques of molecular systematics. To make things worse, there exist a veriety of barriers in performing phylogenetic analyses. Maley and Mashall (1998) and Moritz and Hillis (1997) summarized some critical problems occurring in the treatment of molecular data such as selection problems of samples representing for a certain taxon, alignment errors (positional homology) of nucleotide or amino acid sequences, and long branch attraction. It indicates, in addition to choosing one or more appropriate molecular markers mentioned in the previous sections, that there exist other various parameters which should be seriously considered in phylogenetic analyses. Thus, the best way to overcome the barriers is to co-operate between investigators working in the fields of parasitology and molecular systematics. It will promote a rapid collection of the final results (i.e. true phylogenetic tree). It is clear that, as we move towards the year 2000, molecular systematics will increasingly play an important role in parasitology, and the necessity of cooperations will be emphasized more and more.
ACKNOWLEDGEMENTS
The authors heartly thank two anonymous reviewers for helpful and valuable comments on the manuscript.
Notes
This review was presented as an invited lecture for commemoration of the 40th anniversary of the Korean Society for Parasitology, 29 October 1999.
This work was partly supported by a research grant from KOSEF (95-0401-04-01-3) of Korea. Dr. Ui-Wook Hwang was also supported by a Post-Doc. fellowship from KOSEF in 1998-1999.