

INTRODUCTION
Cholangiocarcinoma (CCA) is the cancer of highest prevalence in northeastern Thailand [1,2]. High incidence in the area is strongly associated with consumption of raw fresh water fish containing infectious stages of the liver fluke, Opisthorchis viverrini, a well-established risk factor of CCA [2]. Diagnosis of early stage CCA is rather difficult, due to lack of specific symptoms and of specific tumor markers. Patients with an advanced stage of this disease are not candidates for curative surgical treatment [3]. The results of adjunct therapies, including chemotherapy, radiotherapy, and chemoradiation, are still unclear. Currently, adjuvant chemotherapy is the treatment of choice for the advanced stage of CCA [4]. No standard chemotherapeutic regimen for advanced CCA, however, is currently available. Hence, searching for an effective treatment for CCA is urgent.
To evaluate anti-cancer activity of a candidate substance preclinically, cell lines are valuable resources but limited information are yielded from in vitro experiments. Hence, in vivo models are required to demonstrate the physiological effects of the agents. A hamster carcinogenesis model of O. viverrini-associated CCA was developed previously [5-7]. This model has been used extensively since the pathology is comparable to human O. viverrini-associated CCA [8-12]. It is very useful for the comparative study of CCA initiation-promotion [13], but due to its chronic inflammation-related nature, this model is rather time-consuming and may not be suitable for anti-cancer agent screening. On the other hand, the xenograft transplantation model of human CCA in immunodeficient mice is costly [14]. Therefore, the development of an O. viverrini-associated hamster CCA cell line is useful to develop an in vivo model for anti-CCA agent screening.
Berberine (BBR) is an isoquinoline alkaloid isolated from roots and stem barks of the Berberis species that has been conventionally used in Chinese traditional medicine and Ayurveda medicine. Recently, various pharmacological properties of BBR have been reported including anti-parasitic, anti-hyperlipidemic, anti-inflammatory, and anti-cancer activities [15-19]. Several anti-tumor activities of BBR have been reported including anti-proliferation, inhibition of the G1 cell cycle progression, and induction of apoptosis [17-19]. Nevertheless, the information regarding BBR effects on CCA is limited [20]. Searching published literature, it seems that the effect of BBR on CCA has never been demonstrated in vivo. Thus, the effects of BBR on CCA in vivo were evaluated using this newly developed hamster model.
MATERIALS AND METHODS
Establishment of an O. viverrini-associated hamster CCA cell line
Hamsters were housed and monitored in the animal research facility according to the National Committee of Animal Ethics guidelines. All experimental protocols were approved by the Animal Ethics Committee of the Faculty of Medicine, Khon Kaen University, Thailand (ethical clearance no. AEKKU 08/2554 and AEKKU 34/2555). All cell culture reagents were purchased
from Gibco (Grand Island, New York, USA)
CCA was induced in hamsters using O. viverrini-infection and N-nitrosodimethylamine as previously described [5-7]. Briefly, 4-5 week old male Syrian golden hamsters were given 50 metacercariae of O. viverrini by gastric intubation and also were given 12.5 ppm N-nitrosodimethylamine in drinking water ad libitum. Hamsters were euthanized 6 months after induction of CCA and the livers were collected. Hamster CCA tissues were isolated, washed twice with PBS and minced into small pieces in Dulbecco's Modified Essential Medium (DMEM) supplemented with 10% fetal bovine serum (FBS), 100 U/mL penicillin, and 100 µg/mL streptomycin. Then, the tissues were digested with 1,000 U/ml collagenase (Calbiochem, Billerica, Massachusetts, USA) and 0.1 mg/ml DNase I (Sigma-Aldrich, St. Louis, Missouri, USA) for 3 hr, and the digested tissues were filtered through 100 µm and 70 µm nylon meshes. The cell suspensions were plated onto rat tail collagen-coated plates (5 µg collagen/cm2, Gibco) containing DMEM supplemented with 10% FBS, 100 U/ml penicillin, and 100 µg/ml streptomycin, and the plates were cultured at 37℃ in a humidified 5% CO2 atmosphere. Tumor cells were separated from fibroblasts by partial trypsinization until tumor cells became homogenous. Tumor tissue from each hamster was separately prepared for a cell line. A hamster CCA cell line established was designated as Ham-1.
Chromosome analysis
Ham-1 was subjected to chromosomal analysis as described earlier [21]. Chromosomes were examined under a light microscope using an oil immersion objective lens (×1,000). The modal chromosome number was determined from more than 20 chromosome areas.
Ham-1 allograft hamster model and anti-tumor activity of BBR in vivo
To demonstrate the tumorigenic property of Ham-1 cells, 4-5 week old male Syrian golden hamsters (n=10) were divided into 2 groups (5/group) and injected intradermally with 2×10⁵ or 5×10⁵ cells of Ham-1 (2 sites/hamster). Tumors were checked twice a week. At 3 weeks after transplantation, hamsters were euthanized and tumor masses were collected, weighed, and fixed in 4% paraformaldehyde overnight for immunohistochemical studies.
Then, to test the anti-tumor effects of BBR, 5×10⁵ cells of Ham-1 were injected intradermally (2 sites/hamster) into 10 hamsters. Then, they were divided into 2 groups of 5 animals. BBR treatment was started on day 3 after tumor cell injections. BBR (10 mg/kg) (berberine chloride form, B3251, Sigma-Aldrich) in sterile water was given by oral gavage to 5 hamsters daily for 3 weeks. Another 5 tumor-bearing hamsters given sterile water by oral gavage served as controls. Hamsters were weighed twice a week. After 21 days of treatment, tumors were collected, weighed, and fixed in 4% paraformaldehyde. Paraffin-embedded tissues were processed as per the standard protocol, and sections of 5-7 µm thickness were prepared. Some tumor tissue sections were stained with hematoxylin and eosin and observed under a light microscope (×100).
Immunohistochemistry analysis
CCA marker (cytokeratin-19; CK19), proliferative index (proliferating cell nuclear antigen; PCNA) and cell cycle control proteins (cyclin D1 and cyclin E) in hamster CCA tissues were determined using standard immunohistochemistry procedures. Briefly, after de-waxing tissue sections, the antigens were retrieved using 10 mM citrate buffer pH 6.0. Then, endogenous peroxidase activity was blocked by incubating with 0.3% H2O2 solution in methanol for 30 min followed by blocking non-specific binding by incubation in 5% FBS for 20 min at room temperature. Tissue sections were incubated with primary antibodies in a moist chamber at room temperature overnight and then with corresponding secondary antibody for 1 hr at room temperature. Immunoreactivity was detected with diaminobenzidine tetrahydrochloride (Sigma-Aldrich) and 0.1% H2O2 in 50 mM Tris-HCl pH 7.8. Immunostained tissues were blindly evaluated by 2 assessors. Semi-quantitative analysis of 4 randomly selected areas from each tissue was performed according to the frequency (%) of immuno-positive tumor cells. The results were expressed as an immunohistochemistry score (IHC score); 0=<10%; 1=10-25%; 2=26-50%; 3=51-75%; 4=>75%.
Sources of antibodies were as follows: anti-PCNA was obtained from Leica Biosystems (Newcastle, UK), anti-CK-19 and anti-α-smooth muscle actin were from Abcam (Cambridge, UK), anti-cyclin D1 and anti-cyclin E were from Santa Cruz Biotechnology (Heidelberg, Germany) and goat anti-rabbit IgG-HRP was from Zymed Laboratories (South San Francisco, California, USA).
Tetrazolium dye methylthiotetrazole assay
Anti-proliferative effects of BBR were determined in vitro using 3-[4,5-dimethylthiazole]-2,5-diphenyltetrazolium bromide (MTT) (Invitrogen, Carlsbad, California, USA). In brief, 6.5×10³ Ham-1 cells were seeded in a 96-well plate overnight. Various concentrations of BBR were then added (triplicate wells/concentration), and the plates were incubated for 24 or 48 hr. Later, MTT was added to obtain a final concentration of 0.5 mg/ml, and the plates were incubated for 3 hr at 37℃. To solubilize the formazan crystals, 0.04 N HCl in isopropanol was added. Absorption at 540 nm was determined using an ELISA reader (TECAN Sunrise, Mannedorf, Switzerland). OD540 of BBR-treated samples were normalized by those of samples without BBR and presented as percent (%) cell viability.
Cell cycle analysis
The inhibitory effects of BBR on cell cycle progression were assessed using flow cytometry. After incubation of the cells with 0, 2.5, 12.5, and 25 µM BBR (duplicate samples/concentration) for 24 hr or 48 hr, cells were detached and fixed in 70% cold ethanol in PBS at 4℃ overnight. After that, the pellets were washed with cold PBS and incubated with propidium iodide (10 µg/ml final concentration) in the dark, then filtered through 70 µm nylon meshes. The cell cycle distributions were determined using flow cytometry. DNA histograms were analyzed using FlowJo software (Tree Star, San Jose, California, USA).
RESULTS
Ham-1 morphology and chromosome analyses
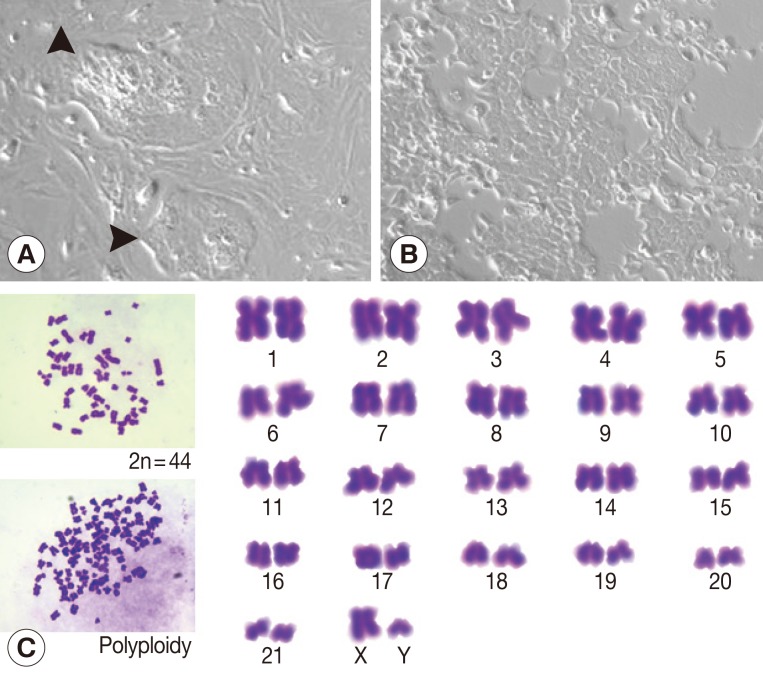
At week 1 after a primary culture, colonies of epithelial-like cells surrounded by spindle-shaped fibroblasts were observed (Fig. 1A). Fibroblasts were removed by partial trypsinization. At the 15th passage, a homogenous culture cell line was established (Fig. 1B). Ham-1 cells were successfully maintained under standard cell culture conditions for more than 30 passages over 6 months. Ham-1 cells exhibited a monotonous polygonal shape with a high nuclear to cytoplasmic ratio and high granularity in the nucleus and cytoplasm. The chromosome study revealed a modal chromosome number of 44 in the diploid mitotic metaphase (2n=44) with representative XY chromosomes. Fewer than 10% of cells were polyploid (Fig. 1C).
Ham-1 allograft transplantation
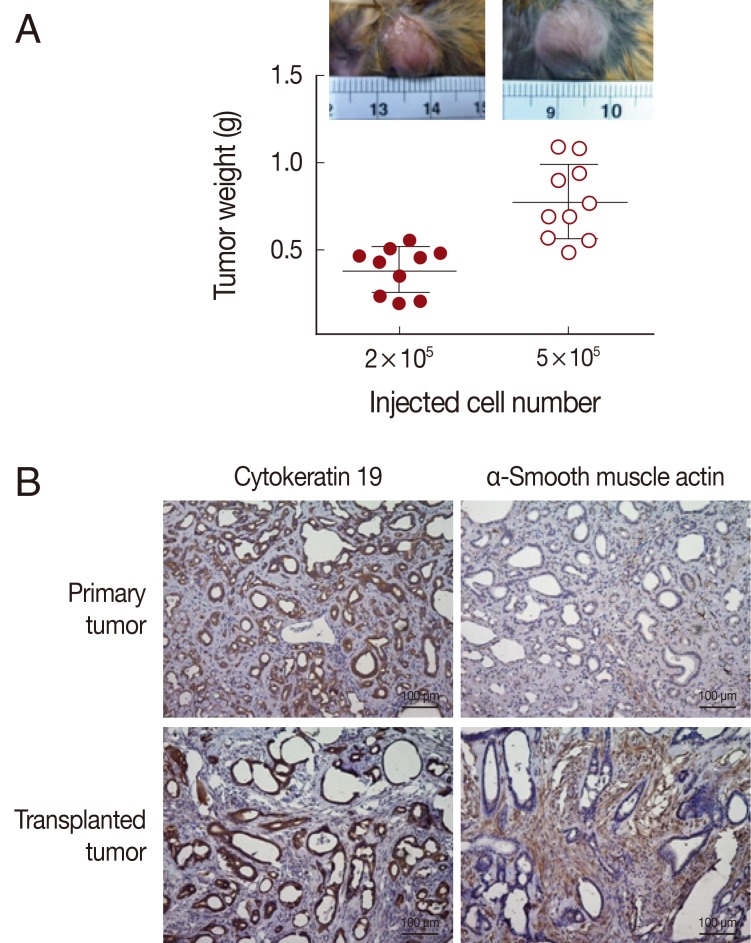
Tumorigenicity of the Ham-1 cell line was demonstrated by allograft transplantation in hamsters. Each hamster was intradermally injected either with 2×10⁵ cells or 5×10⁵ cells into the dorsal skin (5 animals for each dose, 2 sites/hamster). Tumor masses were observed in all injected sites at week 1 after transplantation. At week 3, the greatest diameters of 1.0 cm and 1.5 cm were observed in groups injected with 2×10⁵ cells and 5×10⁵ cells, respectively (Fig. 2A, small insets). Tumors were weighed, and the tumor weights were correlated with the initial injected cell numbers (Fig. 2A). Tumor masses were histologically assessed. Transplanted tumors exhibited well-differentiated glandular structure similar to the primary CCA in the hamster liver. The cholangiocyte origin of the Ham-1 allograft tumors was confirmed by CK-19-positive and α-smooth muscle actin-negative immunostaining patterns of tumor cells surrounded by strongly positive α-smooth muscle actin stromal cells, comparable to the original tumor (Fig. 2B).
Effects of BBR on Ham-1 cells in vitro and in vivo
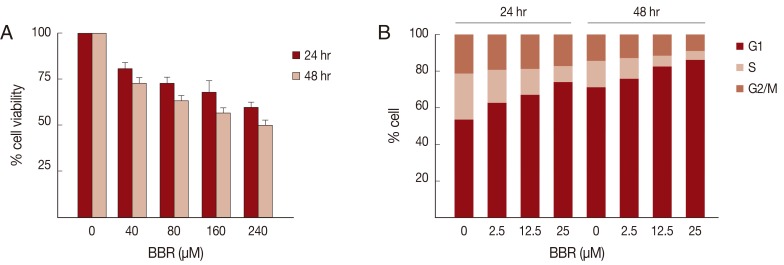
To evaluate the usefulness of the Ham-1 cell line and allograft transplantation model for the evaluation of anti-cancer treatment, an isoquinoline alkaloid; BBR, was selected as an anti-cancer agent in this study. Ham-1 cells were incubated with various concentrations (0-240 µM) of BBR for 24 and 48 hr, and Ham-1 proliferation was measured by the MTT assay. As shown in Fig. 3A, BBR inhibited Ham-1 cell proliferation in a dose- and time-dependent manner; however, the IC50 of BBR on Ham-1 cell line was over 240 µM at 24 and 48 hr. Cell cycle distribution analyzed by flow cytometry indicated that the anti-proliferative effect of BBR on Ham-1 cells was mainly through an induction of cell cycle arrest at the G1 phase (Fig. 3B).
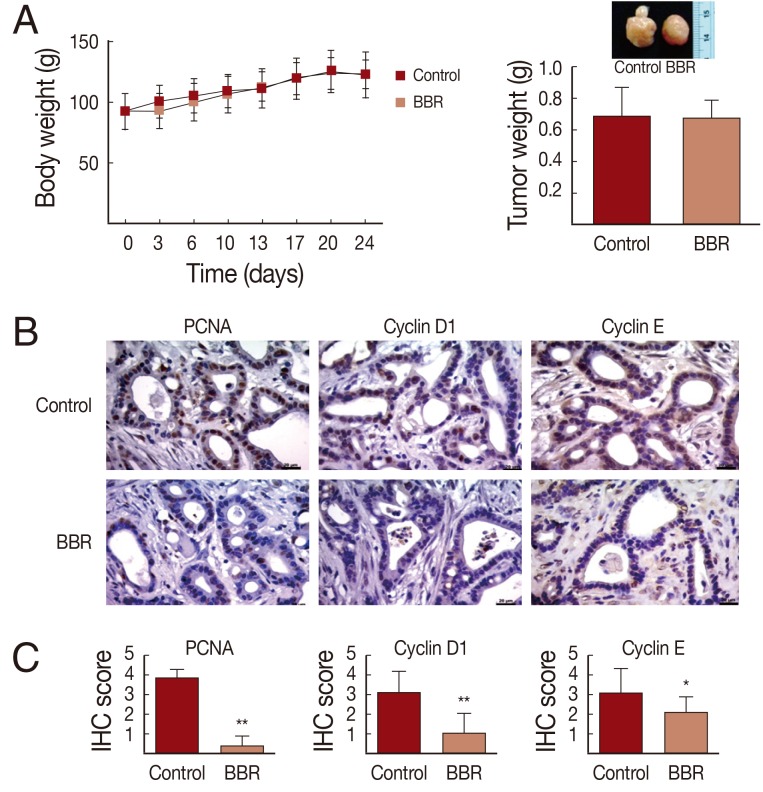
Anti-tumor effects of BBR were assessed in the hamster allograft model. Syrian golden hamsters were injected intradermally with Ham-1 and were divided into 2 groups (5/group). BBR at 10 mg/kg was given to the treatment groups by oral gavage daily for 3 weeks. Drinking water was administered in the same way to control hamsters. Based on the scheduled treatment, BBR had no effects on body weight as the BBR-treated hamsters were healthy and gained weight comparable to the control hamsters (Fig. 4A). No side effects were observed during the course of treatment. As demonstrated in Fig. 4B, tumor weights in BBR-treated groups were not different from those of the control group at the end of the experiment. However, the immunohistochemistry staining of proliferative index (PCNA) and the G1 to S cell cycle control proteins (cyclin D1 and cyclin E) showed BBR treatment suppressed the expression of all proteins when compared to the controls. Semi-quantitative analyses using the IHC scores of PCNA in BBR treated tumor tissues compared with controls were 0.38±0.50 vs 3.83±0.39 (P<0.001); for cyclin D1, corresponding values were 1.06±1.00 vs 3.14±1.04 (P<0.001) and cyclin E were 2.13±0.81 vs 3.11±1.23 (P<0.05).
DISCUSSION
O. viverrini infection is a well-documented risk factor for CCA, especially in northeastern Thailand. Advanced stage CCA is relatively resistant to currently available adjunct treatments. Thus, searching for novel treatments is urgently needed. A hamster carcinogenesis model of CCA was previously developed and demonstrated molecular mimicry with the human CCA. In this study, we established a hamster O. viverrini-associated CCA cell line named Ham-1. The tumorigenicity of Ham-1 was validated by intradermal allograft transplantation. Transplanted tissues possessed well-formed gland-like structure with retained bile duct marker, CK-19. The advantage of the newly developed comparative CCA model was demonstrated by analysis of BBR treatment. Altogether, the allo-transplantable hamster CCA cell line for anti-cancer testing was developed in the current study. This O. viverrini-associated hamster cell line model might be useful for the complete evaluation of CCA treatment in vitro and in vivo.
The Ham-1 CCA cell line developed in the current study is similar to the previously described HaLCCA-1.1 cell line [22,23]. Ham-1 cells are polygonal in shape, similar to HaLCCA-1.1. The population doubling times of these cell lines are comparable (36 hr in Ham-1 vs 31 hr in HaLCCA-1.1, data not shown). The chromosome analysis of the hamster CCA cell line has never been reported. Ham-1 retains diploidy. The Ham-1 cell line is highly tumorigenic. With initial cell numbers of 2×10⁵, it efficiently formed a tumor mass in the hamster skin and was detectable within a week. This model was superior to the previously reported model [22,23] since the current model requires injection of fewer cells (2-5×10⁵ cells in the current model vs 5×10⁶ cells in the other model) and shorter time (3 weeks in this model vs 4 weeks in the other model) but with comparable tumor sizes. This might be due to the use of the intradermal route in this study vs subcutaneous injections in others.
The benefit of the Ham-1 model on anti-tumor activity testing was demonstrated by analysis of BBR treatment. This compound has been previously reported to inhibit proliferation, inducing G1 arrest and promoting apoptosis of human CCA cells (QBC939 cell line) [20]. The in vivo effect of BBR, however, has never been tested. In the present study, BBR could inhibit Ham-1 cell proliferation in vitro, but the effect was not impressive. The partial growth-inhibitory effect of BBR on Ham-1 was confirmed by the in vivo model. This ineffectiveness of BBR in the Ham-1 cell line compared to the QBC939 cell line might be due to the different etiologies of both cell lines [20]. It was previously reported that O. viverrini-associated CCA possessed a distinct gene expression profile when compared to non-O. viverrini-associated CCA [24]; genes involved in xenobiotic metabolism, such as UGT2B11 and UGT1A10, were substantially increased in O. viverrini-associated CCA while increases of genes in growth factor signaling, such as TGFBI, PGF, and IGFBP1, were observed in non-O. viverrini-associated CCA. Even though the growth inhibitory effects of BBR on Ham-1 proliferation in vitro and in vivo were weak, BBR could effectively inhibit G1 to S phase cell cycle progression in Ham-1 cells, which is comparable to those in QBC939 [20]. G1 phase cell cycle arrest is mainly due to the inhibition of nuclear cyclin D1 and cyclin E accumulations in tumor cells demonstrated by immunohistochemical staining. Similar results were reported in a prostate cancer and the human CCA cell line; QBC939 [19,20].
Taken together, the hamster CCA cell line and allograft transplantation model were established herein. This model is fast, efficient, and rather inexpensive when compared to the other in vivo CCA models. It might be a suitable system for anti-cancer agent screening.