

INTRODUCTION
Malaria is a major global infectious disease, affecting 250 million people and causing approximately 1 million deaths each year [1]. Malarial infection leads to respiratory distress, metabolic acidosis, hypoglycemia, renal failure, and multi-organ failure involving the liver, kidney, and spleen [2,3]. The most severe complication of malaria is cerebral malaria caused by Plasmodium falciparum. This complication is related to the isolation of parasitized red blood cells in the brain microvasculature and an ensuing interaction between endothelial cells and knobs in red blood cells. P. falciparum infection can activate the proangiogenic vascular endothelial growth factor (VEGF) signaling cascade in patients with cerebral malaria. Activation of this signaling cascade may be directly induced by brain hypoxia [4]. Related to this, increased levels of VEGF have been shown in the placentas of women with placental malaria [5].
Rodent malaria, Plasmodium berghei, is of great interest in that rodents comprise practical models for experimental research relating to human malaria. P. berghei is similar to P. falciparum in aspects of structure, genome organization, physiology, and life cycle. P. berghei infection activates systemic inflammation and hypoxia following blood vessel obstruction, leading to endothelial damage [6]. P. berghei infection in mice successfully imitates many characteristic features of human cerebral malaria [7]. Therefore, the P. berghei-infected mouse model should improve our understanding of severe malaria [8,9].
Angiogenesis plays an essential physiological role, such as formation and maintenance of blood vessels, but also in various pathological conditions from tumor growth to wound healing [10]. VEGF gene expression is induced by stressors such as hypoxia, anemia, myocardial ischemia, and tumor initiated subsequent angiogenesis and neovascularization [11,12]. VEGF expression is induced through the binding of hypoxia-induced factor-1 (HIF1) to the hypoxia response element (HRE) located on upstream region of the VEGF gene [13]. HIF1 participates in every step of angiogenesis. Interactions between HIF1 and proangiogenic factors are fundamental to capillary formation under hypoxia. Similarly, every step of the vessel formation cascade is supported by HIF1 [10].
Pathophysiological significance of hypoxia in malarial infection has been investigated in mice infected with Plasmodium berghei through measuring the oxygen affinity of whole blood [14]. Therefore, hypoxia due to malarial infection may increase the stability of HIF1α and HIF1α is likely to induce VEGF expression sequentially. Actually, several studies reported VEGF was markedly induced by malarial infection [15,16]. However, there are no studies to show hypoxic conditions and expression patterns of HIF1α and VEGF proteins of each organs caused by malarial infection. Furthermore, no study has been done to determine whether elevated VEGF expression actually induces angiogenesis in infected organs.
In this study, we investigated hypoxic conditions in various tissues of P. berghei-infected mice. The expression of hypoxia-induced angiogenic proteins (VEGF and HIF1α) was also analyzed in tissues with varying levels of parasitemia (0%, 10%, or 30%) by Western blot and immunofluorescence staining. In addition, we determined the number of vessels in each tissue by immunohistochemical staining of CD31 (a major blood vessel marker) to verify angiogenic induction during malarial infection.
MATERIALS AND METHODS
Experimental design
Female C57BL/6 mice at the age of 8 weeks were purchased from KOATECH (Pyeongtaek, Korea) and were bred at the Institute for Laboratory Animals of Kosin University College of Medicine. The P. berghei ANKA strain was originally obtained from the Department of Parasitology and Tropical Medicine, Kyungpook National University School of Medicine, Republic of Korea. The parasite was maintained at Kosin University College of Medicine by passage in C57BL/6 mice and by frozen stock. Serial passage of P. berghei was initiated after storage at −70°C by intra-peritoneal (i.p.) injection of 0.2 ml blood containing parasites into mice. Subsequent passages for maintaining the parasites were carried out by i.p. inoculation of normal mice with 0.2 ml blood diluted to contain 1×10⁶ parasitized red blood cells from a donor mouse.
Parasitemia measurement
A drop of blood was collected from each mouse by venesection of the tail and transferred onto the edge of a microscope slide. The blood was evenly spread across the slide to make a thin-film blood smear, which was allowed to dry before staining with Giemsa stain. Slides were viewed using light microscopy with oil immersion (1,000×magnification). Four fields of approximately 200 cells each were counted, and parasitemia was calculated as the percentage of infected red blood cells in total blood cells.
Western blot analysis
To evaluate the protein expression levels of HIF1α and VEGF in malaria-infected tissues, Western blot analysis was conducted as previously described [17]. Briefly, the samples were homogenized using a sterile glass homogenizer. The homogenized tissues were lysed using PRO PREP protein extraction solution (Intron Biotechnology, Seongnam, Korea). Protein extracts (30 μg) of various tissues from the control and infected (10% or 30% parasitemia) groups were electrophoresed with a Novex 4–12% Bis-Tris gel (Invitrogen, Carlsbad, California, USA) and transferred to nitrocellulose membranes (Thermo Fisher Scientific, Waltham, Massachusetts, USA). The membranes were pre-incubated for 2 hr in Tris-buffered saline (TBS) containing 5% skim milk and 0.05% Tween 20 (TBS-T). The membranes were incubated overnight at 4°C in TBS-T containing antibodies against GAPDH (1:5,000, Abcam, Cambridge, UK), HIF1α (1:1,000, Novus Biologicals, Littleton, Colorado, USA), or VEGF (1:1,000, Abcam). Each membrane was washed 5 times with TBS-T and then incubated with a secondary antibody (GAPDH and HIF1α: anti-mouse; VEGF: anti-rabbit) for 1 hr at room temperature. The membranes were again washed 5 times with TBS-T, and detected with an enhanced chemiluminescence detection kit (Amersham Pharmacia Biotech, Piscataway, New Jersey, USA). Quantification of each protein expression was calculated by band densities by image analysis software (Image J, NIH, Bethesda, Maryland, USA) and normalized using the average value for GAPDH.
Immunofluorescence analysis
Immunofluorescence was as previously described [18] and briefly described below. Paraffin-embedded tissue sections were incubated in PBS containing 2% FBS (for blocking) for 20 min and then incubated with antibody against VEGF (1: 100, Abcam) overnight at 4°C. Samples were washed 5 times in PBS solution and incubated with secondary antibody (Alexa Fluor 488 anti-rabbit, Thermo Fisher Scientific) for 1 hr. Cellular nuclei were counterstained with QnuclearTM Deep Red stain solution (Invitrogen) in PBS.
Hypoxia assessment
The hypoxia marker pimonidazole hydrochloride (HypoxyprobeTM-1) and mouse monoclonal antibodies were supplied by NPI, Inc. (Belmont, Massachusetts, USA). Slides were permeabilized by incubation in PBS containing 0.1% Triton X-100 for 5 min and treated with 10% normal serum in PBS for 1 hr for blocking of the nonspecific antibody binding. Slides were then incubated with a mixture of mouse anti-HIF1α monoclonal antibody (1:100, Novus Biologicals), and rabbit anti-pimonidazole polyclonal antibody (1:100, NPI Inc.) at 4°C overnight. After primary antibody treatment, slides were washed 3 times in PBS for 5 min and incubated with secondary antibodies (Alexa Fluor 546 anti-mouse and Alexa Fluor 488 anti-rabbit antibody; Invitrogen) for 1 hr. The slides were observed for epifluorescence with a confocal laser-scanning microscope.
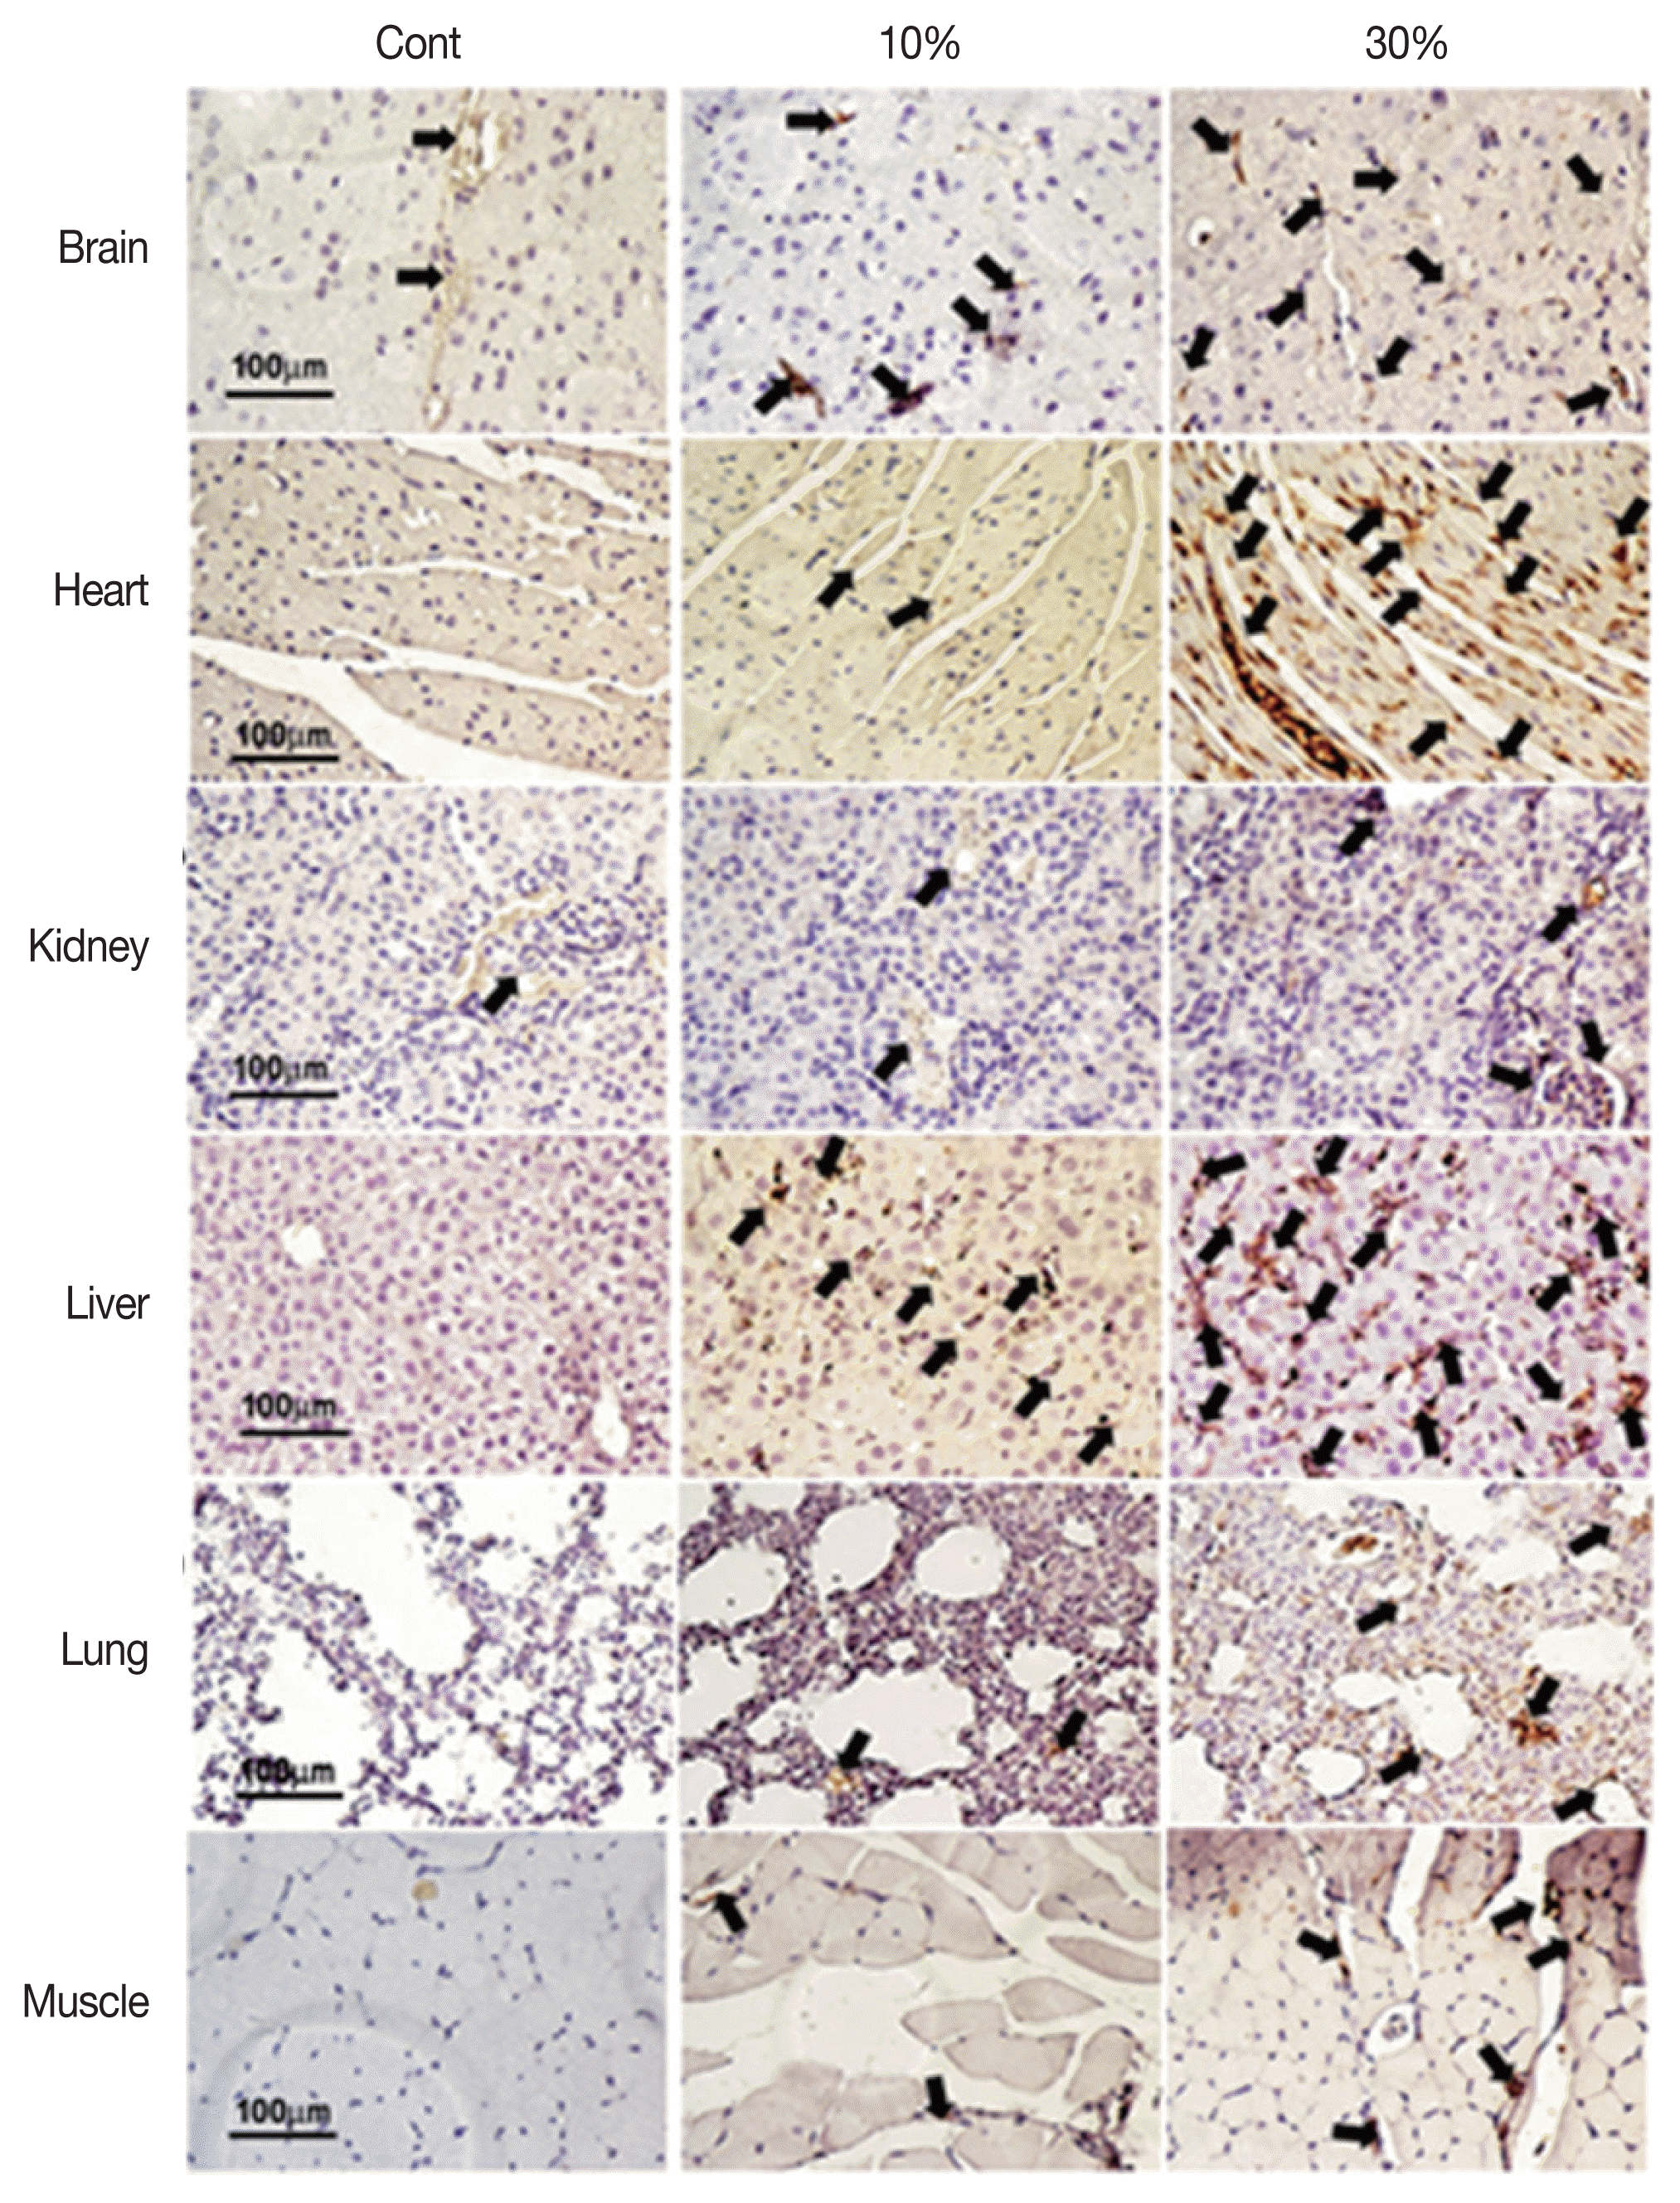
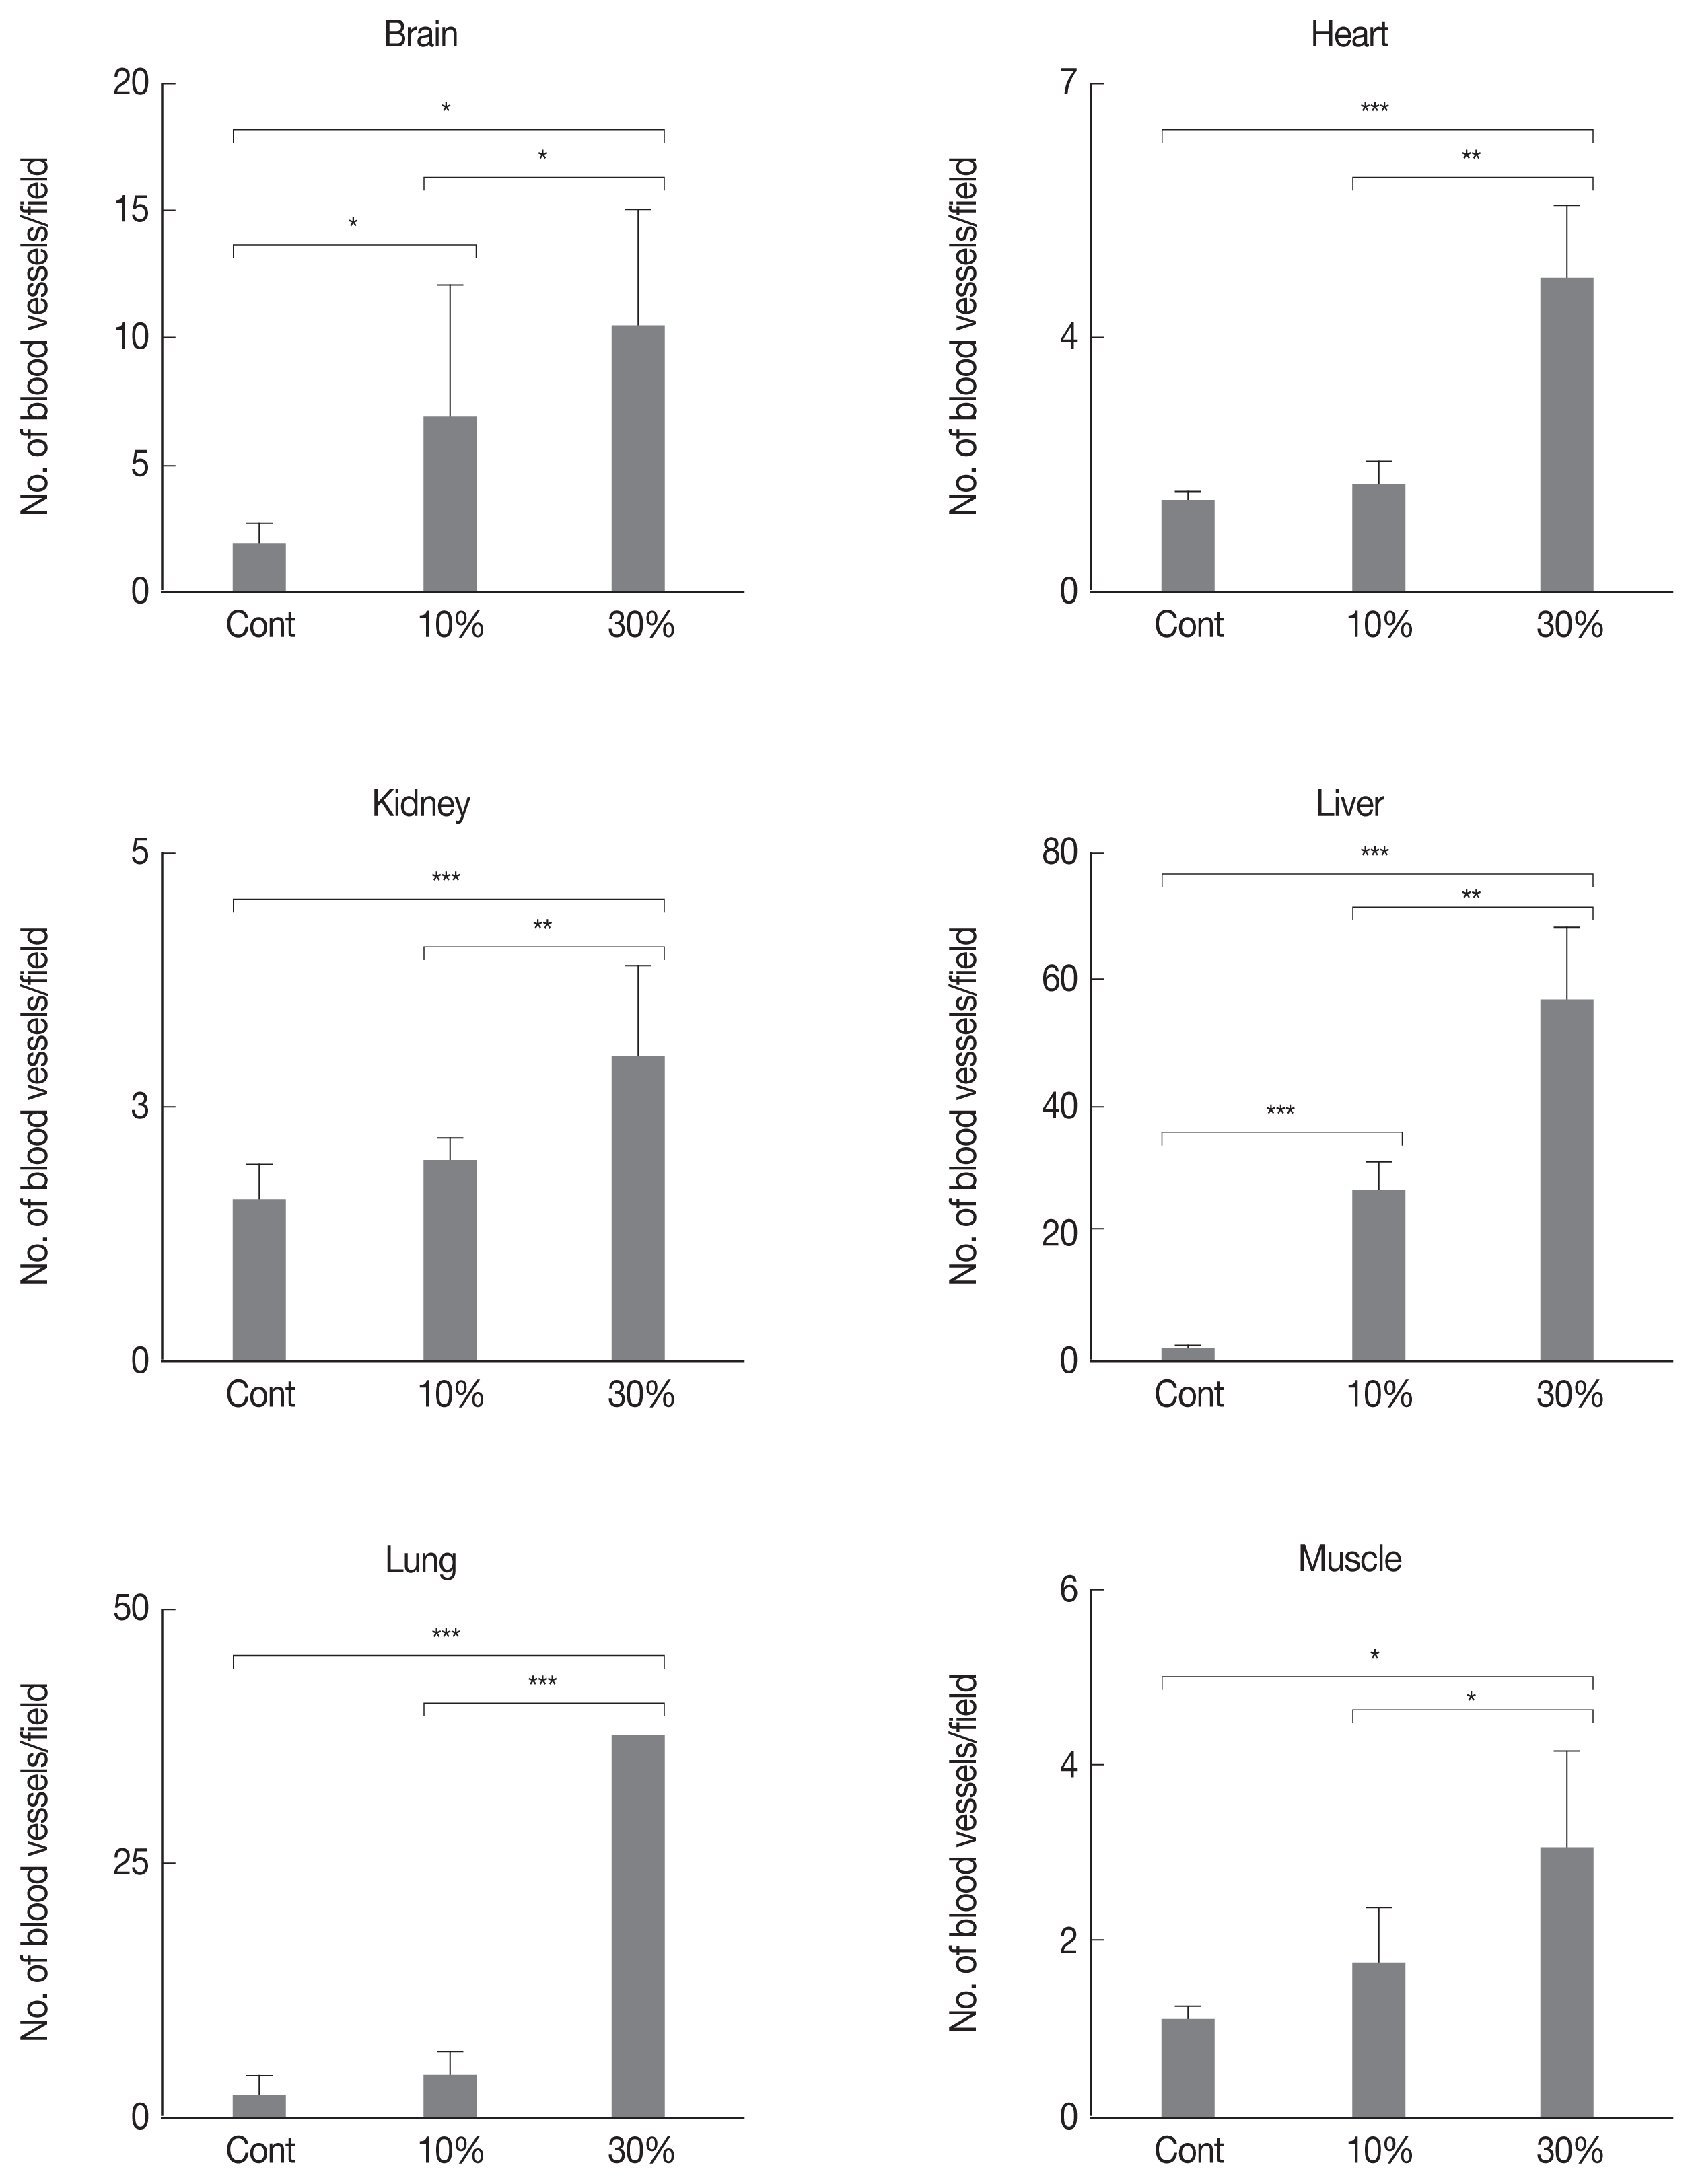
Immunostaining and vessel counting
CD31 staining for vessel counting was conducted as previously described [19]. Sections were incubated in PBS containing 2% FBS (for blocking) for 20 min and then incubated with antibody against CD31 (1:40, Dako, Carpinteria, California, USA) overnight at 4°C. Anti-mouse and anti-rabbit secondary antibodies were detected with an HRP kit (Dako). Slides were also stained with hematoxylin and eosin for histopathological analysis. The number of blood vessels was counted in 6 fields per 3 randomly chosen sections under microscopy (×200).
Statistical analysis
Statistical analysis was performed using SPSS (Version 25.0; IBM Corp., Armonk, New York, USA) software. One-way ANOVA and Bonferroni’s post hoc test were conducted for comparison among groups of western blot and IHC. Pearson’s correlation analysis was performed to analyze the correlation between HIF1α and VEGF. The results were considered statistically significant less than P<0.05.
RESULTS
Parasitemia progression
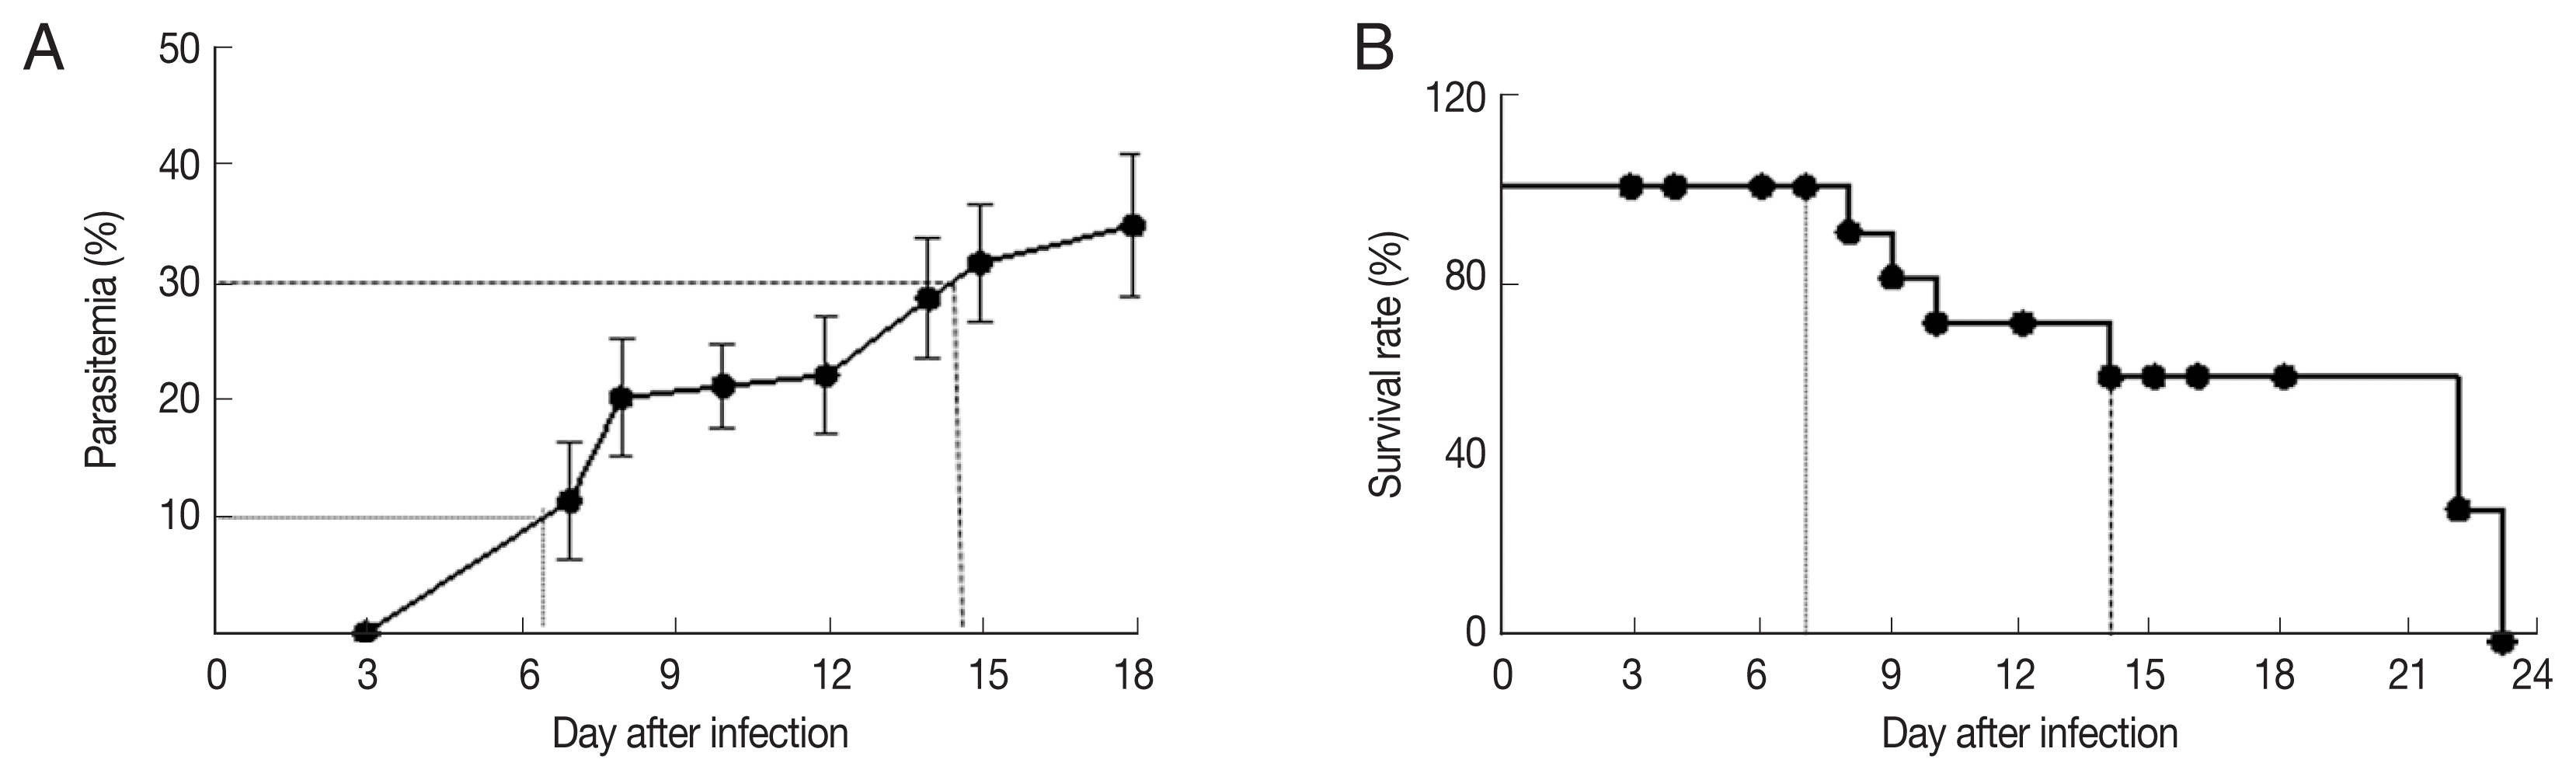
Parasitemia was reported as the percentage of parasitized red blood cells among all red blood cells counted. In malaria-infected mice, parasitemia was increased over the duration of infection and peaked 18 days after infection (Fig. 1A). At 8-day post-infection, 0% mortality and 12.9% parasitemia (95% confidence interval [CI]=10.4% to 15.4%) and were recorded. At 14 days, approximately 23% mortality and 20% parasitemia (95% CI=14.5% to 25.6%) were recorded. At 24 days, 100% mortality was observed (Fig. 1B). We selected experimental time points to coincide with 0%, 10%, and 30% parasitemia for further studies.
Expression of hypoxia-related proteins
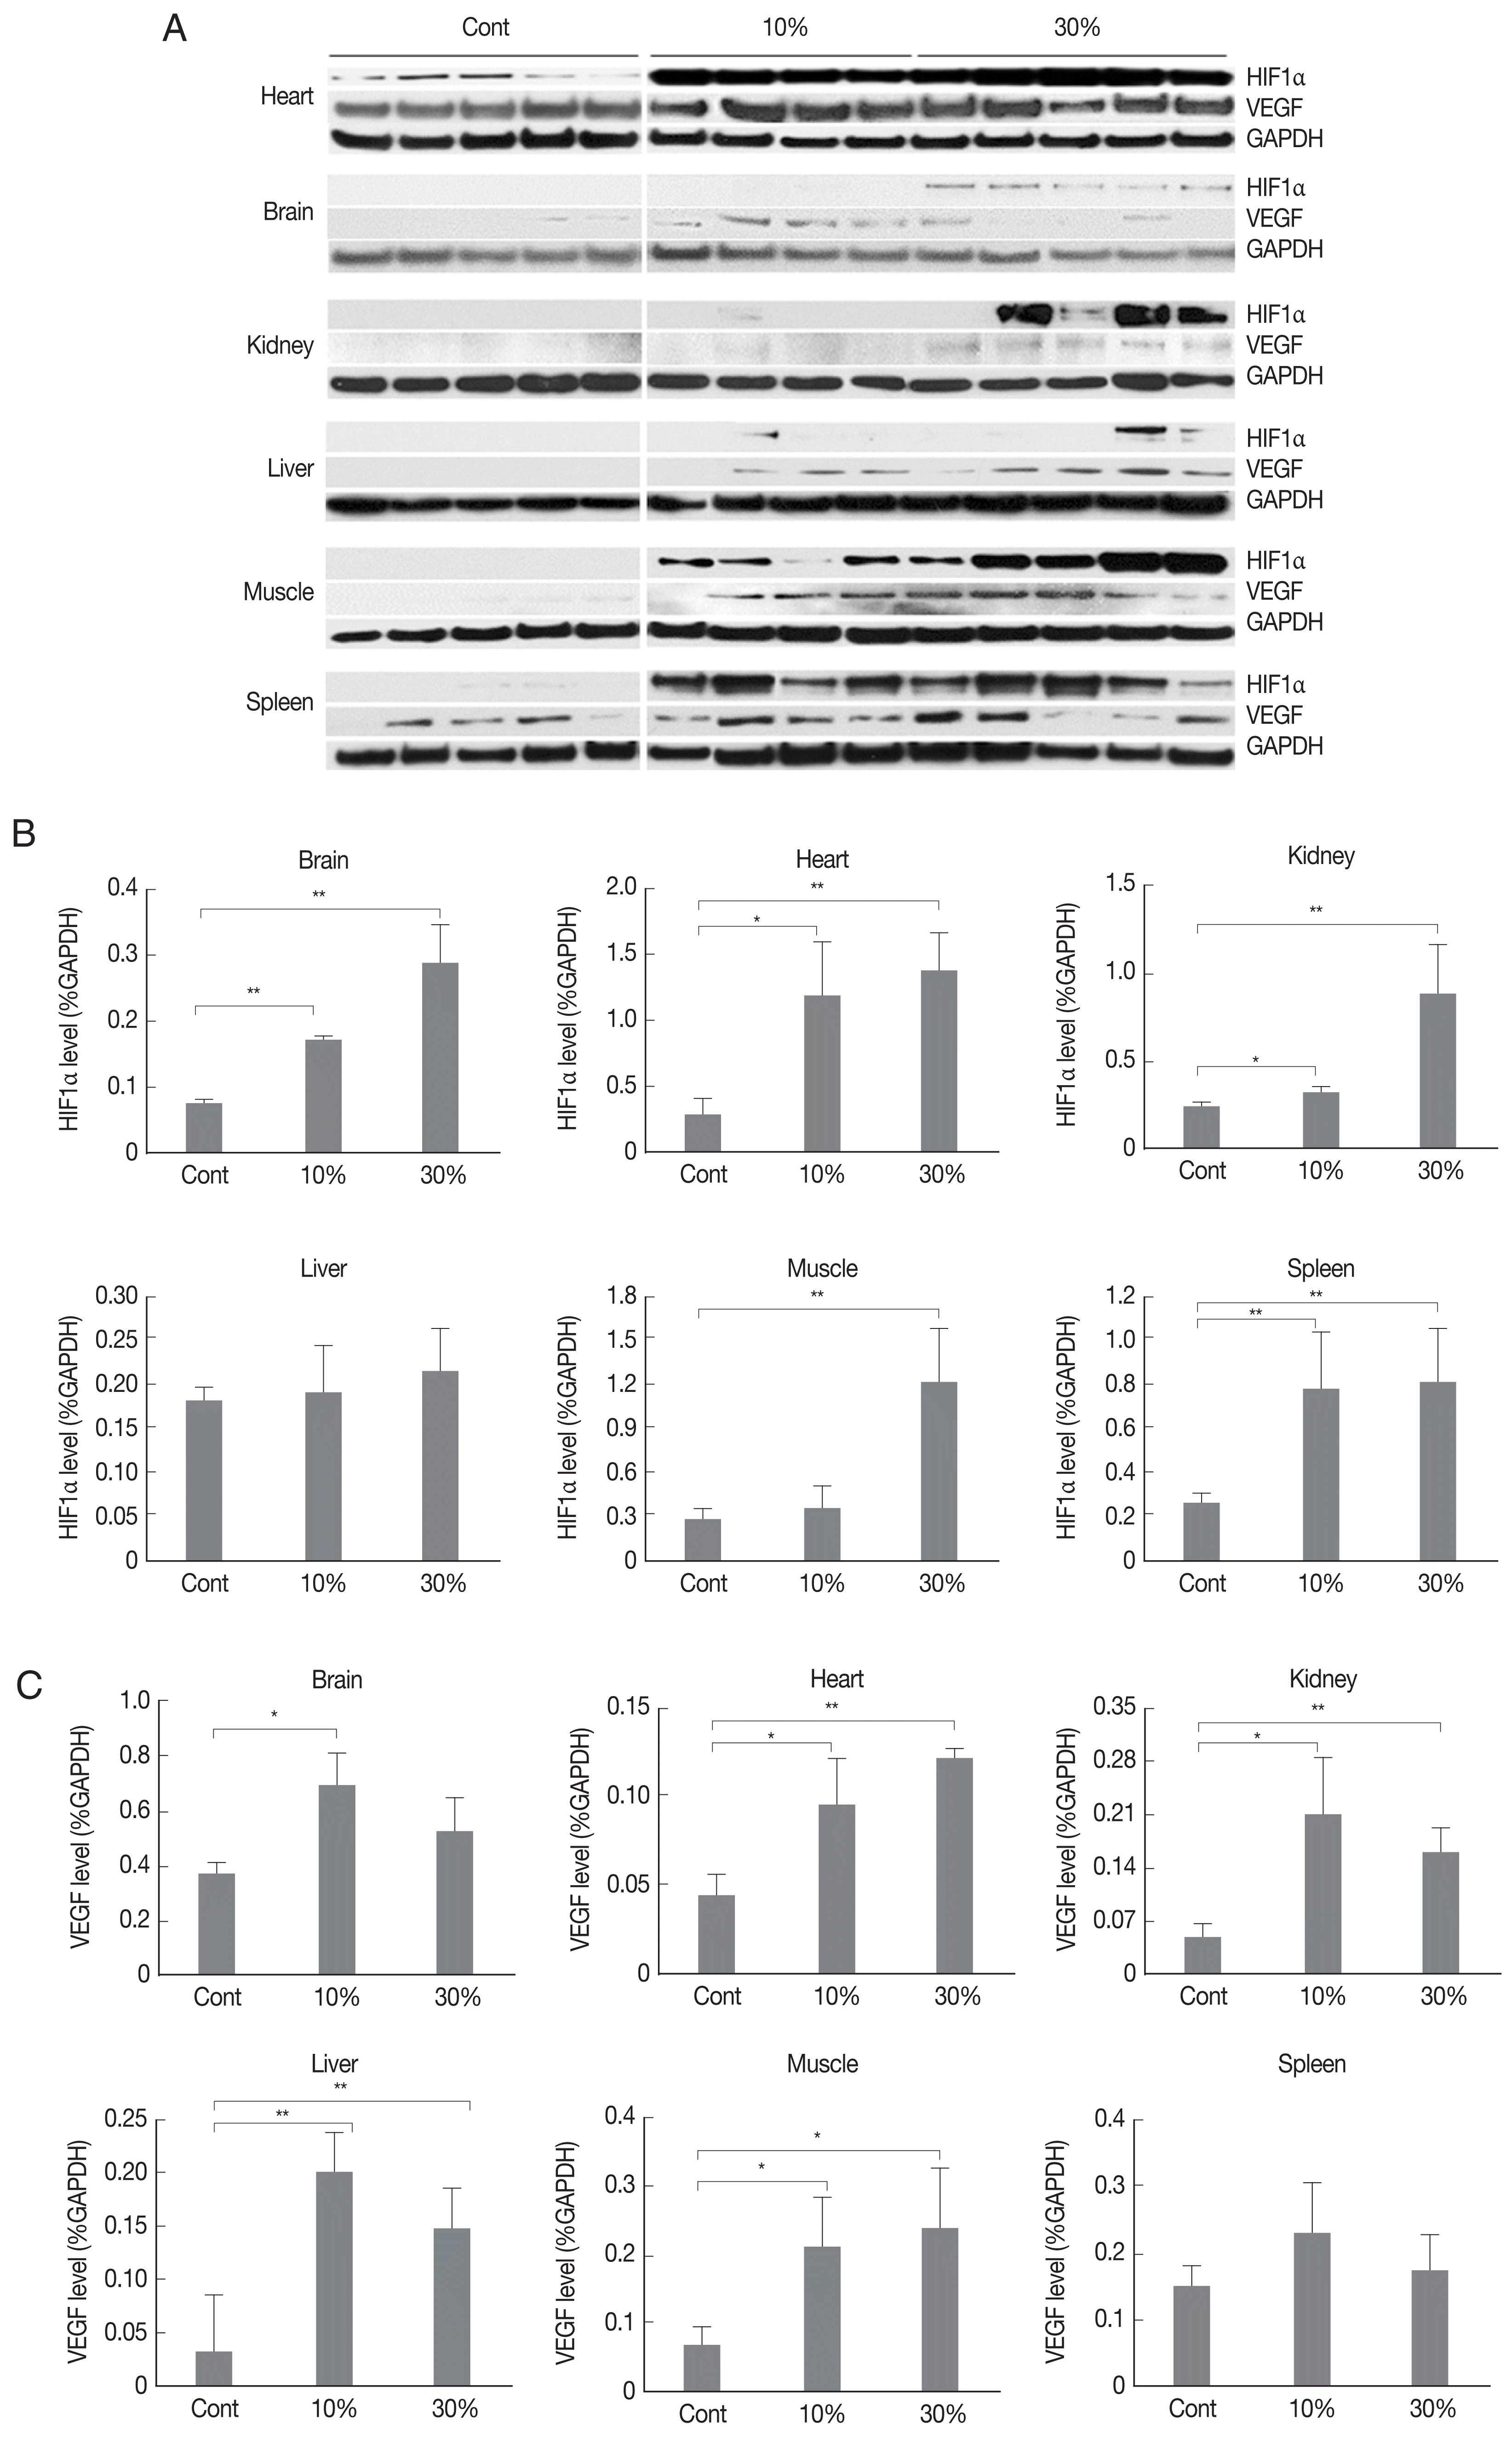
We examined the expression of HIF1α and VEGF at 0%, 10%, and 30% parasitemia in various tissues. A Western blot analysis showed that HIF1α protein expression was significantly increased in the brain, heart, kidney, muscle, and spleen (Fig. 2). In comparing levels of parasitemia, HIF1α expression was generally higher in tissues with 30% parasitemia than in tissues with 10% parasitemia. This suggests that HIF1α expression is up-regulated by parasitemia. Similarly, VEGF protein level was meaningfully up-regulated in brain, heart, kidney, liver, and muscle tissues from an early stage of infection (Fig. 2). However, HIF1α and VEGF expressions were changed significantly in certain tissue types. The expression of HIF1α was very low in liver and the expression of VEGF was not changed in spleen of malarial infected mice, respectively.
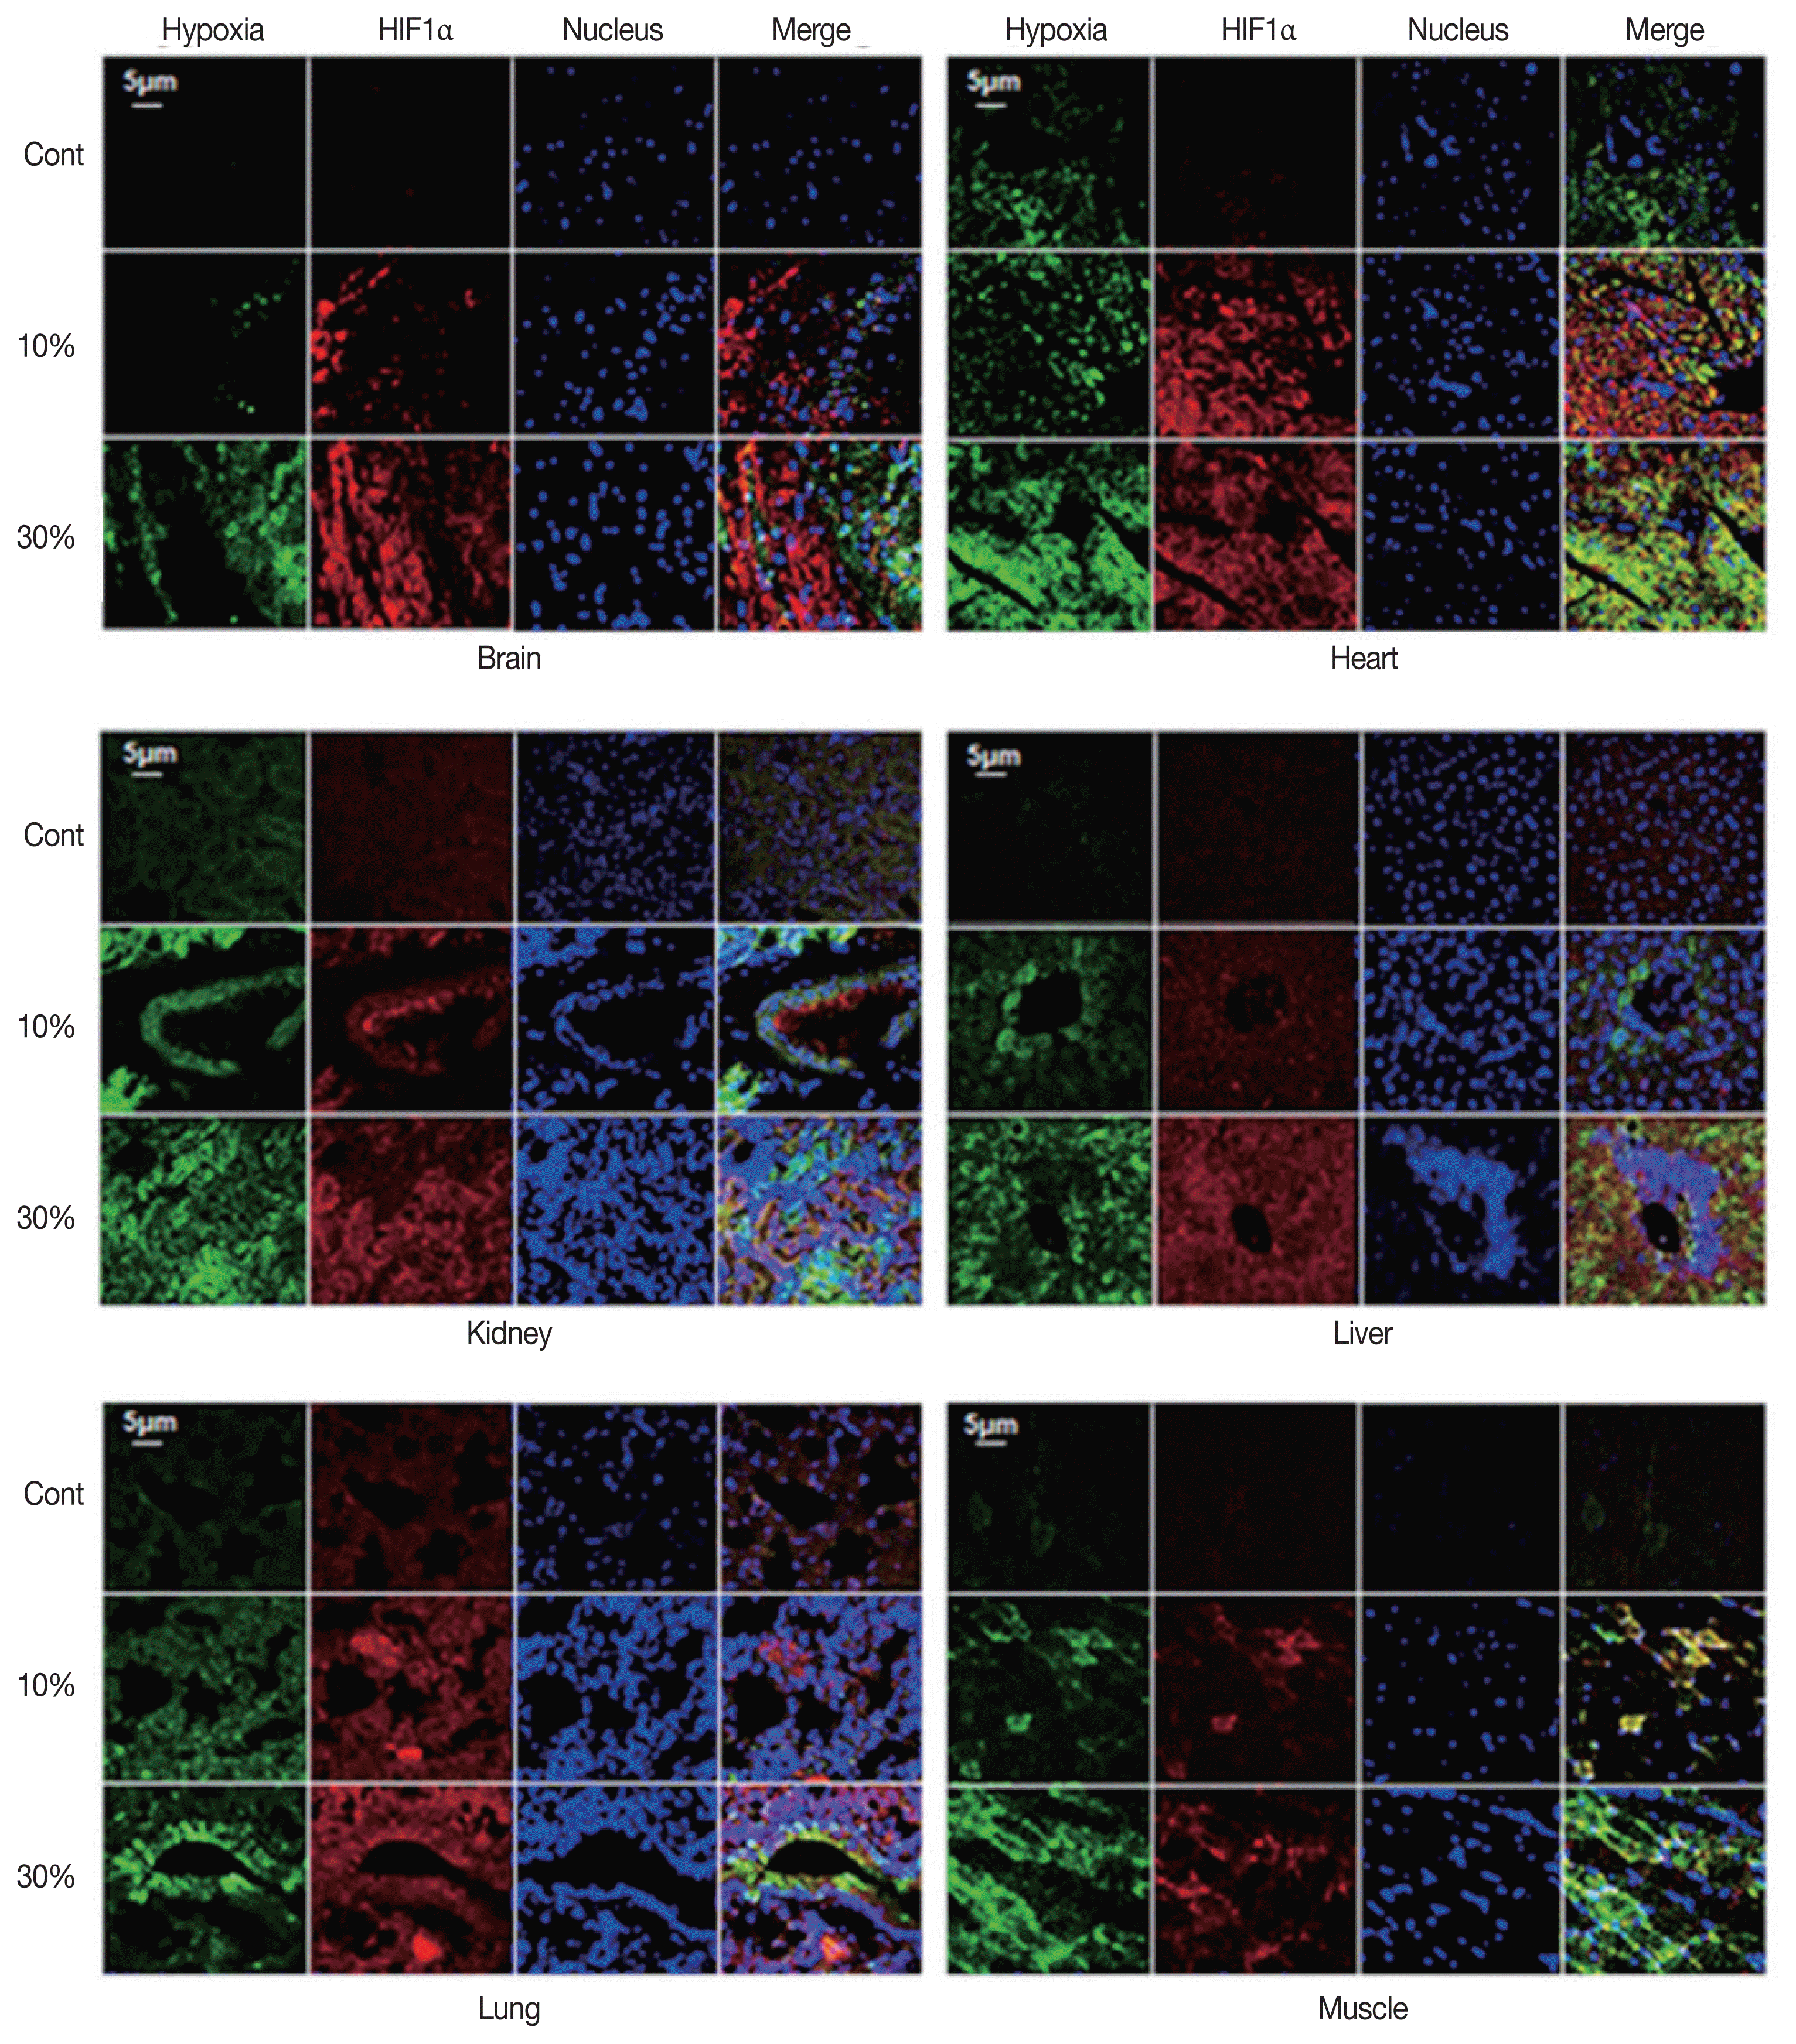
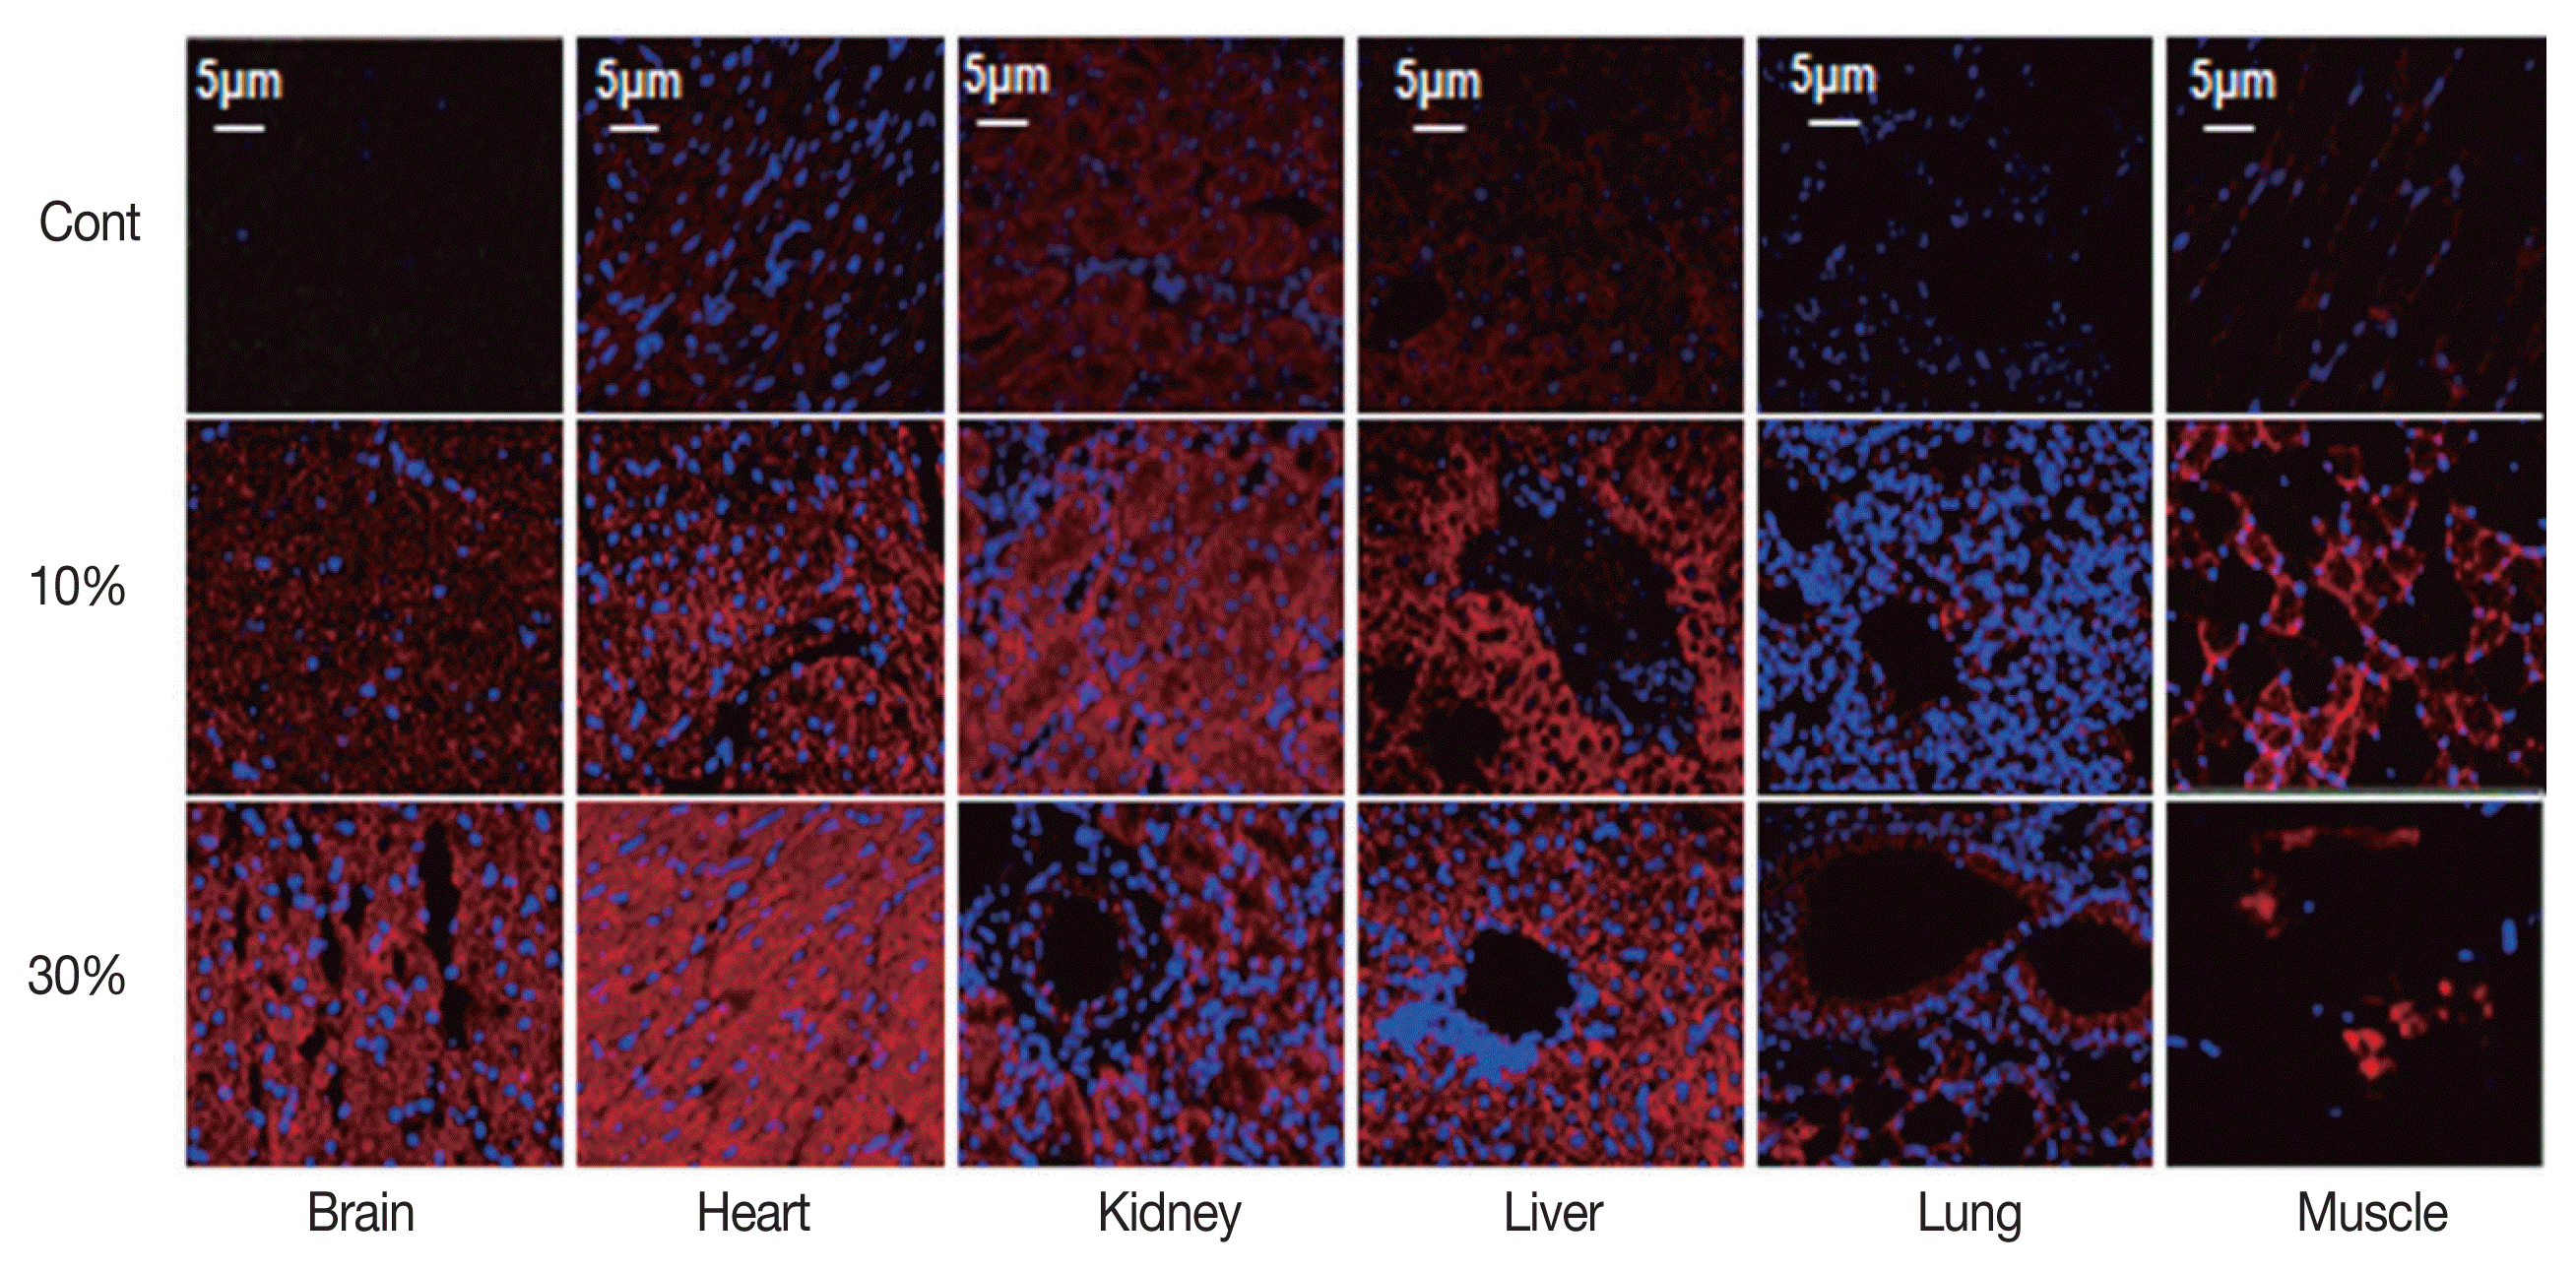
To identify whether hypoxia occurred in malaria-infected tissues and to explore the relationship between hypoxia and HIF1α protein expression, we double-stained malaria-infected tissues with a marker for hypoxia and an anti-HIF1α antibody. As shown in Fig. 3, both hypoxia and HIF1α protein expression were significantly increased with parasitemia. HIF1α proteins generally co-localized with hypoxic regions, but there were some exceptions. VEGF protein level in malaria-infected tissues was also identified by immunofluorescence staining (Fig. 4) and was significantly increased in tissues with either 10% or 30% parasitemia. Thus, these results were consistent with the Western blot analysis.
Angiogenic stimulation in malaria-infected tissues
Using immunohistochemical staining for CD31 (an endothelium marker), we compared vessel formation in various tissue types showing 0%, 10%, and 30% parasitemia. Blood vessel formation was significantly induced by infection in each tissue type, in a parasitemia-dependent manner (Figs. 5, 6).
Taken together, our data suggest that malaria infection induces tissue hypoxia and angiogenesis in a parasitemia-dependent manner by increasing the expression of HIF1α and VEGF.
DISCUSSION
The oxidative stress caused by malarial infection mediates various physiological phenomena in the organs. For example, malaria-related acute kidney injury is associated with modification of renal vascular permeability due to oxidative stress [20]. Hypoxia caused by malarial infection is also related to angiogenesis. HIF1α and VEGF levels increase in the placentas of malaria-infected patients [21], and a recent study has suggested that malaria in pregnancy alters the angiogenic profile of the placenta [22]. In addition, angiogenic proteins are elevated in the brains of patients who die from cerebral malaria. These findings support the possibility of angiogenic stimulation due to oxidative stress during malaria infection [4]. However, there are also reports in which angiogenesis is inhibited by malarial infection, specifically in tumors [23,24].
In this study, we used a hypoxia-specific probe to analyze organs with different levels of malarial infection. We saw that hypoxic stress increased the protein level of HIF1α in malaria-infected tissues. As shown in Fig. 3, hypoxic stress gradually increased with parasitemia. Hypoxic stress also up-regulated HIF1α level in the brain, heart, kidney, liver, lung, and muscle. Increased HIF1α level triggered the expression of a major angiogenic factor, VEGF, in various tissues. In this study, we investigated whether an increase in angiogenic molecules (such as HIF1α and VEGF) actually induced angiogenesis in malaria-infected tissues. As shown in Fig. 5, the number of blood vessels significantly increased with parasitemia. However, correlation analysis showed that HIF-1a expression did not necessarily lead to VEGF expression in various organs (data not shown). These results suggest that the regulation of HIF1α and VEGF expression in certain tissues is independent of sequential mechanism that malarial induced hypoxia increase HIF1α and VEGF to induce angiogenesis.
The expression of HIF1α in liver was lower than any other tissues and VEGF was not significantly changed in spleen. These results suggest that other factors are involved in the regulation of these angiogenic proteins, and hence in angioegnesis in a tissue-specific manner. In order to identify these complex mechanisms in tissue-specific regulations of malaria induced angiogenesis, further studies are needed.
Our results demonstrate that malarial infection generates significantly hypoxic conditions in various tissues and induces HIF1α and VEGF expression in a parasitemia-dependent manner in mice. Induction of angiogenesis would serve to improve the oxygen supply to tissues experiencing infection-induced hypoxia.