Abstract
In fascioliasis, T-helper 2 (Th2) responses predominate, while little is known regarding early immune phenomenon. We herein analyzed early immunophenotype changes of BALB/c, C57BL/6, and C3H/He mice experimentally infected with 5 Fasciola hepatica metacercariae. A remarkable expansion of CD19+ B cells was observed as early as week 1 post-infection while CD4+/CD8+ T cells were down-regulated. Accumulation of Mac1+ cells with time after infection correlated well with splenomegaly of all mice strains tested. The expression of tumor necrosis factor (TNF)-α mRNA in splenocytes significantly decreased while that of IL-4 up-regulated. IL-1β expression was down-modulated in BALB/c and C57BL/6 mice, but not in C3H/He. Serum levels of transforming growth factor (TGF)-β were considerably elevated in all mice during 3 weeks of infection period. These collective results suggest that experimental murine fascioliasis might derive immune suppression with elevated levels of TGF-β and IL-4 during the early stages of infection.
-
Key words: Fasciola hepatica, murine fascioliasis, Mac 1+ cell, T-lymphocyte, IL-4, TGF-β
INTRODUCTION
Fasciola hepatica is a causative agent of liver rot (fascioliasis). It causes acute and chronic infections in livestock, which primarily affects sheep and cattle, and results in considerable economic losses to the livestock industry [
1]. Fascioliasis is also an emerging human disease in several countries of South America, Africa, and Southeast and Middle-east Asia [
2,
3]. One of the main pathologic findings of fascioliasis include an extensive local inflammatory reaction during the migration period of juvenile flukes, which persists over several weeks of infection and involves massive recruitment of eosinophils [
4,
5].
Differentiation of CD4
+ T-cells directs either type-1 (Th1) or type-2 (Th2) immune response and its magnitude. The Th1/Th2 paradigm provides a useful clue in understanding how humoral and cell-mediated immune responses are regulated in an infected host. In infectious disease models, CD4
+ T cells determine whether protective immune response is mounted [
6]. Th1 cells primarily produce IL-12 and IFN-γ, thereby protecting against intracellular pathogens. Th2 immune cells mainly produce IL-4, IL-5, and IL-13, and are intimately involved in resistance against helminth infections [
7]. In addition, regulatory T (Treg) cells have been involved in immune responses, which are characterized by elevation of expression levels of transforming growth factor-β (TGF-β) [
8], which has been implicated in the development of tolerance to foreign antigen and in the control of autoimmune diseases [
9]. TGF-β induced in various parasitic diseases subverted immune responses [
10]. For example, serum levels of TGF-β were correlated with the size of hepatic granuloma in chronic schistosomiasis [
11]. Administration of helminth antigens appeared to up-regulate the expression of TGF-β and resulted in partial remission of inflammatory bowel diseases [
12]. These collective data suggested a pivotal role of TGF-β in immune regulation during parasitic infections.
Previous studies observed a severe eosinophilia in both peripheral blood and bone marrow derived cells in animal and human fascioliasis [
13,
14]. Th2/Th0 clones have been isolated from chronically infected cattle, but these studies failed to identify Th1 clone [
15]. It has also been reported that T cells from cattle chronically infected with
F. hepatica did not produce IFN-γ in response to the fluke antigen, which suggested a predominant Th2 immune response in chronic fascioliasis [
16,
17].
F. hepatica infection appeared to down-regulate Th1 responses in IL-4 deficient mice [
18,
19]. Antibody responses against of
F. hepatica infection showed a strong isotype switching to IgG1 in cattle [
16]. A recent study demonstrated that parasite-driven IL-4/IL-10 might be associated with production of IFN-γ in early experimental fascioliasis in cattle. IL-10 influenced IFN-γ production at 12 weeks of experimental infection with cattle [
20]. All of these results suggested that Th2 responses might predominate in fascioliasis; however, nature of immune mechanisms in early invasive stage has not been investigated. Moreover, association and functional role of regulatory cytokines, such as TGF-β and IL-4 in
F. hepatica infection, have been remained to be elusive.
In this study, we assessed the immunophenotype of T cell subsets (CD4+ and CD8+) and B cells (CD19+) during 3 weeks of experimental fascioliasis in BALB/c, C57BL/6, and C3H/He mouse strains, which have different genetic backgrounds. We observed differentiation of immature myeloid cells into monocytes/macrophages during F. hepatica infection, which might be responsible for splenomegaly seen in fascioliasis, together with B cell proliferation. Our results suggested that marked expansion of B cells and Mac 1+ macrophages might be associated with splenomegaly of the experimental animals. We also investigated mRNA expression levels of IL-4, TNF-α, and IL-1β cytokines in infected splenocytes and detected the serum TGF-β levels. Up-regulation of TGF-β and IL-4 cytokine expressions might be highly correlated with decrease of the functional T cell populations. Our results suggested that immune suppressions following F. hepatica infection might result not only from a decrease of functional T cell populations, but may also from up-regulated secretion of TGF-β and IL-4.
MATERIALS AND METHODS
Animals and parasites
Age-matched BALB/c, C57BL/6, and C3H/He mice (male, 6-week old) were obtained from the Jackson Laboratory (Bar Harbor, Maine, USA). F. hepatica metacercariae were obtained from Baldwin Aquatics (Monmouth, Illinois, USA). The mice were infected with 5 metacercariae using a gavage needle. The mice were sacrificed by cervical dislocation at 1 week intervals after infection for 3 weeks. Each serum was collected by cardiac puncture followed by centrifugation at 1,500 rpm for 10 min. The sera and spleens removed were stored at -80℃ until use or immediately used for sample preparation. The weights of spleens were also measured immediately after removal. This animal study was reviewed and approved by the Institutional Animal Care and Committee (IACUC) of Sungkyunkwan University School of Medicine (SUSM). SUSM is an Association for the Assessment and Accreditation of Laboratory Animal Care (AAALAC) International accredited facility and abide by the Institute of Laboratory Animal Resources (ILAR) guide.
Flow cytometry analysis (FACS)
Mouse spleens harvested were gently chopped and filtered through sterile gauze, thereafter passed through 100-µm filters to obtain a single-cell suspension. The erythrocytes were lysed at room temperature using ACK lysis buffer (NH4Cl, KHCO3 and Na2-EDTA). The splenocytes were washed and resuspended in RPMI 1640 (Invitrogen, Carlsbad, California, USA) supplemented with 10% heat-inactivated fetal calf serum (Invitrogen). The total number of splenocytes were manually counted by the trypan blue exclusion test (n=3). The cells were double-stained with the following monoclonal antibodies: anti-CD3, anti-CD4, anti-CD8, anti-CD19, and anti-Mac1 (BD Pharmigen, San Jose, California, USA). After incubation of these FITC- or PE-labeled antibodies on ice for 45 min, the cells were washed 2 times with 3 ml 0.1% bovine serum albumin (BSA)-PBS. T- and B-cell subset phenotypes of splenic lymphocytes from infected mice were analyzed by the CellQuest program in FACS Caliber (BD Sciences, San Jose, California, USA). The cells were differentiated on the basis of differences in forward and side scatter characteristics.
Quantitative/competitive reverse transcription PCR (qRT-PCR)
Internal standards (IS) for recombinant IL-4, IL-1β, and TNF-α were prepared to quantify expression levels of respective mRNAs by quantitative/competitive RT-PCR. Primers were designed from mouse sequences registered in the GenBank at the NCBI (
www.ncbi.nih.gov/Genbank/) using Oligo6 software (Molecular Biology Insights, Cascade, Colorado, USA), as shown in
Table 1. In brief, an artificial or a recombinant RNA (rcRNA) was used as IS containing specific PCR primer sequences for IL-4, IL-1β, or TNF-α that was added to RNA samples in a dilution series. A rat β-globin sequence was used as the spacer gene for the IL-4, IL-1β, and TNF-α ISs [
21].
Total RNA was isolated using TRIreagent (Molecular Research Center, Cincinnati, Ohio, USA). rcRNA was used as an IS with 8 aliquots of rcRNA from 105 to 1010 molecules made for each RNA treatment group for competitive RT-PCR. The total RNA and IS rcRNA of known amount were reverse-transcribed into cDNA using oligo(dT)18 primers. A PCR master mixture consisting of PCR buffer, 4 mM MgCl2, 6 pmole each of IL-4, IL-1β, or TNF-α forward/reverse primers and 2.5 U of Taq DNA polymerase (Takara, Tokyo, Japan) were added to the cDNA samples. Samples were then heated at 94℃ for 10 sec, 59℃ for 30 sec, and 72℃ for 45 sec, followed by an additional extension step at 72℃ for 5 min. PCR products were electrophoresed in 8% polyacrylamide gels and visualized by ethidium bromide staining, after which quantified using densitometry. The point at which the ratio of IS to IL-4, IL-1β, or TNF-α mRNA was equal to one signified the cross-over point which represented the amount of IL-4, IL-1β, or TNF-α molecules present in the initial RNA sample.
Determination of serum TGF-β levels
Prior to determine the serum TGF-β concentration, activation of TGF-β was required to perform ELISA since anti-TGF-β antibody did not recognize the latent TGF-β. Serum samples were acidified (pH 2-3) with 6 N HCl. After incubation for 30 min at room temperature, the samples were neutralized with 6 N NaOH in 0.5 M HEPES buffer. The samples were serially diluted in 0.1% BSA-PBS and incubated in ELISA modules (Nunc, Kamstrupvej, Denmark) coated with anti-TGF-β mouse monoclonal antibodies (Genzyme, Cambridge, Massachusetts, USA) overnight at 4℃. Anti-TGF-β chicken polyclonal antibody (R&D Systems, Minneapolis, Minneapolis, USA) was subsequently incubated for 1 hr at 37℃. The color reaction developed with tetramethylbenzidine chromogen supplemented with 3% H2O2 for 20 min and stopped with 1 N H2SO4. The absorbance was read with a microtiter plate reader (BioRad M3550, Hercules, California, USA) at 450 nm. The blank values were subtracted from each experimental group, including the standard and sample. The content of TGF-β in each well was determined by using a standard curve and the concentration of TGF-β in serum was calculated from the value of the sample.
Statistical analysis
The data were expressed as the mean±standard error of the mean (SEM) from at least 3 independent experiments. Student's t-test was used to determine the significance of differences between control and experimental groups. P-values of <0.05 were considered to represent significant differences.
RESULTS
Changes of T and B cell populations in F. hepatica-infected mice
We determined chronological changes of total spelnocytes in
F. hepatica-infected mice. As shown in
Fig. 1A, the total number of splenocytes increased in accordance with the infection duration regardless of mouse strains. The increasing tendency was most prominent in BALB/c mice, while C3H/He mice showed the least increase. However, the number of spleen cells showed their peak at week 2 post-infection (PI) in all the mouse strains examined. We subsequently observed phenotype changes of splenic lymphocyte subsets. When splenocytes collected serially from the
Fasciola-infected mice were stained with anti-CD3 and anti-CD19, a marked increase of CD19
+ B cells with time after infection was observed. It reached to its peak at week 2 PI (
Fig. 1B). In contrast, the relative proportion of CD3
+ T cells gradually decreased with/without temporary elevation in all mouse strains tested. CD4
+ and CD8
+ T cell populations increased temporally during week 1 PI and thereafter decreased subsequently (
Fig. 1C). These results showed that
F. hepatica induced active immune responses from the early stage of infection. Although absolute number of T-cells might increase, the proportion of B cell subsets appeared to more significantly increase. The initial increase of CD4
+ T cells appeared to reflect a Th2 immune response suggesting humoral immunity. In contrast, CD8
+ T cell-mediated immune responses seemed not prominent except for a transient increase in BALB/c mice.
A quantitative competitive RT-PCR was carried out to measure the levels of mRNA transcripts of IL-4, TNF-α, and IL-1β in spleen cells of the infected mice using IS system. The quantitative results were obtained using 10-fold dilution series of the IS. PCR amplification produced 2 DNA fragments of 346 bp and 228 bp (upper and lower bands of
Fig. 2A). The upper band was from the internal competitor standard which decreased in intensity over the range of diminishing concentrations of competitor. Conversely, the lower band that derived from the native IL-4 cDNA resulted in increase of its intensity. A relative intensity showed R
2 value of 0.987. We also observed similar linearity in both TNF-α and IL-1β mRNA quantitation (data not shown).
The level of IL-4 mRNA transcripts increased in all mouse strains compared to those of controls, but revealed different patterns (
Fig. 2B). The expression levels of IL-4 mRNA transcripts of the spleen cells of BALB/c mice were up-regulated in a time-dependent manner. Those of C57BL/6 and C3H/He mice showed peak expressions at the times of week 2 and week 1 PI, respectively, and then gradually decreased, but retained up-regulated expressions compared to uninfected controls.
Fig. 2C shows an expression pattern of TNF-α during the course of infection. The expression of TNF-α was significantly suppressed from week 1 PI in BALB/c and C3H/He mice. C3H/He mice also exhibited similar suppressive patterns, but showed delayed onset at week 2 PI. However, in the case of C57BL/6 mice, expression of TNF-α was significantly restored in week 3 PI. The mRNA expression patterns of IL-1β were similar to those of TNF-α in BALB/c and C57BL/6 mice. In contrast, the spleen cells of C3H/He mice did not exhibit significant changes in IL-1β mRNA expression compared to the controls (
Fig. 2D). These results collectively demonstrated that, in
F. hepatica-infected mice, anti-inflammatory cytokine (IL-4) suppressing Th1 responses was up-regulated and proinflammatory cytokines, such as IL-1β and TNF-α, were down-regulated.
Accumulation of monocytes in F. hepatica-infected mouse spleen
We determined splenomegaly of the mice infected with
F. hepatica since marked splenomegaly has been frequently observed in parasitic infections and in some neoplastic diseases possibly due to an impaired immunity [
22].
Fig. 3 demonstrates that the mice infected with
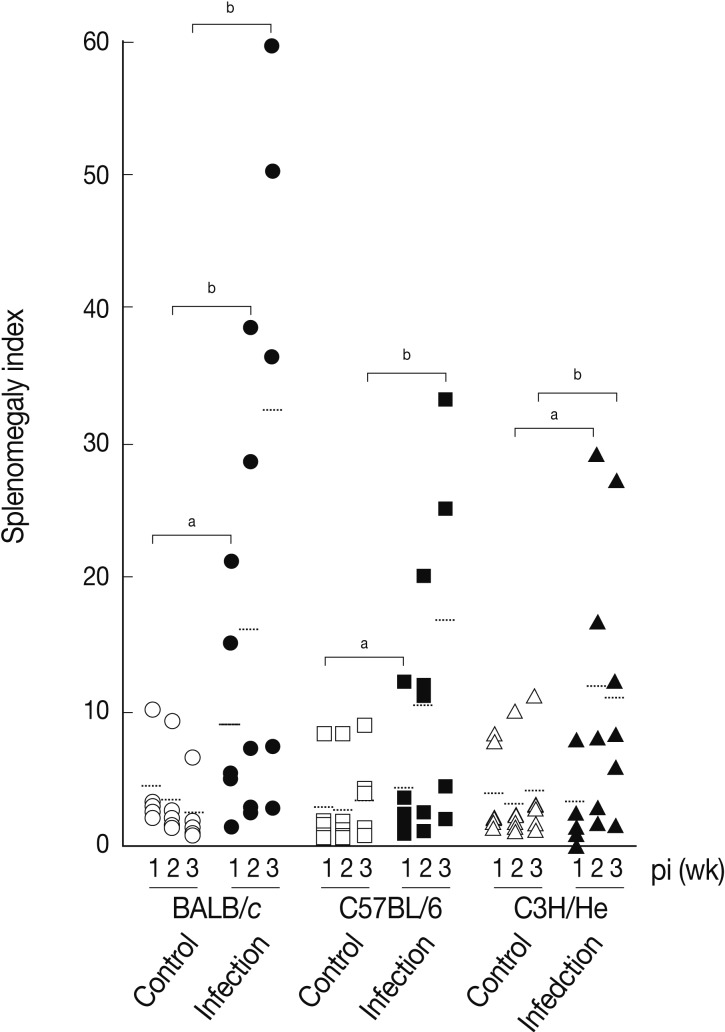
F. hepatica had splenomegaly, although there were some variations in accordance with the genetic background of the mouse strains examined. At week 3 PI, the splenomegaly index of BALB/c, C57BL/6, and C3H/He mice was 32.3±25.0, 16.7±13.4, and 11.3±9.8, respectively, while that of normal controls was 2.9±2.0, 4.2±3.5, and 4.2±4.1, respectively. BABL/c showed the highest degree of splenomegaly among all mouse strains examined (
P<0.05). The splenomegaly implicates the infiltration and accumulation of histiocytes, degranulated polymorphonuclear leukocytes, macrophages, plasma cells, and giant cells in the spleen [
23]. Therefore, we further observed accumulation of the Mac1
+ cell (CD11b/CD18) population in
Fasciola-infected mice. As shown in
Fig. 4, the number of Mac1
+ cells was dramatically increased in BALB/c mice at week 2 PI (
P<0.01). In C57BL/6 and C3H/He mice, the increased proportion of Mac1
+ cells was observed also from 3 weeks after infection, while the increase was not prominent as observed in BALB/c mice.
TGF-β is a well-known cytokine that acts as a negative regulator in the immune system [
24]. It has been reported that Treg secretes TGF-β to down-regulate the immune system after activation in response to allergens and pathogens, including protozoan parasites [
25]. Furthermore, cancer cells and autoimmune diseases were shown to escape immune surveillance via secretion of TGF-β that can directly inhibit activation of immune cells [
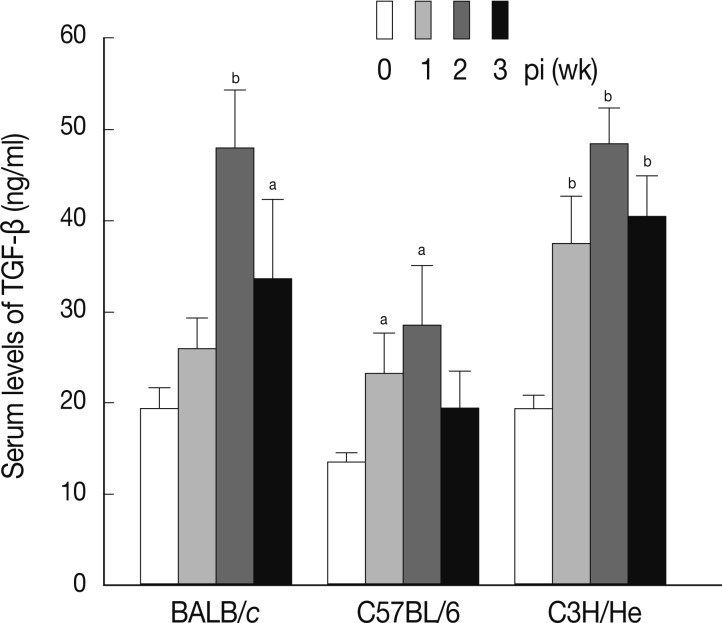
8]. We examined the serum levels of TGF-β in mice infected with
F. hepatica. As shown in
Fig. 5, the levels of serum TGF-β increased in a time-dependent fashion following infection in all mouse strains examined. The maximum levels of serum TGF-β were observed at week 2 PI in each mouse strain.
DISCUSSION
It has become clear that the cellular and molecular events after infection are important for regulation of the early protection against infection and are closely related with the nature of the type of immune responses leading to final outcome. In this study, we investigated the profile of cytokine expression as well as changes of T- and B-lymphocyte populations in BALB/c, C57BL/6, and C3H/He mice infected with
F. hepatica. Our results demonstrated that, although there were some variations according to the mouse strain, Th1 suppressive cytokines were increased while pro-inflammatory cytokines were complete depressed. These results suggested strongly that there is a predominant Th2 immune response in early murine experimental fascioliasis regardless of the host strain difference. Although we did not check cytokine expressions in the peripheral blood and regional lymph nodes of the infected mice, a previous study has demonstrated that cytokine production in the splenocytes and lymph node cells were comparable each other in murine fascioliasis, in which polarization of Th2 immune responses was exhibited. Moreover, when infected with a high dose of 15 metacercariae, the Th1 cytokines were completely down-regulated in BALB/c, 129Sv/Ev (IL-4 knockout C57BL/6), and C57BL/6 mice [
18]. The induction of Th2 cytokines in this study is in agreement with previous observations and collectively implies that Th2 immune responses predominate in
F. hepatica-infected mice, rats, sheep, and cattle [
16]. However, as evidenced in this study, the extent to which the immune responses of mice are polarized to the Th2 depends on the mouse strain. This difference may result from different properties of the host immune system, as has been reported by an experimental murine infection model [
20].
The role of CD4
+ and CD8
+ T cells in protection against
F. hepatica infection has been investigated in an experimental animal model. Heavy infiltrations of CD4
+ and CD8
+ T cells into the area of the liver penetrated by flukes were shown in sheep during acute and chronic infection [
5]. More intensive migration occurred following a secondary infection [
26]. The importance of CD4
+ cells in advance of
F. hepatica infection was emphasized by characterization of expanded T-lymphocytes against
F. hepatica adult worm antigen [
15,
20]. In this study, CD4
+ and CD8
+ T cells were transiently increased at week 1 PI in BALB/c and C3H/He mice. Marked expansion of B cells was also observed at week 1 PI. The early B cell involvement may be attributable to a compensatory mechanism for the impaired T cell functions. It seems likely that those T cells were initially stimulated and expanded in response to parasite antigens in early infection phase thus to potentiate B cell activity in the following periods. However, this kind of early immune response could not be maintained since the population of CD4
+ and CD8
+ T cells was abruptly decreased as the period of infection progressed (
Fig. 1B).
In this study, we observed a high degree of splenomegaly induced by F. hepatica infection in all mouse strains examined, which followed the peak increase of splenocytes at week 2 PI. We thought that this phenomenon was an evidence of accumulation of non-functional, impaired lymphocytes in the spleen in response to the parasitic infection. In order to examine which major cell population contributed to the splenomegaly, we analyzed the Mac1+ cell proportion among the splenocytes of the infected mice. We found that the Mac1+ cell population was significantly increased in all mouse strains examined. In particular, BALB/c mice demonstrated the most prominent splenomegaly with an increase of the Mac1+ cells. This result suggested that the Th2 type immune response might start to work in an early stage in response to F. hepatica infection, while the immune regulatory system became impaired shortly after the induction due to an overwhelming infection. Although we infected the mice each with 5 metacercariae, it appeared to be an overtly high dosage.
TGF-β plays pivotal roles in cell migration, differentiation, adhesion, pattern formation, and apoptosis, as well as serves as a mediator of T cell unresponsiveness, following mucosal administration of antigens [
27,
28]. It has been proposed to represent a signature cytokine of a regulatory T-cell subset associated with oral tolerance [
24]. In addition, TGF-β plays a major role in maintaining an appropriate balance to proinflammatory responses, to control or eliminate the pathogen. Meanwhile, it simultaneously regulates ant-inflammatory responses, to limit pathobiological alterations in similar to other infections. For example, the down-regulation of Th1 inflammatory responses involved an anti-inflammatory cytokine, TGF-β, as well as Th2 cytokines, IL-4 and IL-10 [
8]. A previous study also demonstrated that blocking TGF-β activity resulted in augmentation of
Fasciola-specific IL-4 production [
20]. Concordantly, all mouse strains examined in this study showed a similar cytokine profile in response to
F. hepatica infection. Reciprocal balance between expression levels of IL-4 and those of serum TGF-β level were highly related (
Figs. 2,
5). It has also been proposed that cytokines derived from Th2 cells, such as IL-4 or IL-10, are necessary to down-regulate proinflammatory cytokine production in murine schistosomiasis [
29]. In addition, serum levels of regulatory cytokines, such as IL-10 and TGF-β, in relation to Treg functions in murine fascioliasis await further elucidation.
In conclusion, we observed the changes of immunophenotype of T-cell subsets and B-cells in experimental fascioliasis in mice with different immune genetic backgrounds. We also analyzed expression levels of mRNA transcripts of IL-4, TNF-α, and IL-1β cytokines and detected the serum TGF-β levels. Our findings support the hypothesis that the elevation of anti-inflammatory and Th2 type cytokines, as well as impaired immunity possibly due to a decrease of the functional T-cell population, in response to F. hepatica infection are implicated in the mechanism of immune evasion exploited by the parasite to down-regulate the host immune system.
ACKNOWLEDGMENT
This work was supported by a grant from Korea Science and Engineering Foundation (KOSEF R01-2003-000-10305-0).
References
- 1. Marcos LA, Terashima A, Gotuzzo E. Update on hepatobiliary flukes: Fascioliasis, opisthorchiasis and clonorchiasis. Curr Opin Infect Dis 2008;21:523-530.
- 2. Curtale F, Hassanein YA, Barduagni P, Yousef MM, Wakeel AE, Hallaj Z, Mas-Coma S. Human fascioliasis infection: gender differences within school-age children from endemic areas of the Nile Delta, Egypt. Trans R Soc Trop Med Hyg 2007;101:155-160.
- 3. Rokni MB. The present status of human helminthic diseases in Iran. Ann Trop Med Parasitol 2008;102:283-295.
- 4. Tliba O, Sibille P, Boulard C, Chauvin A. Local hepatic immune response in rats during primary infection with Fasciola hepatica. Parasite 2000;7:9-18.
- 5. Molina EC, Skerratt LF. Cellular and humoral responses in liver of cattle and buffaloes infected with a single dose of Fasciola gigantica. Vet Parasitol 2005;131:157-163.
- 6. Taylor MD, van der Werf N, Harris A, Graham AL, Bain O, Allen JE, Maizels RM. Early recruitment of natural CD4+ Foxp3+ Treg cells by infective larvae determines the outcome of filarial infection. Eur J Immunol 2009;39:192-206.
- 7. Pearce EJ, MacDonald AS. The immunobiology of schistosomiasis. Nat Rev Immunol 2002;2:499-511.
- 8. Gorelik L, Flavell RA. Transforming growth factor-beta in T-cell biology. Nat Rev Immunol 2002;2:46-53.
- 9. McGuirk P, Mills KH. Pathogen-specific regulatory T cells provoke a shift in the Th1/Th2 paradigm in immunity to infectious diseases. Trends Immunol 2002;23:450-455.
- 10. Omer FM, Kurtzhals JA, Riley EM. Maintaining the immunological balance in parasitic infections: A role for TGF-beta? Parasitol Today 2000;16:18-23.
- 11. Mola PW, Farah IO, Kariuki TM, Nyindo M, Blanton RE, King CL. Cytokine control of the granulomatous response in Schistosoma mansoni-infected baboons: Role of exposure and treatment. Infect Immun 1999;67:6565-6571.
- 12. Motomura Y, Wang H, Deng Y, El-Sharkawy RT, Verdu EF, Khan WI. Helminth antigen-based strategy to ameliorate inflammation in an experimental model of colitis. Clin Exp Immunol 2009;155:88-95.
- 13. Milbourne EA, Howell MJ. Eosinophilia in nude rats and nude mice after infection with Fasciola hepatica or injection with its E/S antigens. Int J Parasitol 1997;27:1099-1105.
- 14. Karahocagil MK, Akdeniz H, Sunnetcioglu M, Cicek M, Mete R, Akman N, Ceylan E, Karsen H, Yapici K. A familial outbreak of fascioliasis in Eastern Anatolia: a report with review of literature. Acta Trop 2011;118:177-183.
- 15. Brown WC, Davis WC, Dobbelaere DA, Rice-Ficht AC. CD4+ T-cell clones obtained from cattle chronically infected with Fasciola hepatica and specific for adult worm antigen express both unrestricted and Th2 cytokine profiles. Infect Immun 1994;62:818-827.
- 16. Mulcahy G, Joyce P, Dalton JP. In: Dalton JP, editor. Immunology of Fasciola hepatica infection. Fasciolosis. 1999. Wallingford, UK. CAB International; p. 341-376.
- 17. Ingale SL, Singh P, Raina OK, Mehra UR, Verma AK, Gupta SC, Mulik SV. Interferon-gamma and interleukin-4 expression during Fasciola gigantica primary infection in crossbred bovine calves as determined by real-time PCR. Vet Parasitol 2008;152:158-161.
- 18. O'Neill SM, Brady MT, Callanan JJ, Mulcahy G, Joyce P, Mills KH, Dalton JP. Fasciola hepatica infection downregulates Th1 responses in mice. Parasite Immunol 2000;22:147-155.
- 19. Gironès N, Valero MA, García-Bodelón MA, Chico-Calero I, Punzón C, Fresno M, Mas-Coma S. Immune suppression in advanced chronic fascioliasis: An experimental study in a rat model. J Infect Dis 2007;195:1504-1512.
- 20. Flynn RJ, Mulcahy G. The roles of IL-10 and TGF-β in controlling IL-4 and IFN-γ production during experimental Fasciola hepatica infection. Int J Parasitol 2008;38:1673-1680.
- 21. Vanden Heuvel JP, Tyson FL, Bell DA. Construction of recombinant RNA templates for use as internal standards in quantitative RT-PCR. Biotechniques 1993;14:395-398.
- 22. Wilson S, Jones FM, Mwatha JK, Kimani G, Booth M, Kariuki HC, Vennervald BJ, Ouma JH, Muchiri E, Dunne DW. Hepatosplenomegaly is associated with low regulatory and Th2 responses to schistosome antigens in childhood schistosomiasis and malaria coinfection. Infect Immun 2008;76:2212-2218.
- 23. Berman JE, Zolla-Pazner S. Changes in splenic histology and cytology in mice bearing plasmacytomas. Cell Immunol 1984;87:137-146.
- 24. Wan YY, Flavell RA. TGF-beta and regulatory T cell in immunity and autoimmunity. J Clin Immunol 2008;28:647-659.
- 25. Romagnani S. Regulation of the T cell response. Clin Exp Allergy 2006;36:1357-1366.
- 26. Meeusen E, Lee CS, Rickard MD, Brandon MR. Cellular responses during liver fluke infection in sheep and its evasion by the parasite. Parasite Immunol 1995;17:37-45.
- 27. Fitzpatrick DR, Bielefeldt-Ohmann H. Transforming growth factor beta in infectious disease: always there for the host and the pathogen. Trends Microbiol 1999;7:232-236.
- 28. Fuss IJ, Boirivant M, Lacy B, Strober W. The interrelated roles of TGF-beta and IL-10 in the regulation of experimental colitis. J Immunol 2002;168:900-908.
- 29. Brunet LR, Dunne DW, Pearce EJ. Cytokine interaction and immune responses during Schistosoma mansoni infection. Parasitol Today 1998;14:422-427.
- 30. Sheth SG, Amarapurkar DN, Chopra KB, Mani AS, Metha PJ. Evaluation of splenomegaly in portal hypertension. J Clin Gastroenterol 1996;22:28-30.
Fig. 1Changes of total splenocytes, and T- and B-cell populations in mice infected with 5 metacercariae of F. hepatica. (A) Chronological changes of splenocytes in 3 different mouse strains. The experiment was independently quadruplicated. Open and closed symbols each represent control and infection groups. aP<0.05 and bP<0.01. (B) Changes of the relative proportions of B- and T-cells. Splenocytes were harvested, washed, immunostained with FITC-conjugated anti-CD3 and PE-anti-CD19 antibodies, and were analyzed by FACS caliber. The proportions of CD3+ and CD19+ cells in the splenocytes were standardized on the basis of age-matched normal control mice. Mean±SEM (n=5). (C) Changes of splenic CD4+ and CD8+ T cell populations. Splenocytes were obtained from normal and infected mice and were doubly stained with FITC-conjugated anti-CD3+ and PE-conjugated anti-CD4+ or CD8+ antibodies. Changes of T cell populations were analyzed by flow cytometry. Mean±SEM (n=5).
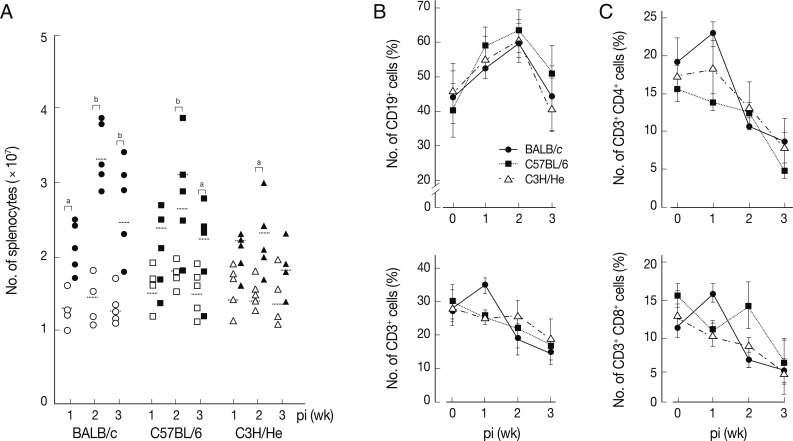
Fig. 2Expression of cytokine mRNA transcripts in total spleen cells of BALB/c, C57BL/6, and C3H/He mice infected with F. hepatica by competitive RT-PCR. (A) Construction and quantification of IL-4 competitor molecule as an internal standard (IS) during competitive RT-PCR. The cDNA synthesized from mouse spleen cells was added to various concentrations of the competitor prior to PCR amplification. The PCR products were resolved by 8% polyacrylamide gel, visualized by ethidium bromide staining, and were quantified by a use of densitometer. After densitometry, the following calculations were performed to determine the molecules/µl of the IL-4 that was 346 bp: [(µg/µl)/(330 µg/µmol/bp×bp IS)]×6.02×10¹⁷ molecules/µmol. We approximated that 330×bp equals the molecular weight of internal standard. Expression levels of mRNA transcripts of IL-4 (B), TNF-α (C), and IL-1β (D) in BALB/c, C57BL6, and C3He mice infected with F. hepatica. Total RNAs were isolated from the spleen cells and were quantified by quantitative competitive RT-PCR. The data represent the mean±SEM of 3 independent experiments. aP<0.05 and bP<0.01.
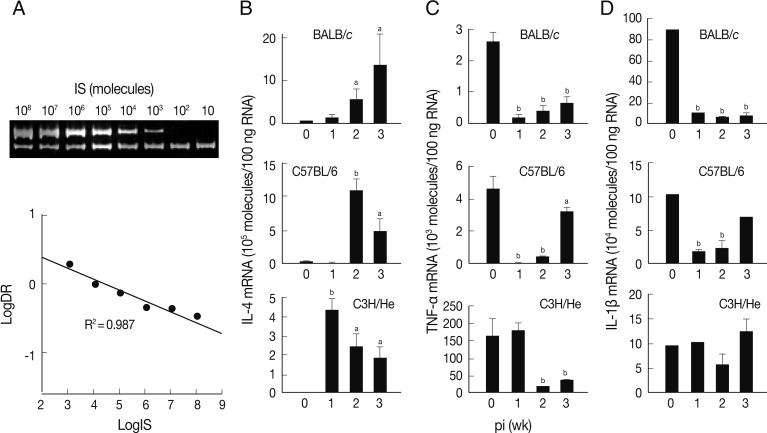
Fig. 3Splenomegaly index of
Fasciola hepatica-infected mice. Index of splenomegaly was calculated as (spleen weight/body weight)×10
-4 [
30]. The data represent the mean±SEM of 5 mice per each group.
aP<0.05 and
bP<0.01.

Fig. 4Change of Mac1+ cell population in mice infected with F. hepatica. The total splenocytes were obtained from the mice and were immunostained with FITC-conjugated anti-Mac1 antibody. The immunostained cells were analyzed by flow cytometry. The data represent the mean±SEM from 3 independent experiments. aP<0.05 and bP<0.01.
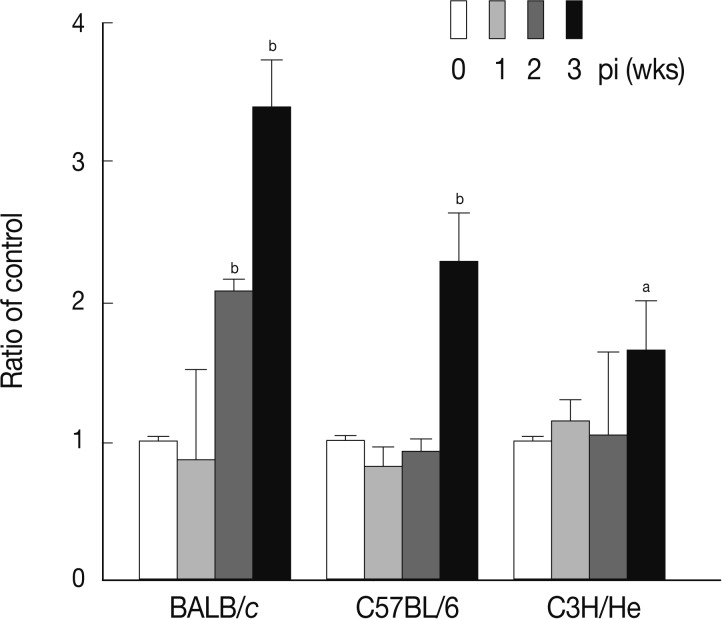
Fig. 5Concentrations of serum TGF-β at weeks 1, 2, and 3 after F. hepatica infection. The amount of TGF-β was determined in sera of BALB/c, C57BL/6, and CH3/He mice at the indicated time intervals. The latent TGF-β was activated by adding 6 N HCl for 30 min after which was neutralized with 6 N NaOH in 0.5 M HEPES buffer. The samples were subjected to serial dilution in 0.1% BSA-PBS and incubated with anti-TGF-β mouse monoclonal antibodies. Anti-TGF-β chicken polyclonal antibody was used as the detection antibody and the reactions were developed by tetramethylbenzidine. The colorimetric reaction was stopped with 1 N H2SO4. The absorbance was read at 450 nm. The blank values were subtracted from each experimental group, including the standard and sample. The data represent the mean±SEM from 3 independent experiments. aP<0.05 and bP<0.01.

Table 1.Cytokine primers and optimum conditions for quantitative competitive RT-PCR
Table 1.
|
Primers |
Nucleotide sequence (5´ → 3´)a
|
Product size in bp (Intact mRNA/ISb) |
Tm (˚C) |
|
IL-4 |
F: AACGAGGTCACAGGAGAAG |
228/346 |
60 |
|
R: GTCTATCGATGAATCCAGGC |
|
|
|
IL-1β |
F: TGCAGAGTTCCTACATGGTCAACCC |
386/329 |
62 |
|
R: GTGCTGCCTAATGTCCCCTTGAATC |
|
|
|
TNF-α |
F: ACTAGTGGTGCCAGCCGATGGGTTG |
370/324 |
62 |
|
R: GTGGGGGCTGGGTAGAGAATGGATG |
|
|