Abstract
Malaria remains one of the leading health burdens in the developing world, especially in several sub-Saharan Africa countries; and Uganda has some of the highest recorded measures of malaria transmission intensity in the world. It is evident that the prevalence of malaria infection, the incidence of disease, and mortality from severe malaria remain very high in Uganda. Although the recent stable political and economic situation in the last few decades in Uganda supported for a fairly good appreciation of malaria control, the declines in infection, morbidity, and mortality are not sufficient to interrupt transmission and this country is among the top 4 countries with cases of malaria, especially among children under 5 years of age. In fact, Uganda, which is endemic in over 95% of the country, is a representative of challenges facing malaria control in Africa. In this study, we evaluated an active case detection program in 6 randomly selected villages, Uganda. This program covered a potential target population of 5,017 individuals. Our team screened 12,257 samples of malaria by active case detection, every 4 months, from February 2015 to January 2017 in the 6 villages (a total of 6 times). This study assessed the perceptions and practices on malaria control in Kiyuni Parish of Kyankwanzi district, Uganda. Our study presents that the incidence of malaria is sustained high despite efforts to scale-up and improve the use of LLINs and access to ACDs, based on the average incidence confirmed by RDTs.
-
Key words: Plasmodium falciparum, malaria, control, active case detection, rapid diagnostic test, Uganda
There has been substantial worldwide interest in the reduction of the burden of malaria [
1]. Malaria has been eliminated from Europe, North America, and parts of other continents through deliberate vector control, treatment with effective drugs as well as improved social and living conditions [
2]. Despite a long time of scientific progress in preventing, treating, and understanding the parasite and its means of reproduction, it remains one of the 10 major threats to global health in 2018 and is still a leading cause of morbidity and mortality worldwide, posing a major public health challenge in several countries across sub-Sahara Africa [
3]. In 2015, there were 214 million cases of malaria and approximately 438,000 deaths reported, with 90% of the deaths in sub-Sahara Africa. While some countries achieved remarkable reduction in malaria cases in the 1950s and early 1960s, the momentum for malaria eradication program stalled thereafter with the World Health Organization (WHO) settling for malaria control [
4].
In spite of the significant declines in malaria at global level, slower declines were reported in the 15 highest burden countries, the majority of which are situated in sub-Sahara Africa [
3]. Despite the recent stable political and economic situation in the last few decades allowing for a fairly good appreciation of the malaria situation, Uganda is among the top 4 countries with cases of malaria, especially among children under 5 years of age [
5]. Major challenges to malaria control in Uganda include high malaria transmission intensity, insufficient financing, improper health-care resources, poor health system, and inadequate comprehension of malaria epidemiology and the impact of control intervention. Other challenges include the increasing resistance of parasites and mosquitoes to drugs and insecticides, inappropriate care management, and the limited infrastructure for the monitoring of disease trends. One of the reasons for these challenges is the inadequate malaria case detection. The strategy for malaria control in endemic countries such as Uganda involves prevention (such as vector control strategies) and quick case management [
6,
7]. Despite the positive impact of passive case detection, active case detection by rapid diagnostic tests, undertaken by health-care workers to identify symptomatic and asymptomatic patients for medical evaluation and to facilitate early entry into malaria care, can be employed as a supplementary approach to reduce diagnostic delay and to identify cases missed by routine services.
Recently, there has been a renewed Global Campaign against malaria with the goal of achieving sustained control and eventual elimination of malaria [
8]. In addition, there have been several initiatives to rapidly scale-up existing malaria interventions across Uganda [
9]. The Roll Back Malaria (RBM) initiative emphasizes vector control using indoor residual spraying (IRS), long lasting insecticide-treated mosquito nets (LLINs), prompt diagnosis and effective treatment of cases, as well as intermittent presumptive treatments [
10–
15]. These initiatives have been shown to individually contribute towards the reduction in mosquito populations and mosquito bites; preventing the spread of malaria [
16]. However, malaria persists in being the most common illness in Uganda and access to adequate treatment remains an essential challenge, especially in rural families [
9]. One of the reasons is the inadequate case detection. It is estimated that large numbers of new cases were either never diagnosed or they received treatment from the private sector. Untreated patients continue to transmit malaria and those treated incorrectly could develop drug resistance. Based on the Uganda malaria case management viewpoint, the private sector, including the private for profit hospitals and clinics, pharmacies, and drug stores are important providers of health services with up to 80% of patients seeking treatment at this level [
17].
However, diagnostic testing with rapid diagnostic tests (RDTs) is only permitted in approved pilot areas of the country [
18]. Thus, the introduction of malaria diagnostics with supportive interventions, including training and supervision, may be a good strategy to improve malaria case management service [
19–
21]. Malaria surveillance depends on 2 important methods. Passive case detection (PCD); whereby malaria cases are diagnosed only by village health workers or at the clinic when the patient is brought in for treatment, is generally now preferred over active case detection (ACD) in many malaria intervention studies [
22,
23]. Instead of PCD, ACD can be employed as a supplementary approach to eliminate diagnostic delay and to identify cases missed by routine services. ACD is an initiative undertaken by health-care providers to identify both symptomatic and asymptomatic patients for medical evaluation and to facilitate early entry into malaria care.
Despite the above, high rates of recurrent malaria after treatment have been reported from different high burden sub-Saharan African countries. Like other districts in Uganda and indeed other sub-Saharan African countries, malaria control activities in Kyankwanzi district have been mainly facility, community, and home-based PCD of fever, targeting children under 5 years of age, as well as the distribution of insecticide-treated nets (ITNs) [
24]. This study elucidates whether or not ACD using village health teams (VHTs) in Kiyuni Parish, Kyankwanzi district shows reduction of malaria cases, and to systematically strengthen the already existing malaria vector control interventions and their delivery mechanism in the parishes. From the analysis of a pilot, ACD showed a 50% reduction in the prevalence of parasitaemia within 1 year (Kim et al., unpublished data) performed at the same parishes with this main malaria control project. From this preliminary data, we decided the massive diagnostic and control tests for the elucidation of the efficiency of ACD as a malaria control project.
Kyankwanzi district is in a region of high malaria prevalence and the disease contributes more than 45% of the health burden in the district. Moreover, although both curative and preventive intervention is offered by the health-care system for malaria control, there has been slow progress in the elimination of both malaria cases and the infective mosquito populations.
The study procedures concerning the collection of samples from participants, laboratory investigation, interview, and questionnaire completion were reviewed and approved by the Institutional Review Board (IRB) of the Inha University Hospital (IUH-IRB 13-2661), and Institution Review Committee, Uganda of Mbarara University (11/01-14). The study was conducted according to the principles of the 1964 Helsinki Declaration. Further permission to conduct this study was sought from Kyankwanzi Local Government leadership and Local Council 1 Chairperson. Before the start of the study, the government officials, district Health Officers, and broadcasters were briefed; and a census was conducted in all 6 villages and households. All participants (household members) read through the participant information sheet, explaining the objectives, procedures and possible risks, and benefits of the research project. Signed consent forms were obtained from the participants and their parents, guardians (for children aged below 18 years), or legal representatives prior to sample submission. Personal information was obtained through household survey and by the use of questionnaires. Questionnaires had both open- and closed-ended questions on the number of family members, name and gender, date of birth of each family member, occupation of the head of household, level of literacy, and monthly family living expenses. All investigators were responsible for conducting, recording, translating, and transcribing their own interviews. During the interview, investigators observed and took note of the type of residence, presence or absence of shutters, and inquired about coverage of mosquito nets and the source of water for domestic use. The consent forms were designed in English and translated to Luganda, the commonly used language in the study area; either English or Luganda forms were then used depending on each participant’s preference. Additionally, a personal identification number for each member of a participating household was used on all documents for each participant, instead of the individual’s name. After the interview, every house was provided with at least a minimum of 2 LLINs to complement the wire mesh installed in the windows of all households by the ChildFund Uganda, in the parish.
This study, based on a program supported by ChildFund Korea, was set in Kiyuni Parish, a rural parish in Uganda. Prior to the commencement of the study, all health workers and VHT participated in a week-long training program that consisted of formal discussions about the study protocol, interview questions, and qualitative interviewing techniques. The training also included how to conduct RDTs, new approaches to home-based management of fever at village level, as well as on ITN use at household level. Health workers also received training on the handling of medicines and logistics management. Data collection tools were pretested in another parish in Kyankwanzi district to exclude any ambiguity in the questions. Every week, 2 laboratory staffs visited the villages to meet with the VHTs for quality control while VHT members, on a monthly basis, were subjected to support supervision. Refresher orientation in data management was given twice in the fourth quarter of the 1st and 2nd year of the study to data managers.
Uganda (officially the Republic of Uganda), is a landlocked country in the African Great Lakes Region in East Africa. The neighboring countries are Kenya, Tanzania, Rwanda, Democratic Republic of Congo, and South Sudan. Straddling the equator, there is little year-round fluctuation in temperature and no real winter or summer. The hottest months are January and February when the average daytime range is 24–33°C (52–91°F) with peaks of up to 40°C/104°F in the far north. The 6 villages of Kiyuni Parish, where the study was conducted, are Bulyanzige, Kikandwa, Kikubya, Kiyuni Central, Kyerere East, and Kyerere North; and these are located in Gayaza sub-County, Kyankwanzi district, that was curved out of Kiboga district (
Fig. 1). Kiyuni Parish is located in the Central Region of Uganda about 150.4 km from Kampala. It lies approximately between 1° north of the equator and 31.5° east. It borders the district of Masindi to the northeast, Mubende to the southwest, Kibale to the west, Nakaseke to the east, Hoima to the North-west, and Kiboga to the south-east. The total land area of Kiyuni Parish is about 250 km
2. The total population of the Kiyuni Parish is 5,017 people of which 1,232 are children below 5 years of age while the numbers of households are 980. The total population of 5,017 people did not include the 64 neonates (who have considerable resistance to
P. falciparum, especially when born to immune mothers in areas where malaria is endemic), included in this study.
This study was implemented over 2 years in the 6 villages. Malaria transmission in this area has not been described in detail previously; the most dominant malaria parasite is
Plasmodium falciparum while the major transmission vectors are
Anopheles gambiae s.l. and
An. funestu representing about 87–100% of the collected anopheline mosquitoes, depending on the area [
25]. In case of malaria incidence in Uganda, there are some reports that maximum daily temperature is negatively correlated with malaria prevalence and literatures found negative associations with increased daily maximum temperatures [
26]. Random sampling, which occurred 6 times overall among individuals, regardless of age, gender, social status, or ethnicity, was performed every 4 months for 2 years at the primary health centers in the 6 malaria-endemic villages of Kiyuni Parish, Uganda. Participants were sampled as previously described [
27]. Fingertip blood samples (approximately 50–100 μl) were collected by the laboratory technicians from each participant. The technicians involved in this study received detailed training, and their performance and agreement to participate were monitored through internal and external quality control assessments. RDT testing (SD BioLine Malaria Antigen P.f/P.v Test, Standard Diagnostics, INC., Yongin, Korea) was performed according to the manufacturer’s instructions. In brief, approximately 20 μl of whole blood was loaded into the injection well of the device. The assay diluents were added to the buffer well. The test results were interpreted within 20 min and only considered positive if the internal control and either the Histidine-Rich Protein (HRP)-II band or
pLDH bands were positive. The control line indicates that the test has been performed well. Positive or negative results for respective malaria parasite are based on the color code shown on the strip. Test line intensities, visible as cherry-red to purple colored lines, were scored according to 4 category systems: none (no line visible), weak (paler than the control line [+]), medium (equal to the control line [++]), and strong (stronger than the control line [+++]). All the kits were tested, and the results were validated to ensure strict adherence with the manufacturer’s instructions. There were no invalid test results. The evaluation process maintained an unbiased method. The status of samples was unknown to the persons involved at pre-analytical and analytical phases of the procedures.
This program covered the potential target population of 5,017 individuals. Our team screened 12,257 samples for malaria by ACD every 4 months from February 2015 to January 2017 in the 6 villages.
Table 1 gives the analysis of positive RDTs of the population at every village screened by ACD. During the study period, ACD detected 2,519 positive RDTs among the cases from the total number of 12,157 screened samples (positive rate= 20.55%).
Table 2 represents the details of the malaria positive RDTs screened and detected by the first to the sixth ACDs (1st: 575/2,815 [20.43%], 2nd: 237/1,537 [15.42%], 3rd: 442/1,998 [22.12%], 4th: 724/2,147 [33.72%], 5th: 288/2,017 [14.28%], and 253/1,743 [14.52%]).
Table 3 shows the percentages for the conversion status of the diagnostic results detected by ACD using RDTs from February 2015 to January 2017. The negative conversion rate is the percentage of malaria-positive cases in a specific time that converted to malaria negative cases with RDTs, whereas the positive conversion rate is that from negative to positive cases. The negative conversion rates at each ACD time point were 66.8%, 57.8%, 47.2%, 76.6%, and 74.3%, respectively. But the positive conversion rates were more than 10.9% at each ACD time point (
Table 3). Additionally, even with our functional malaria elimination program in these villages, more than 23.5% of initially malaria positive patients were still malaria-positive at the end of this program, despite medication and LLIN supply. We also analyzed the conversion rate status by age groups, screened and detected by ACD (
Table 4). However, our analysis results are rather difficult to interpret because the trends were not clear. For example, from the 1st and 2nd ACDs and from the 3rd and 4th ACDs, the proportions of positive individuals who converted to negative decreased. However, that proportion abruptly increased from the 3rd and 4th ACDs. This pattern is not straightforward to understand. In addition, it is important to mention that our dataset had many missing data. For instance, the numbers of observations at the 1st and 2nd ACDs were 2,815 and 1,537, respectively. This high proportion of missing data was consistent regardless of which subgroup was analyzed. For example, with children (0 to 10 years old), the number of observations at the 1st and 2nd ACDs were 1,239 and 737, respectively (
Table 4). Therefore, the main limitation of our analysis is that the results may be sensitive to the propensity of the individuals with missing data. In particular, if positive individuals tend to dropout more often than negative individuals, our result could be subjected to serious bias. Based on these facts, we admit that our analysis result may not be confirmatory and should be interpreted with caution.
Early diagnosis and treatment of malaria cases are crucial to ensuring the success of malaria elimination in endemic regions. According to the manufacturer’s data, the specificity of testing by RDT in our study was high (specificity: 99.5%; sensitivity for
P. falciparum 99.7%). It is possible that in our high endemicity malaria context, a high proportion of individuals might be having low parasite density not detected by microscopy, despite having experienced microscopists and quality control in the reading of each individual blood smear. Early diagnosis reduces patients’ suffering, medical costs, and interrupts the transmission of disease. While some efforts towards the accessibility to malaria diagnosis and treatment have substantially improved for several countries across sub-Sahara Africa, these are insufficient to meet the global target of universal access to ACDs and diagnostic testing [
28,
29]. Key strategies for malaria vector control and case management include IRS, ITNs, and prompt case management with anti-malaria drugs [
30]. However, Uganda has some of the highest recorded measures of malaria transmission intensity in the world [
31]. In addition, there are essential evidences that, despite clear advances in other regions of Africa, malaria incidence has not diminished significantly in most of Uganda. Even with improvements in malaria control efforts, considerations for malaria elimination in Uganda within the next few decades are unrealistic [
32].
Our study confirms that the incidence of malaria remains unacceptably high despite efforts to scale-up and improve the use of LLINs and access to ACDs, based on the average incidence confirmed by RDT. Incidence was high even among individuals reported to be using LLINs. It is well known that the ITN is highly effective in controlling malaria because of the endophagic and late biting behavior of the 2 main vectors in Uganda. Otherwise, in Southwestern Uganda, a low transmission area, IRS is effective in response to changing transmission patterns [
33]. Effectiveness of ITNs is not only determined by the coverage, adherence to the appropriate use of the nets, and periodic re-treatment of the nets, but also on the specie of the vector responsible for malaria transmission [
34]. Therefore, alternative measures are urgently needed. The strength of our study is that of random sampling by households, and a relatively large sample size. Random sampling at household level minimized the risk of confounding due to differences in malaria exposure or access to health-care. Thus, more comprehensive and sustained control measures may be required to reduce the massive disease burden in Uganda. Furthermore, appropriate strategy should include strategic completion of available tools, which have improved remarkably in recent times, to ensure aggressive control of malaria, and therefore a decrease in the burden of malaria in Uganda [
35].
Notes
-
CONFLICT OF INTEREST
The authors declare that they have no conflicts of interest related to this work.
ACKNOWLEDGMENTS
This work was supported by grants from the ChildFund (K2016-012), Korea. We are indebted to all the members of the ChildFund, Korean and Uganda. We also thank all members of the VHT and the health workers in Kyankwanzi district, Uganda for the collection of samples and their devotion to the success of the project.
Working group in ChildFund, Korea
Program Director: Ms. Pil Young Lee, Ms. Un Joung Choi
Program Manager: Ms. Yoo Kyung Jung, Mr. Sung Kyu Cheon
Project Officer: Mr. Chan Yang Park, Mr. Hyun Seok Kim, Ms. Inhae Lee
Working group in ChildFund, Uganda
Program Director: Mr. Moses Otai
Program Manager: Mr. Charles Luwaga
Monitoring and Evaluation Manager: Mr. Walter Okello
Regional Program Manager: Mr. Jenner Kanalo
Project Officer: Ms. Allen Nanyonga
Project Assistant- M&E: Ms. Dorothy Nabukeera
Project Assistant: Mr. Ssali Bogere
Fig. 1Map of Uganda showing Kiyuni Parish in Kyankwanzi district and neighboring Kiboga district.
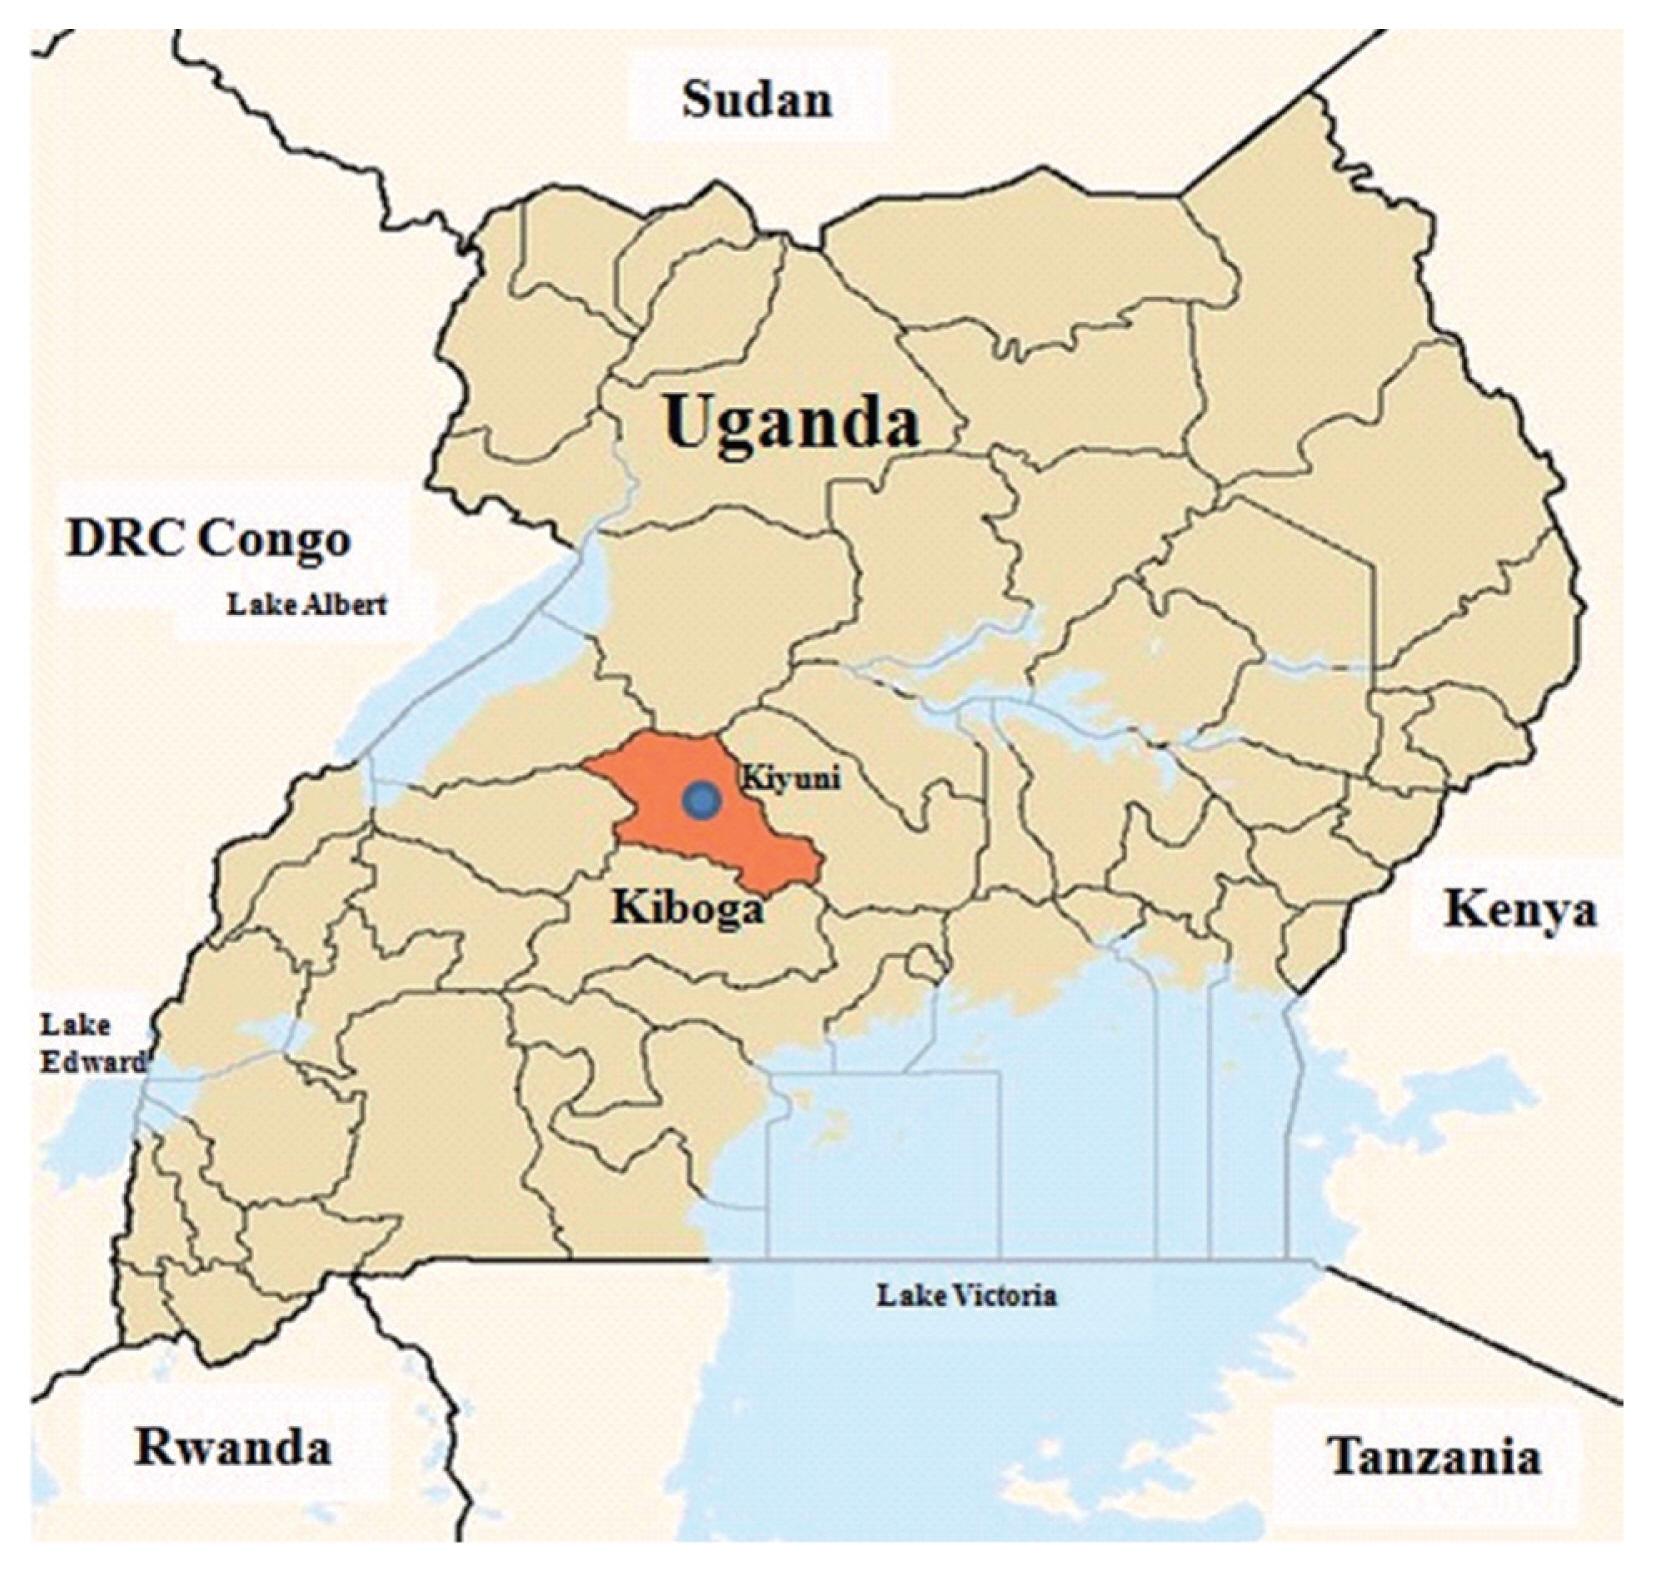
Table 1Details of each village population screened and detected by active case detection from February 2015 to January 2017 with rapid diagnosis tests
Table 1
|
Name of village (Total population*) |
RDT |
1st ACD (%) |
2nd ACD (%) |
3rd ACD (%) |
4th ACD (%) |
5th ACD (%) |
6th ACD (%) |
|
Bulyanzige (792) |
Positive |
136 (26.8) |
65 (23.6) |
58 (17.1) |
111 (29.6) |
34 (14.1) |
51 (18.2) |
|
Negative |
370 (73.1) |
210 (76.4) |
281 (82.9) |
264 (70.4) |
208 (85.9) |
230 (81.8) |
|
Total |
506 |
275 |
339 |
375 |
242 |
281 |
|
|
Kikandwa (364) |
Positive |
52 (19.3) |
36 (22.9) |
64 (34.8) |
80 (41.2) |
27 (16.9) |
33 (21.7) |
|
Negative |
218 (80.7) |
121 (77.1) |
120 (65.2) |
114 (58.8) |
133 (83.1) |
119 (78.3) |
|
Total |
270 |
157 |
184 |
194 |
160 |
152 |
|
|
Kikubya (1,764) |
Positive |
204 (26.6) |
51 (21.3) |
115 (24.0) |
278 (39.2) |
129 (20.1) |
91 (20.9) |
|
Negative |
562 (73.4) |
188 (78.7) |
365 (76.0) |
431 (60.8) |
507 (79.9) |
345 (79.1) |
|
Total |
766 |
239 |
480 |
709 |
636 |
436 |
|
|
KiyuniCentral (817) |
Positive |
33 (7.7) |
9 (4.4) |
55 (20.5) |
75 (22.0) |
26 (10.2) |
17 (5.9) |
|
Negative |
395 (92.3) |
194 (95.6) |
213 (79.5) |
266 (78.0) |
229 (89.8) |
272 (94.1) |
|
Total |
428 |
203 |
268 |
341 |
255 |
289 |
|
|
KyerereEast (716) |
Positive |
120 (22.9) |
54 (13.0) |
70 (17.2) |
107 (51.0) |
30 (7.3) |
32 (9.7) |
|
Negative |
403 (77.1) |
360 (87.0) |
338 (82.8) |
103 (49.0) |
383 (92.8) |
298 (90.3) |
|
Total |
523 |
414 |
408 |
210 |
413 |
330 |
|
|
KyerereNorth (565) |
Positive |
30 (9.3) |
22 (8.8) |
80 (25.1) |
73 (22.3) |
42 (13.5) |
29 (11.4) |
|
Negative |
292 (90.7) |
227 (91.2) |
239 (74.9) |
245 (77.7) |
269 (86.5) |
226 (88.6) |
|
Total |
322 |
249 |
319 |
318 |
311 |
255 |
|
|
Total (5,017) |
Positive |
575 (20.4) |
237 (15.4) |
442 (22.1) |
724 (33.7) |
288 (14.3) |
253 (14.5) |
|
Negative |
2,240 (79.6) |
1,300 (84.6) |
1,556 (77.9) |
1,423 (66.3) |
1,729 (85.7) |
1,490 (85.5) |
|
Total |
2,815 |
1,537 |
1,998 |
2,147 |
2,017 |
1,743 |
Table 2Details of the malaria patients screened and detected by ACD
Table 2
|
1st ACD |
2nd ACD |
Total |
|
Positive |
Negative |
Non-tested |
|
Positive |
101 |
203 |
271 |
575 |
|
Negative |
136 |
1,095 |
1,009 |
2,240 |
|
Non-tested |
0 |
2 |
2,200 |
2,202 |
|
Total |
237 |
1,300 |
3,480 |
5,017 |
|
2nd ACD |
3rd ACD |
Total |
|
Positive |
Negative |
Non-tested |
|
Positive |
62 |
85 |
90 |
237 |
|
Negative |
151 |
707 |
442 |
1,300 |
|
Non-tested |
229 |
764 |
2,487 |
3,480 |
|
Total |
442 |
1,556 |
3,019 |
5,017 |
|
3rd ACD |
4th ACD |
Total |
|
Positive |
Negative |
Non-tested |
|
Positive |
143 |
128 |
171 |
442 |
|
Negative |
262 |
676 |
618 |
1,556 |
|
Non-tested |
319 |
619 |
2,081 |
3,019 |
|
Total |
724 |
1,423 |
2,870 |
5,017 |
|
4th ACD |
5th ACD |
Total |
|
Positive |
Negative |
Non-tested |
|
Positive |
110 |
359 |
255 |
724 |
|
Negative |
86 |
701 |
636 |
1,423 |
|
Non-tested |
92 |
669 |
2,109 |
2,870 |
|
Total |
288 |
1,729 |
3,000 |
5,017 |
|
5th ACD |
6th ACD |
Total |
|
Positive |
Negative |
Non-tested |
|
Positive |
45 |
130 |
113 |
288 |
|
Negative |
135 |
900 |
694 |
1,729 |
|
Non-tested |
73 |
460 |
2,467 |
3,000 |
|
Total |
253 |
1,490 |
3,274 |
5,017 |
Table 3Percentages for the conversion status of the diagnostic results detected by ACD from February 2015 to January 2017
Table 3
|
1st→2nd (%) |
2nd→3rd (%) |
3rd→4th (%) |
4th→5th (%) |
5th→6th (%) |
|
Positive→Positive |
33.2 |
42.2 |
52.8 |
23.5 |
25.7 |
|
Negative→Negative |
89.0 |
82.4 |
72.1 |
89.1 |
87.0 |
|
Positive→Negative (Negative conversion rate) |
66.8 |
57.8 |
47.2 |
76.6 |
74.3 |
|
Negative→Positive (Positive conversion rate) |
11.1 |
17.6 |
27.9 |
10.1 |
13.3 |
Table 4Details of conversion status depending on the age groups screened and detected by ACD from February 2015 to January 2017
Table 4
|
Year groups |
Group |
1st→2nd (%) |
2nd→3rd (%) |
3rd→4th (%) |
4th→5th (%) |
5th→6th (%) |
|
<5 years |
Negative conversion rate (Positive→Negative) |
65.8 |
51.9 |
36.4 |
73.7 |
69.6 |
|
Positive conversion rate (Negative→Positive) |
15.9 |
23.9 |
41.2 |
13.5 |
19.3 |
|
Sample No./Total sample No. |
400/689 |
278/400 |
342/501 |
375/539 |
359/474 |
|
|
5–10 years |
Negative conversion rate |
59.6 |
51.8 |
37.6 |
74.9 |
71.7 |
|
Positive conversion rate |
16.1 |
24.5 |
40.0 |
15.5 |
19.6 |
|
Sample No./Total sample No. |
737/1,239 |
497/916 |
608/987 |
659/968 |
619/827 |
|
|
>10 years |
Negative conversion rate |
0.0 |
76.5 |
65.2 |
82.8 |
78.7 |
|
Positive conversion rate |
6.8 |
12.4 |
16.0 |
7.2 |
6.5 |
|
Sample No./Total sample No. |
766/1,510 |
486/767 |
563/1,024 |
539/961 |
537/846 |
|
|
Total |
Negative conversion rate |
66.8 |
57.8 |
47.2 |
76.6 |
74.3 |
|
Positive conversion rate |
11.0 |
17.6 |
27.9 |
10.9 |
13.0 |
|
Sample No./Total sample No. |
1,535/2,815 |
1,005/1,537 |
1,209/1,998 |
1,256/2,147 |
1,210/1,743 |
References
- 1. Roll Back Malaria. The Global Malaria Action Plan: For a Malaria-Free World. Geneva, Switzerland. World Health Organization; 2008.
- 2. Arrow KJ, Panosian CB, Gelband H. Saving Lives, Buying Time: Economics of malaria drugs in an age of resistance. Washinton DC. USA National Academic Press; 2004.
- 3. World Health Organization. World Malaria Report 2016. Geneva, Switzerland. World Health Organization; 2016.
- 4. Mendis K, Rietveld A, Warsame M, Bosman A, Greenwood B, Wernsdorfer WH. From malaria control to eradication: the WHO perspective. Trop Med Int Health 2009;14:802-809.
- 5. World Health Organization. Uganda neonatal and child health profile. [Internet]; 2015. Available from: http://who.int/maternal_child_adolescent/epidemiology/profiles/neonatal_child/uga.pdfAccessed on 20 Feb 2017.
- 6. Breman JG, Alilio MS, Mills A. Conquering the intolerable burden of malaria: what’s new, what’s needed: a summary. Am J Trop Med Hyg 2004;71(suppl):1-15.
- 7. Mutero CM, Kramer RA, Paul C, Lesser A, Miranda ML, Mboera LEG, Kiptui R, Kabatereine N, Ameneshewa B. Factors influencing malaria control policy-making in Kenya, Uganda and Tanzania. Malaria J 2014;13:305.
- 8. Greenwood BM. Control to elimination: implications for malaria research. Trends in Parasitol 2008;24:449-454.
- 9. Kassam R, Collins JB, Liow E, Rasool N. Narrative review of current context of malaria and management strategies in Uganda (Part I). Acta Tropica 2015;152:252-268.
- 10. Roll Back Malaria. Global Strategic Plan Roll Back Malaria. p. 2005-2015. Geneva, Switzerland. World Health Organization; 2005.
- 11. Lengeler C. Insecticide-treated nets for malaria control: real gains. Bull World Health Organ 2004;82:84.
- 12. Malaria Control Programme Ministry of Health. Uganda malaria control strategic plan: 2005/06–2009/10. [Internet]; Available from: http://www.healthyfutures.eu/images/healthy/deliverables/D5.1/Uganda/uganda%20national%20malaria%20control%20strategy%202005%20-%202010.pdfAccessed on 20 Feb 2017.
- 13. President’s Malaria Initiative. Uganda Malaria Operational Plan FY; 2016. [Internet]; Available from: https://www.pmi.gov/docs/default-source/default-document-library/malaria-operational-plans/fy16/fy-2016-uganda-malaria-operational-plan.pdf?sfvrsn=5
- 14. Musoke D, Miiro G, Karani G, Morris K, Kasasa S, Ndejjo R, Musoke MB. Promising perceptions, divergent practices and barriers to integrated malaria prevention in Wakiso district, Uganda: a mixed methods study. PLoS One 2015;10:e0122699.
- 15. Fegan GW, Noor AM, Akhwale WS, Cousens S, Snow RW. Effect of expanded insecticide-treated bednet coverasge on child survival in rural Kenya: a longitudinal study. Lancet 2007;370:1035-1039.
- 16. Ng’ang’a PN, Shililu J, Jayasinghe G, Kimani V, Kabutha C, Kabuge L, Kabiru E, Githure J, Mutero C. Malaria vector control practices in an irrigated rice agro-ecosystem in central Kenya and implications for malaria control. Malaria J 2008;7:146.
- 17. Awor P, Wamani H, Bwire G, Jagoe G, Peterson S. Private sector drug shops in integrated community case management of malaria, pneumonia, and diarrhea in children in Uganda. Am J Trop Med Hyg 2012;87:92-96.
- 18. ACTwatch Group. Kaula H, Buyungo P, Opigo J. Private sector role, readiness and performance for malaria case management in Uganda, 2015. Malaria J 2017;16:219.
- 19. Cohen J, Dupas P, Schaner S. Price subsidies, diagnostic tests, and targeting of malaria treatment: evidence from a randomized controlled trial. Am Econ Rev 105:609-645.
- 20. Hutchinson E, Hutchison C, Lal S, Hansen K, Kayendeke M, Nabirye C, Magnussen P, Clarke SE, Mbonye A, Chandler CIR. Introducing rapid tests for malaria into the retail sector: what are the unintended consequences? BMJ Glob Health 2017;2:e000067.
- 21. Kleinman A. Four social theories for global health. Lancet 2010;375:1518-1519.
- 22. Moorthy VS, Reed Z, Smith PG. MALVAC 2008: Measures of efficacy of malaria vaccines in phase 2b and phase 3 trials-scientific, regulatory and public health perspectives. Vaccine 2009;27:624-628.
- 23. Tiono AB, Kangoye DT, Rehman AM, Kargougou DG, Kaboré Y, Diarra A, Ouedraogo E, Nébié I, Ouédraogo A, Okech B, Milligan P, Sirima SB. Malaria incidence in children in South-West Burkina Faso: comparison of active and passive case detection methods. PLoS One 2014;9:e86936.
- 24. Taremwa IM, Ashaba S, Adrama HO, Ayebazibwe C, Omoding D, Kemeza I, Yatuha J, Turuho T, MacDonald NE, Hilliard R. Knowledge, attitude and behavior towards the use of insecticide treated mosquito nets among pregnant women and children in rural Southwestern Uganda. BMC Public Health 2017;17:794.
- 25. Okello PE, Okello PE, Van Bortel W, Byaruhanga AM, Correwyn A, Roelants P, Talisuna A, D’Alessandro U, Coosemans M. Variation in malaria transmission intensity in seven sites throughout Uganda. Am J Trop Med Hyg 2006;75:219-225.
- 26. Wielgosz B, Mangheni M, Tsegai D, Ringler C. Malaria and agriculture: a review of the literature with a focus on the potential of integrated pest and vector management for Uganda. Washinton DC, USA. International Food Policy Research Institute; 2012. IF-PRI Discussion Paper 01232.
- 27. Chong CK, Cho PY, Na BK, Ahn SK, Kim JS, Lee JS, Lee SK, Han ET, Kim HY, Park YK, Cha SH, Kim TS. Evaluation of the accuracy of the EasyTestTM Malaria Pf/Pan Ag, a rapid diagnostic test, in Uganda. Korean J Parasitol 2014;52:501-505.
- 28. ACTwatch. ACTwatch Baseline and Endline Household Survey Results 2009–2012; Benin, Democratic Republic of Congo, Madagascar; Nigeria, Uganda, Zambia: [Internet]2013. Available from: http://www.actwatch.info/sites/default/files/content/publications/attachments/ACTwatch%2520HH%2520Report%2520and%2520Endline.pdfAccessed on 12 Jan 2014.
- 29. Bastiaens GJH, Bousema T, Leslie T. Scale-up of malaria rapid diagnostic tests and artemisinin-based combination therapy: Challenges and perspectives in sub-Saharan Aftrica. PLoS Med 2014;11:1-4.
- 30. Winstanley P, Ward S, Snow R, Breckenridge A. Therapy of falciparum malaria in sub-Saharan Africa: from molecule to policy. Clin Microbiol Rev 2004;17:612-637.
- 31. Yeka A, Gasasira A, Mpimbaza A, Achan J, Nankabirwa J, Nsobya S, Staedke SG, Donnelly MJ, Wabwire-Mangen F, Talisuna A, Dorsey G, Kamya MR, Rosenthal PJ. Malaria in Uganda: Challenges to control on the long road to elimination I. Epidemiology and current control efforts. Acta Tropica 2012;121:184-195.
- 32. Tatem AJ, Smith DL, Gething PW, Kabaria CW, Snow RW, Hay SI. Ranking of elimination feasibility between malaria-endemic countries. Lancet 2010;376:1579-1591.
- 33. Magisha F, Arinaitwe J. Sleeping arrangements and mosquito net use among under-fives. Results from the Uganda Demographic and Health Survey. Malar J 2003;2:40.
- 34. Gimnig JE, Vulule JM, Lo TQ, Kamau L, Kolczak MS, Phillips-Howard PA, Methenge EM, ter Kuile FO, Nahlen BL, Hightower AW, Hawley WA. Impact of permethrin-treated bed nets on entomologic indices in an area of intense year-round malaria transmission. Am J Trop Med Hyg 2003;68:16-22.
- 35. Uganda Bureau of Statistics, ICF Macro. Uganda Malaria Indicator Survey 2009. [Internet]; 2010. Available from: https://dhsprogram.com/pubs/pdf/MIS6/MIS6.pdf