Abstract
The intracellular parasite Babesia microti is among the most significant species causing human babesiosis and is an emerging threat to human health worldwide. Unravelling the pathogenic molecular mechanisms of babesiosis is crucial in developing new diagnostic and preventive methods. This study assessed how priming with B. microti surface antigen 1 (BHSA 1) and seroreactive antigen 5-1-1 (BHSA 5-1-1) mediate protection against B. microti infection. The results showed that 500 μg/ml rBMSA1 and rBMSA5-1-1 partially inhibited the invasion of B. microti in vitro by 42.0±3.0%, and 48.0±2.1%, respectively. Blood smears revealed that peak infection at 7 days post-infection (dpi) was 19.6%, 24.7%, and 46.7% in the rBMSA1, rBmSA5-1-1, compared to the control groups (healthy mice infected with B. microti only), respectively. Routine blood tests showed higher white blood cell, red blood cell counts, and haemoglobin levels in the 2 groups (BMSA1 and BMSA5 5-1-1) than in the infection control group at 0–28 dpi. Moreover, the 2 groups had higher serum interferon-γ, tumor necrosis factor-α and Interleukin-17A levels, and lower IL-10 levels than the infection control group throughout the study. These 2 potential vaccine candidate proteins partially inhibit in vitro and in vivo B. microti infection and enhance host immunological response against B. microti infection.
-
Key words: Babesia microti, BMSA1, BmSA5-1-1, immunological response, vaccine candidate
Introduction
Babesiosis, caused by tick-borne apicomplexan parasites of the genus
Babesia, has become an emerging global threat to human health. Many countries have recently designated babesiosis as an infectious disease that must be legally reported [
1]. Infected
Ixodes tick bites and, less frequently, blood transfusion or transplacental transmission cause human babesiosis [
2–
4].
Babesia pathogens belong to the phylum Apicomplexa, class Sporozoasida, subclass Piroplasmasina, Order Piroplasmida, family Babesiidae and Genus
Babesia [
5]. The 4 most important human babesiosis pathogens include
Babesia microti,
B. venatorum,
B. divergens, and
B. duncani. Nonetheless,
B. microti is the most common agent in the United States and China [
6–
10].
Babesia microti, an intracellular parasite, is transmitted to humans through saliva when an infected tick sucks blood from the host. The sporozoites then infect the red blood cells of the host [
5]. Next,
B. microti merozoites develop and proliferate inside host erythrocytes, causing haemolysis. The newly released merozoites subsequently infect new erythrocytes, resulting in high fever, anaemia, jaundice, haemoglobinuria, and other clinical symptoms [
5].
Understanding the molecular mechanisms by which
B. microti merozoites invade erythrocytes is key to developing new diagnostic and preventive methods. However, the molecules that block
B. microti entry into erythrocytes are still unknown. Previous studies showed that infective
Babesia merozoites invade host erythrocytes using glycosylphosphatidylinositol (GPI)-anchored proteins [
11,
12]. For instance, the
B. microti surface antigen 1 (BMSA1), also named BmGPI12, is among the most important diagnostic markers for detecting
B. microti infection. A highly sensitive and specific ELISA method for
B. microti infection is based on BMSA1 [
13–
15].
In another case, the seroreactive antigen 5-1-1 (BMSA5-1-1) soluble protein is expressed on the outer surface of
B. microti. BMSA5-1-1 is a potentially accurate target for diagnosing babesiosis [
16]. BMSA5-1-1 is homologous to one of the 19
B. microti GPI proteins [
14,
16]. However, the immune protective function of BMSA1 and BMSA5-1-1 to the host against
B. microti infection in vivo is still unclear. Therefore, this study investigated the immune protective function of BMSA1 and BMSA5-1-1 against
B. microti infection in mice.
Materials and Methods
Ethical approval
The Laboratory Animal Welfare & Ethics Committee of the Chinese Centre for Tropical Diseases Research approved the animal experiments (permit number: IPD-2019-14).
Infection of B. microti in the mouse
Six BALB/c mice from the Shanghai Experimental Animal Center, Chinese Academy of Sciences, were inoculated intraperitoneally with 100 μl of mouse blood infected with B. microti Peabody strain (ATCC, PRA-99) (20.0% of erythrocytes harboured the parasites). Once 50 to 60.0% of the RBCs became infected, whole blood was collected in an anticoagulant tube and stored at −80°C until further use. Thin Giemsa-stained blood films were prepared to determine the infection rate of B. microti in mice. Next, 1,000 RBCs were counted in a peripheral blood smear using a Light microscope (BX53, OLYMPUS, Japan) at 1,000×, 10 scope. The infection rate (%)=the infected RBC/the 1,000 whole RBC. For the negative blood smear, 100 fields were counted to confirm its negativity. The average infection rate of the 3 slides was the infection rate of this group on each day. Mice were reared at the Animal Care Centre of the National Institute of Parasitic Diseases of China CDC (Chinese Centre for Tropical Diseases Research).
In vitro cultivation of B. microti-infected RBC pretreated with rBMSA1 and rBMSA5-1-1
Recombinant BMSA1 and BMSA5-1-1 proteins (rBMSA1 and rBMSA5-1-1) were expressed as previously described [
16]. The BMSAl gene (GenBank accession no: XP_012648767.1) was cloned in PGEX-4T-3 and expressed in
E. coli BL21 (DE3). The recombinant BMSAl-GST measured approximately 59 kDa. Next, 378 bp of BmSA5-1-1 (Gen Bank No.: FJ440563.1) was inserted into the pET28a vector using BamHI and XhoI restriction enzymes. The inserted gene was expressed and purified in
E. coli BL21 (DE3); the recombinant BmSA5-1-1 protein was 15 kDa [
16]. The sequences, cloning and expression process of BMSAl and BmSA5-1-1 are captured in the
supplementary materials.
The inhibition of erythrocyte invasion by rBMSA1 and rBMSA5-1-1 was evaluated using flow cytometry (MoFloXDP, Beckman, USA). The difference in the relative infection rate between the experimental and the control groups was performed as previously described [
17,
18]. The relative invasion rate=infection rate of the experimental group/infection rate of the control group. Infected erythrocytes were cultured with uninfected cells (1:2) in a 5.0% CO
2, 37°C incubator in a Puck, Saline Glucose (PSG) plus extra glucose (G)culture medium ((PSG+G), main components: PSG, Glucose, antibiotic). rBMSA1 and rBMSA5-1-1 were added to yield final concentrations of 500, 250, 100, 50, and 10 μg/ml. BSA or 10 μl of HL-20 medium alone (blank control) were added to 2 parallel cultures as negative controls. The protein-erythrocyte mixture was incubated at 37°C, 5.0% CO
2 for 48 h, to allow
B. microti to infect new red blood cells in the culture medium. Thereafter, 40 μl of ethidium bromide was added to the mixture and further incubated for 0.5 h at room temperature in the dark. The infection rates (the ratio of positive cells versus the total number of cells) were calculated using flow cytometry (MoFlo XDP), and 50,000 cells were collected per sample [
17,
18]. Three replicates of each concentration per sample were analysed twice to ensure data accuracy.
Forty-two female BALB/c mice were subcutaneously injected with a mixture of adjuvant-conjugated purified rBMSA1 or rBMSA5-1-1, respectively. The mice received 2 booster-doses twice at 2-week intervals, totalling to 3 immunisations. Tail blood was collected (100 μl), and the immune titres were measured using ELISA. Briefly, 1 μg/ml of rBMSA1 or rBMSA5-1-1 antigen was added to the ELISA plate (Corning, NY, USA), followed by 100 μl diluted sera (1:1,250, 1:2,500, 1:5,000, 1:10,000, 1:20,000, 1:40,000, 1:80,000) (mice sera collected 28 days after the first immunisation) and incubated for 0.5 h at 37°C. Rabbit anti-mouse HRP secondary antibody was added to the mixture and incubated for 0.5 h at 37°C. Next, TMB substrate solution was added and incubated at 37°C for 15 min. An ELISA reader (iMarker Microplate Reader Bio-Rad, Foster City, CA, USA) was used to detect absorbance (abs) values. Sample abs was determined for 2 replicates per sample and the negative control sample’s above 2.1 were considered as cut-off value; abs values ≥cut-off value was considered as positive.
Babesia microti challenge
The mice were injected intraperitoneally with
B. microti 2 weeks after the third booster injection, as previously described [
18]. Briefly, BALB/c mice were randomly divided into 4 groups (18 mice/group). The groups included normal control (healthy mice without any treatment), infection control (healthy mice infected with
B. microti only), rBMSA1 and rBmSA5-1-1 (mice were subcutaneously injected with rBMSA1 or rBMSA5-1-1 before challenging with
B. microti). The negative control sera were collected before the initial injection with the protein mixture.
White blood cell and red blood cell counts and haemoglobin levels were determined using the Mindray BC-5300 Vet automated haematology (Mindray company, Guangdong Province, China) as previously described (3 mice/group/day) [
18].
The concentration of cytokines in the serum was measured using the Cytometric Beads Array method (CBA) method (BD Company, Franklin Lakes City, NJ, USA), as previously described [
18]. Briefly, standard cytokine samples were prepared using standard cytokine pellets. Next, all cytokine capture microspheres were mixed in a flow tube, vortexed well, and marked as mixed “microspheres”. The mixed microspheres were centrifuged for 5 min at room temperature at 200 g, and the supernatant was removed. An equal volume of serum enhancer was added to the precipitate before incubation at room temperature in the dark for 30 min. The “mixed microspheres” were resuspended before adding the test samples and 50 μl antibodies with PE-labelled cytokines. The mixture was incubated at room temperature in darkness for 3 h. The samples were cleaned using a cleaning solution, resuspended and tested using the flow cytometer. The results were collected in the flow cytometry standard (FCS) format. Standard curve plotting and data analysis was performed using the CBA-specific software V1.0 (FCAP Array, BD Company).
Continuous data were expressed as means±standard error of the mean (SE). The PASW Statistics 18.0 software was used for statistical analysis, and χ2 Test was used for rate comparison. Values with P<0.05 were considered statistically significant.
Results
rBMSA1 and rBmSA5-1-1 inhibit the invasion of B. microti in vitro
Different concentrations of recombinant BMSA1 and BmSA5-1-1 proteins were added to the culture medium to investigate their effects in vitro on
B. microti invasion. BmSA5-1-1 and BMSA1 inhibit
B. microti invasion in a concentration-dependent manner. The inhibitory effect was strongest when the protein concentration was 500 μg/ml, where the relative
B. microti invasion rates (infection rate of the experimental group/infection rate of the control group) were 42.0±3.0% and 48.0±2.1% in BmSA5-1-1 and BMSA1 media, respectively. At 250, 100, and 50 μg/ml of BMSA1 and BmSA5-1-1, the relative infection rates were 56.0±1.7%, and 60.0±2.5%, 68±2.5 and 71.0±1.1%, 79±1.5, and 83.0±2.3%, respectively. However, 10 μg/ml generated relative infection rates of 93.0±1.3% and 95.0±2.2%, implying no obvious inhibiting effects (
Fig. 1).
The ELISA results showed that 21 BMSA1-immunised mice produced anti-BMSA1 antibodies. Six produced extremely high antibody titres (sera diluted as 1:80,000), 9 produced very high antibody titres (sera diluted as 1:40,000) and 6 produced high antibody titres (sera diluted as 1:5,000 to 1:10,000). Another 21 BMSA5-1-1-immunised mice produced these quantities of anti-BMSA5-1-1 antibodies: sera diluted as 1:80,000 in 7 (mice produced extremely high antibody titres), sera diluted as 1:40,000 in 10 (mice produced very high antibody titres), and sera diluted as 1:5,000 to 1:10,000 in 4 mice (mice produced high antibody titres), respectively. Both groups met the requirements for subsequent infection; thus, 18 mice with the highest titres were selected from each group for follow-up experiments.
Infection rate of mice immunised with BMSA1 and BMSA5-1-1 proteins
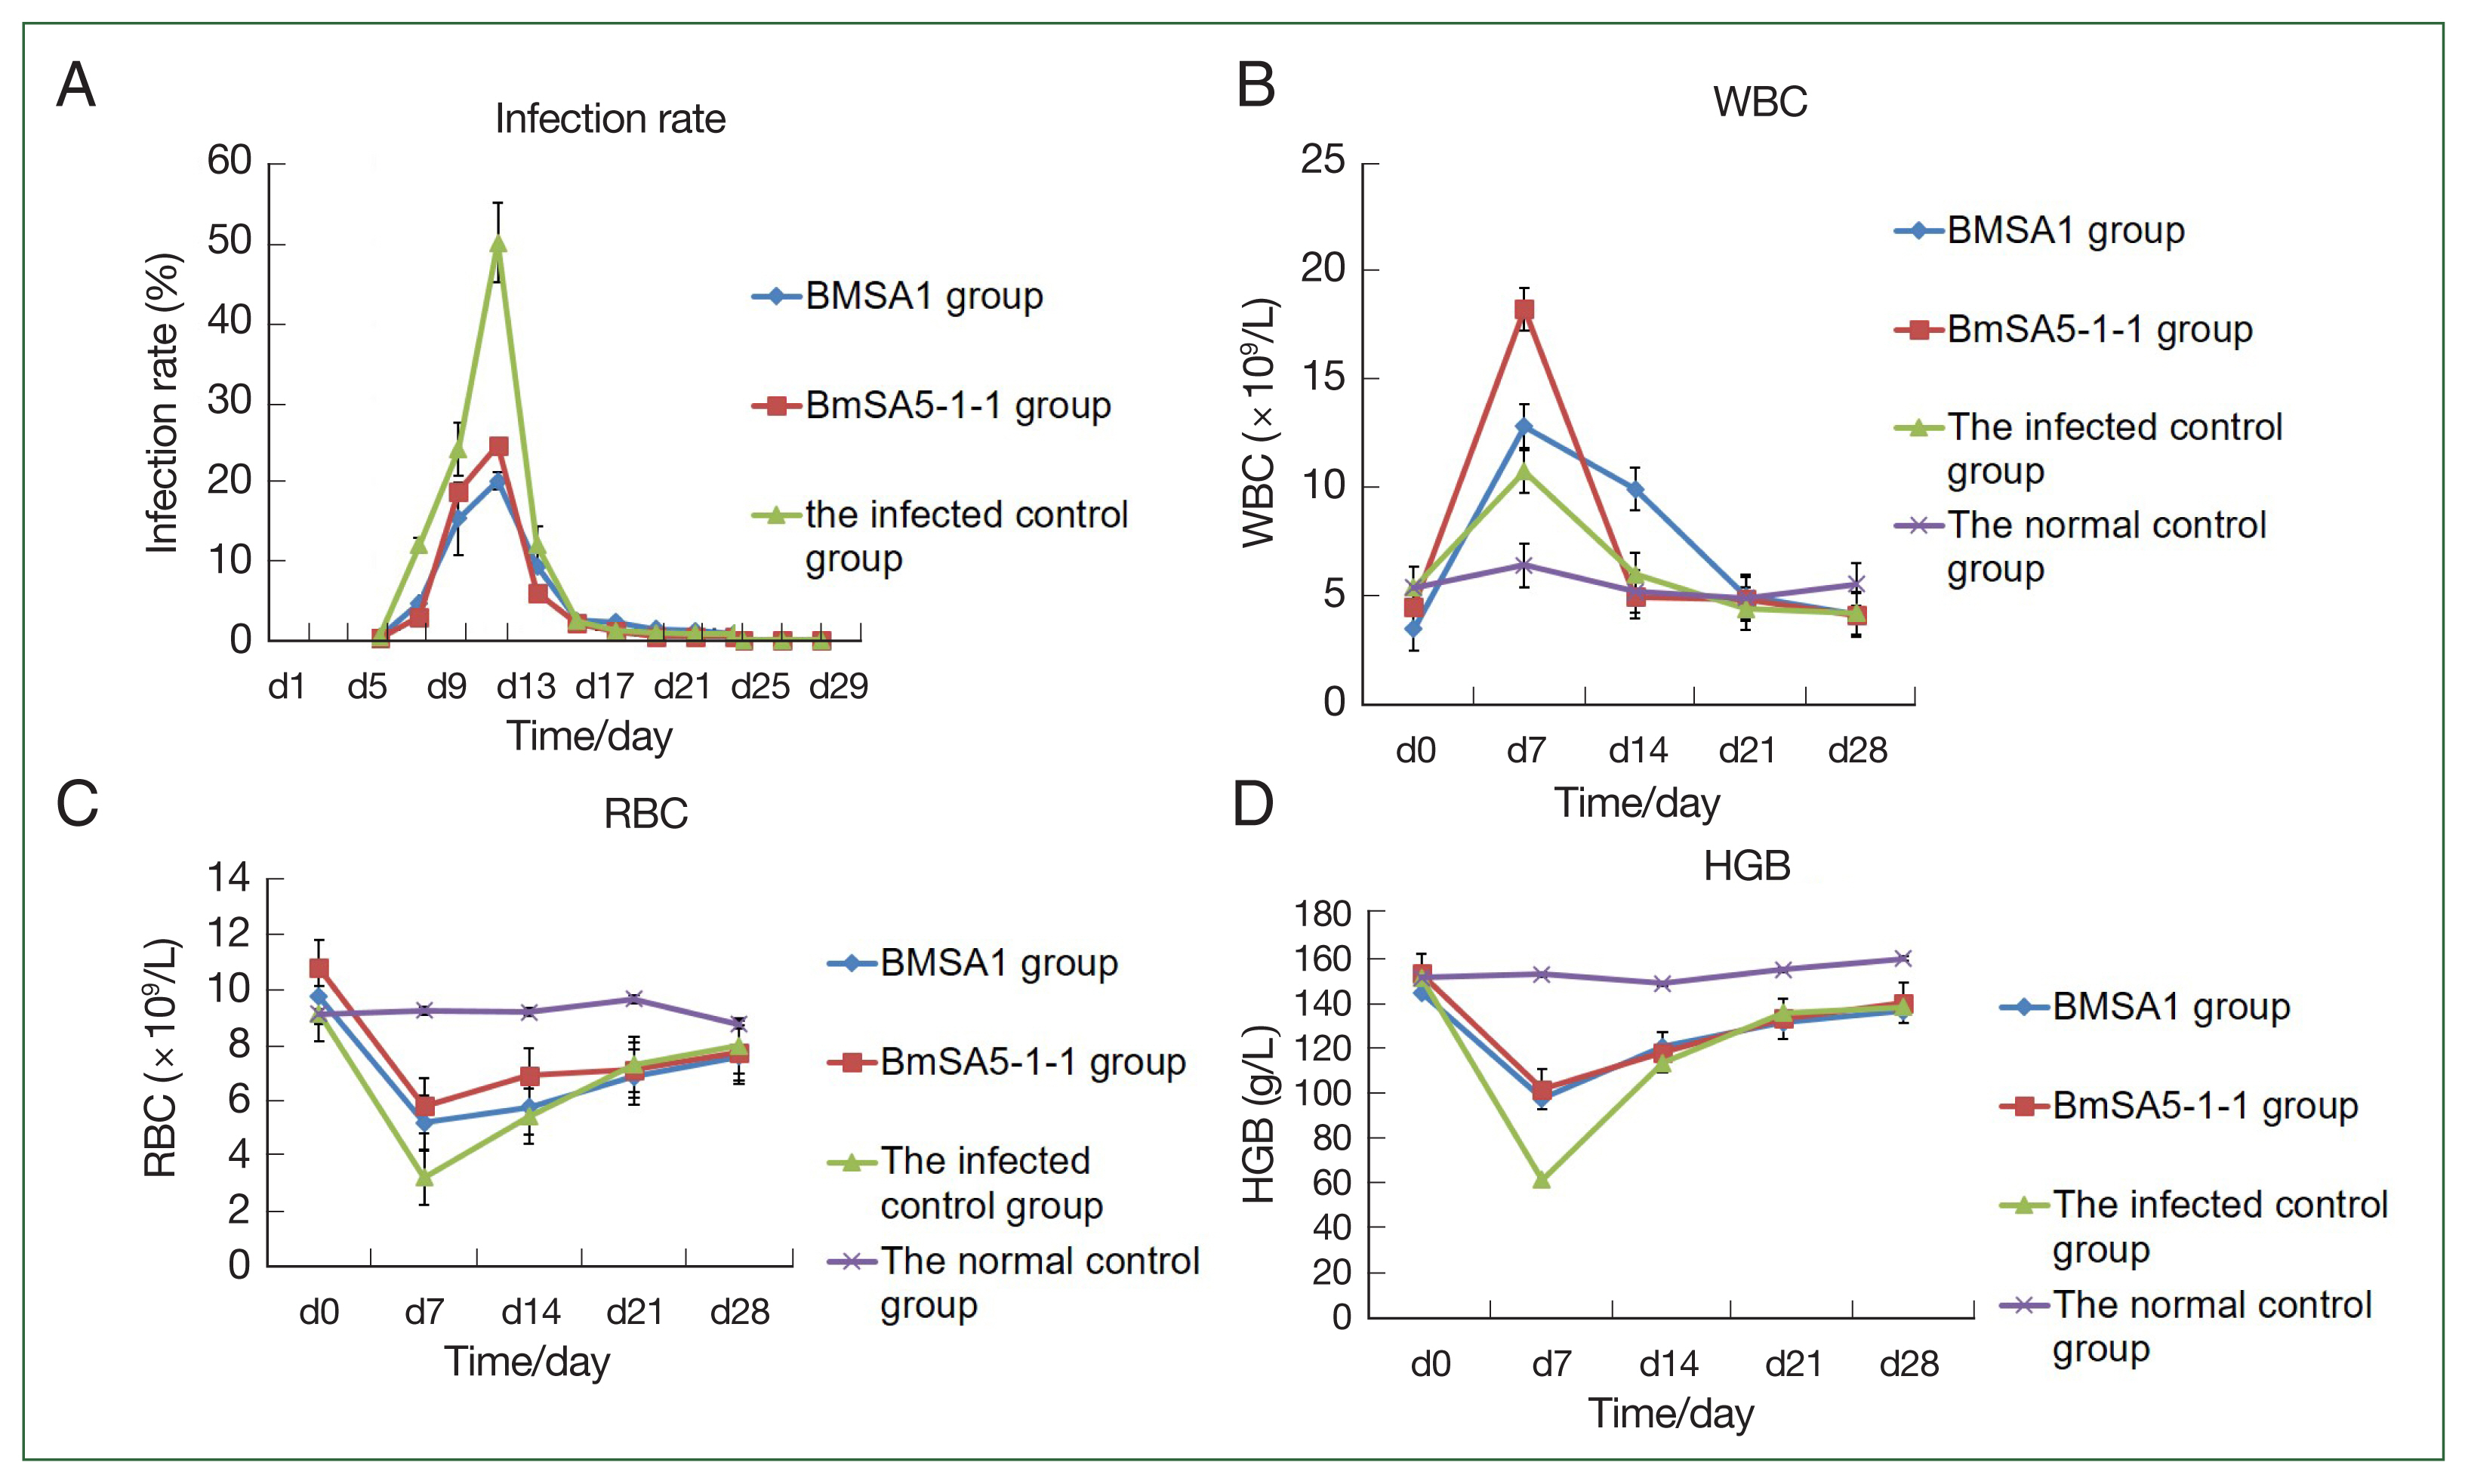
Blood smears revealed that peak infection occurred at 19.6%, 24.7%, and 46.7% in the rBMSA1, rBmSA5-1-1, compared to the infected control groups, respectively.
At 3, 5, 7, and 9 post-infection days (dpi), the infection rates of BMSA1or BMSA5-1-1-immunised mice were significantly lower than that of the infected control group (BMSA1: χ2=171.78, 60.46, 493.31, and 31.21, P<0.01, BMSA5-1-1: χ2=261.14, 19.69, 493.31, and 31.21, P<0.01, respectively). However, the infection rate gradually decreased to 0, 21, and 29 dpi (for BMSA1 group) and between 15 and 29 dpi (for BMSA5-1-1-immunised mice), respectively.
At 9, 13, 15, and 17 dpi, the infection rate of BMSA1-immunised was significantly higher than the BMSA5-1-1-immunised mice (χ
2=23.97, 15.61, 13.20, 7.76,
P<0.01). Between 21 and 29 dpi, the infection rate in the 2 groups gradually decreased to 0 (
Fig. 2A).
The number of white blood cells in the BMSA1- and BMSA5-1-1-immunised groups and infected control at 7 dpi was (12.8±3.0)×10
9/L, (18.2±2.5)×10
9/L, and (10.7±3.2)×10
9/L, respectively. After 7 dpi, the number of white blood cells gradually decreased to levels before infection, and by 28 dpi, the values were (4.1±0.4)×10
9/L, (4.0±0.5)×10
9/L, and (4.1±1.2)×10
9/L, respectively. However, the number of white blood cells in the normal control groups was relatively stable throughout the experiment, and the value was (5.5±0.4) ×10
9/L at 28 dpi (
Fig. 2B).
The number of red blood cells in the BMSA1-, BMSA5-1-1-immunised mice and the infected control decreased, and by 7 dpi, the values were 5.2±1.5×10
12/L, 5.8±0.5×10
12/L, and 3.2±1.1×10
12/L, respectively. Nonetheless, the number of red blood cells in the 3 groups gradually recovered over time. At 14 dpi, the number of red blood cells in the 3 groups was 5.7±0.6×10
12/L, 6.9±0.3×10
12/L, and 5.4±0.1×10
12/L, respectively. By 21 dpi, the values were 6.8±0.4×10
12/L, 7.1±0.5×10
12/L, and 7.3±0.2×10
12/L, respectively. However, the number of red blood cells in the 3 groups at 28 dpi was still lower than before the infection (
Fig. 2C).
The haemoglobin content in the BMSA1 and BMSA5-1-1 immune groups and the infected control decreased to the lowest at 7 dpi (98±5.6, 102±5.5, and 62±6.3 g/L, respectively). Nevertheless, the haemoglobin content of the 3 groups gradually recovered over the infection time. At 14 dpi, the haemoglobin content of the 3 groups was 121±23.5, 118.3±9.5, and 113.6±7.3 g/L, respectively, and by 21 dpi, the values were 131.7±5.7, 133.3±5.5, and 136.0±5.3 g/L. However, the haemoglobin content of the 3 groups at 28 dpi was still lower than the level before infection (
Fig. 2D).
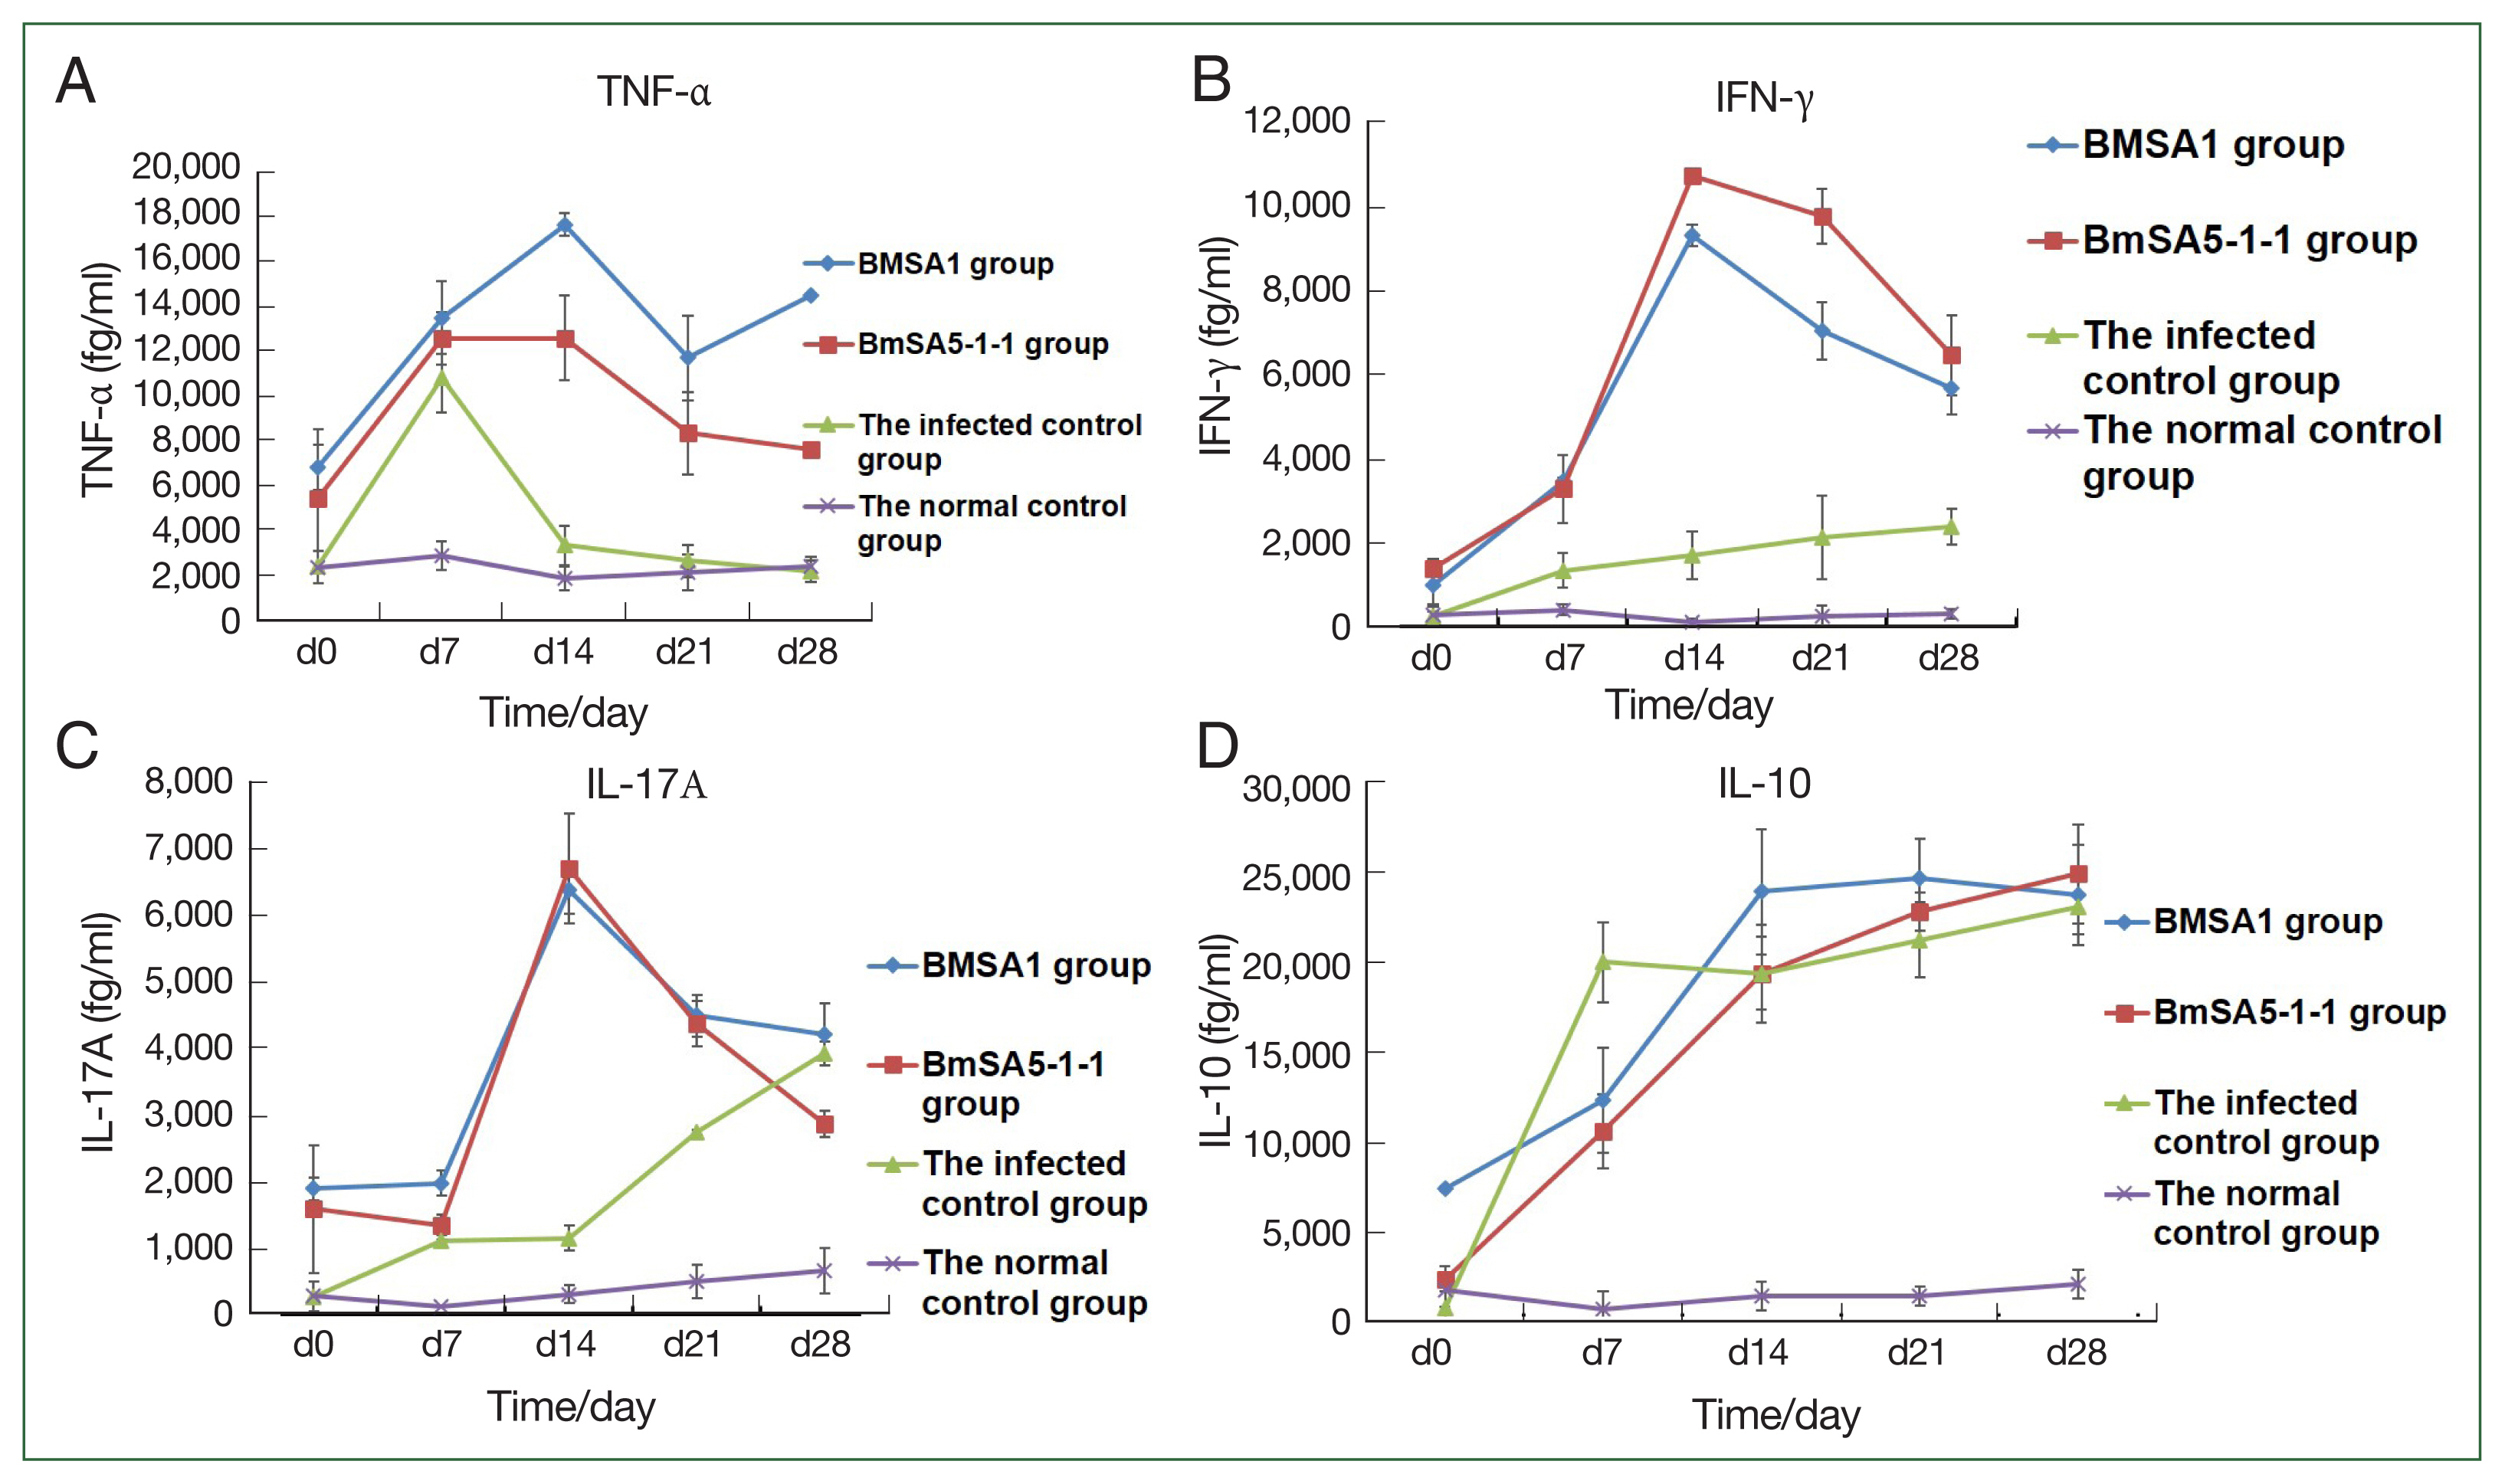
The expression of tumor necrosis factor-α (TNF-α) in BMSA1 and BMSA5-1-1-immunised mice rose sharply, peaking at 14 dpi ((17,639±507.7 fg/ml) and (12,579.0±1,890.9 fg/ml)). After that, the TNF-α expression level in the 2 groups gradually decreased, reaching 11,703±1,888.7 fg/ml at 21dpi in the BMSA1 group. After that, the expression level rose slowly, reaching the peak (14,498±588.6 fg/ml) at 28 dpi. In the BMSA5-1-1 group, the TNF- α level decreased to the lowest (7,599.1±160.5 fg/ml) at 28 dpi. However, the levels in both BMSA1 and BMSA5-1-1 immune groups were higher than the infected and healthy control groups. The TNF-α level in the infection control mice peaked at 7 dpi (10,799.2±1,555 fg/ml), then dropped sharply to 3,349.6±873 fg/ml on 14 dpi. That downward trend slowed to 2,633.1±742 and 2,179.4±481 fg/ml at 21 and 28 dpi, respectively, close to the levels in the normal control group (
Fig. 3A).
During the observation period, with the prolongation of infection time, the expression level of the serum IFN-γ in mice immunised with BMSA1 and BMSA5-1-1 was slightly higher, and the level of BMSA5-1-1 group was higher than that of the BMSA1 group. The expression of IFN-γ in BMSA1 and BMSA5-1-1-immunised mice peaked (9,382±11.4 and 10,735.5±269.2 fg/ml) at 14 dpi and reduced to 7,041±648.5, and 9,778.6±683.6, and 5,679±956.1, and 6,477.3±617.6 fg/ml at 21 and 28 dpi, respectively. These values were higher than the levels in the normal and infection control groups. The expression of IFN-γ increased in the infection control group, reaching the highest (2,385.1±442 fg/ml) at 28 dpi (
Fig. 3B), but IFN-γ measured 105.1±98.2, and 407.1±119.2 fg/ml in the normal control group.
Throughout the observation period, the level of IL-10 increased sharply in the infected control group, reaching 20,000.1±2,205.4 fg/ml at 7 dpi. By 14 and 21 dpi, the level was 19,389.1±2,031.1 and 21,251.1±2,085.9 fg/ml and peaked at 28 dpi (23,074.1±1,495.0 fg/ml). The levels in the BMSA1- and BMSA5-1-1-immunised groups were lower (12,325± 2,874 and 10,587.6±2,049.0 fg/ml) at 7 dpi. The level gradually increased in the BMSA1 group, reaching its peak (24,639±2,210 fg/ml) at 21 dpi. In contrast, IL-10 levels peaked (24,912.3±2,730.3 fg/ml) at 28 dpi in the BMSA5-1-1 immunization group (
Fig. 3C).
At 7 dpi, the expressions of IL-17A in the BMSA1 and BMSA5-1-1 immunised mice sera were low (1,978±183 and 1,350±150 fg/ml, respectively). However, IL-17A expression in the serum of BMSA1- and BMSA5-1-1-immunised groups increased sharply, peaking at 14 dpi (6,379±349 and 6,714±826 fg/ml, respectively). That pattern gradually decreased to 4,211±465 and 2,865±200 fg/ml at 28 dpi. In the infected control group, the expression level of IL-17A gradually increased to 2,740±39 and 3,929±181 fg/ml at 21 and 28 dpi, respectively (
Fig. 3D).
Discussion
BMSA1 is known as
B. microti glycosylphosphatidylinositol-anchored proteins 12 (BmGPI12), while BMSA5-1-1 is homologous to a
B. microti glycosylphosphatidylinositol (GPI) protein. BMSAl gene was recombined, expressed, and purified in
E. coli BL21 (DE3), and the band was 59 kDa, molecular weight. Moreover, the positive serum immunised with recombinant BMSAl could recognize the natural
B. microti protein [
16].
B. microti BmSA5-1-1 gene was recombined, expressed and purified in BL21 (DE3) competent cells, and the induced band was consistent with the expected molecular weight, 15 kDa. Furthermore, immunofluorescence antibody assays (IFA) localised the BmSA5-1-1 in
B. microti parasites to the surface of
B. microti [
16]. In this study, in vitro experiments revealed that rBMSA1 and rBMSA5-1-1 secreted proteins partially inhibit
B. microti invasion of host cells. These proteins play a similar role in other protozoa. For instance, merozoite surface protein 1 (MSP1) interacts with host erythrocytes to block the adhesion of
P. falciparum merozoites onto erythrocytes, thus inhibiting erythrocyte invasion [
19,
20].
Mice were subcutaneously injected with a mixture of adjuvant-conjugated purified rBMSA1 or rBMSA5-1-1, respectively. High titres of polyclonal antibodies were generated against rBMSA1 and rBmSA5-1-1. Moreover, the peak infection rate of mice immunised with BMSA1 and BMSA5-1-1 proteins was decreased compared to the infected control groups. This infection suggested that BMSA1 and BMSA5-1-1 proteins had an excellent immune protective effect on the host. At 9, 13, 15, and 17 dpi, the infection rate of BMSA1-immunised mice was significantly higher than the BMSA5-1-1-immunised, indicating that rBMSA5-1-1 had better immune protective effect than rBMSA1.
Babesia infection can cause hemolysis of human and animal red blood cells, so the decrease in red blood cells and haemoglobin is an important indicator for
Babesia infection [
21]. As apicomplexan protozoans,
Plasmodium and
Babesia have similar symptoms. Many studies have analysed the reduction of red blood cells and haemoglobin in malaria patients [
22], but few have focused on the changes in blood cells in patients after
Babesia infection. Cai et al. [
16] used the Mindray BC-5300Vet animal-specific fully automatic blood cell analyzer to detect the changes in whole blood cells in mice at different stages of
B. microti infection. The number of WBCs in different
B. microti-infected mice significantly increased at 7 dpi, possibly because of the inflammatory response caused by
B. microti infection. Besides, RBC and HGB significantly decreased on the 7th day after infection, consistent with the number of parasites in mice post-infection. The number of parasites is inversely proportional to the number of RBCs and HGB content. The higher the number of parasites, the more red blood cells are infected by
B. microti, the more severe the fragmentation of red blood cells is, and the lower the content of red blood cells in the whole blood [
23]. This study used a whole blood cell analyzer to observe the dynamic changes of blood cells in different groups of mice infected with
B. microti, highlighting the process of
B. microti infection.
Further analyses revealed that TNF-α and IFN-γ expressions were higher in the BMSA1 group, from 7 to 28 dpi, compared to the infected group, consistent with previous findings with
B. microti Rhoptry neck proteins 2 (BmRON2) [
18,
24]. The RON2 protein is among the rhoptry-associated proteins (RAPs), part of a supergene family. Studies indicate that these proteins are important for
B. microti RBC invasion. Thus, BmRON2 is potentially a good candidate vaccine against babesiosis [
18]. In a related study with
Babesia bovis, a previous study showed that cytokines such as TNF-α and IFN-γ promote NO production [
25]. Stich et al. [
26] showed that TNF- α and IFN-γ promote host cell defence against parasites by up-regulating the iNOS and NO2 levels in bovine and mouse macrophages.
The IFN-γ defective mice showed only slight parasitaemia, while B-cell deficient mice showed more severe parasitemia after infection with
B. microti [
27]. Therefore, cellular immunity is key for mouse resistance against the first infection with
B. microti. Buddle et al. also confirmed IFN-γ as an important component of Th1 cell immune response and that IFN-γ has an anti-infection effect [
28]. Accordingly, this study also showed that IFN-γ expression gradually increased in mice infected with
B. microti. The expression of IFN-γ was higher in BMSA1- and BMSA5-1-1-immunised than in healthy mice, indirectly confirming that BMSA1 and BMSA5-1-1 have immunoprotective effects.
The expression of IL-10 was higher in the control group than in the experimental group at 7 dpi. However, IL-10 levels were higher in mice from the experimental and infected control groups, between 14 to 28 dpi, than in the normal control group. BmRON2 protein generated a similar effect [
18], demonstrating that IL-10 mediates
B. microti pathologies. The expression of IL-17A in rBMSA1 and rBmSA5-1-1 groups peaked at 14 dpi and gradually decreased after that. These results differ from previous findings using BmRON2 [
18], where IL-17A peaked at 21 dpi in BmRON2 mice. Altogether, these findings indicate that rBMSA1 and rBmSA5-1-1 alter the expression of cytokines at different stages of
B. microti infection. However, the specific mechanism underlying this process needs further investigation.
Notes
-
The authors declare no conflict of interest related to this study.
-
Conceptualization: Cai YC
Formal analysis: Yang CL, Song P
Funding acquisition: Cai YC, Chen JX
Methodology: Cai YC, Yang CL, Song P
Project administration: Cai YC
Supervision: Chen M, Chen JX
Writing – original draft: Cai YC
Writing – review & editing: Chen M, Chen JX
Supplementary Information
Acknowledgment
The Shanghai Natural Science Foundation fund (21ZR1469900), Three-Year Initiative Plan for Strengthening Public Health System Construction in Shanghai (2023–2025) Key Discipline Project (No. GWVI-11.1-12), the National Parasitic Resources Center, and the Ministry of Science and Technology fund (NPRC-2019-194-30) supported this work.
Fig. 1The effect of rBMSA1 and rBmSA5-1-1 proteins on inhibition of B. microti infection in vitro. The recombinant secretory proteins were added to the blood cell culture at 10–500 μg/ml. The effect of rBmSA5-1-1 and rBMSA1 was dose-dependent; decreasing the concentration of recombinant proteins increased the parasite invasion. There was no obvious effect at 10 μg/ml. The relative invasion rate=infection rate of the experimental group/infection rate of the control group.
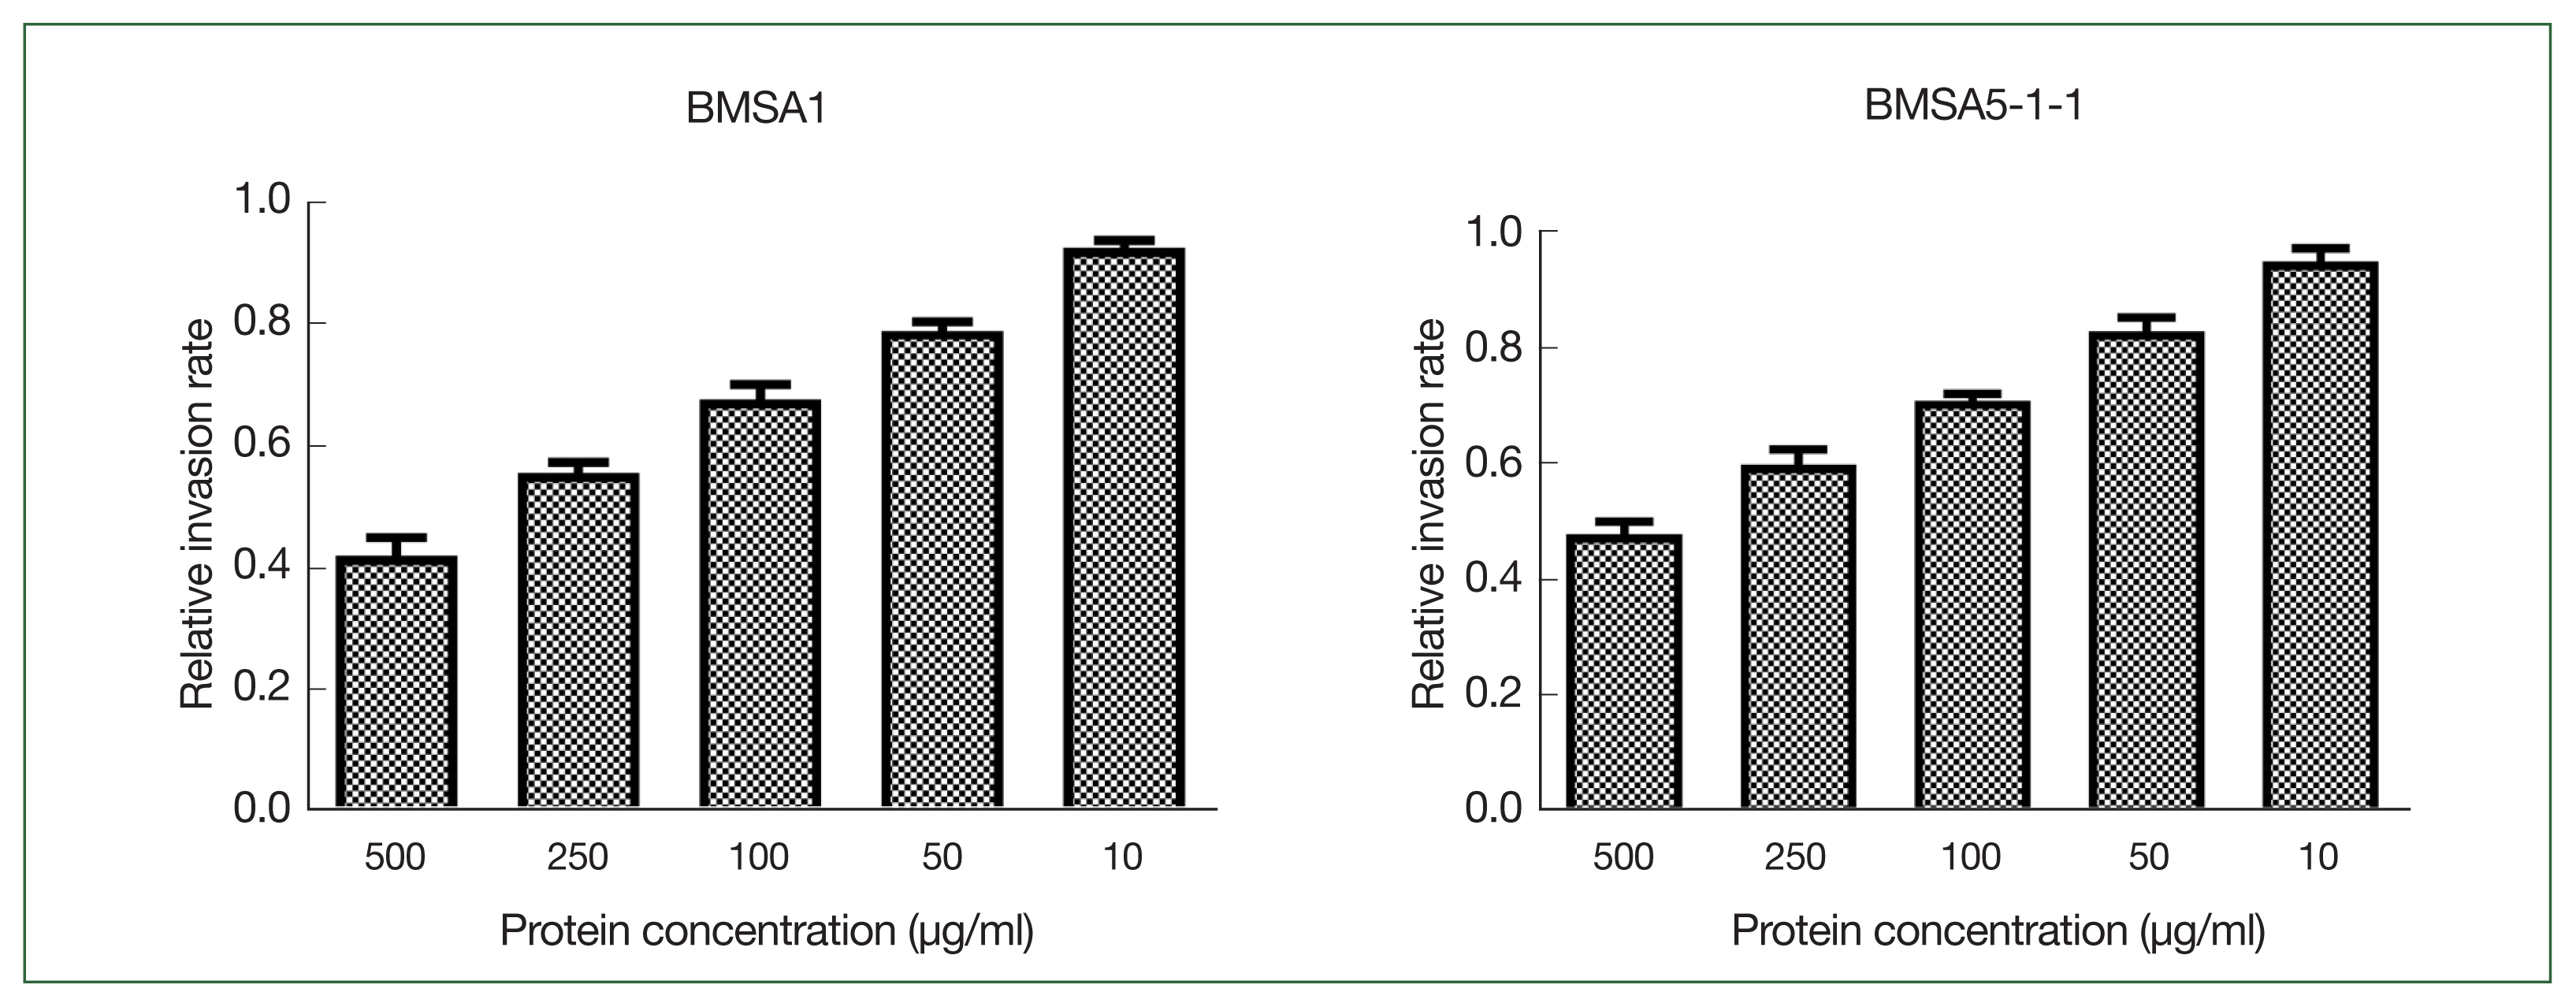
Fig. 2The protective effect of recombinant BMSA1 and BmSA5-1-1 proteins against B. microti infected mice in vivo. Infection rates, WBC counts, RBC numbers and HGB content in mice after priming mice with rBMSA1 and rBmSA5-1-1 before B. microti challenge. (A) The peak infection rate of the infected control group (7 dpi) was higher than the rBMSA1 and rBmSA5-1-1 groups at 46.7%, 19.6%, and 24.7% infection rates, respectively. (B) The number of WBCs was higher in the rBMSA1 and rBmSA5-1-1 groups than in the infected control and normal control groups. (C, D) The number of RBCs and HGB were higher in the rBMSA1 and rBmSA5-1-1 groups than in the infected control group but were lower than in the normal control group.

Fig. 3Cytokine concentrations in mice increased in the 4 groups. TNF-α, IFN-γ, and IL-17A levels were higher in the rBMSA1 and rBmSA5-1-1 immunized groups than in the infected control and normal control groups (A–C). The IL-10 level was lower in the rBMSA1 and rBmSA5-1-1 groups (7 dpi) than in the infected control group (D).

References
- 1. Vannier E, Krause PJ. Human babesiosis. N Engl J Med 2012;366(25):2397-2407. https://doi.org/10.1056/NEJMra1202018
- 2. Esernio Jenssen D, Scimeca PG, Benach JL, Tenenbaum MJ. Transplacental/perinatal babesiosis. J Pediatr 1987;110(4):570-572. https://doi.org/10.1016/s0022-3476(87)80552-8
- 3. Fox LM, Wingerter S, Ahmed A, Arnold A, Chou J, et al. Neonatal babesiosis: case report and review of the literature. Pediatr Infect Dis J 2006;25(2):169-173. https://doi.org/10.1097/01.inf.0000195438.09628.b0
- 4. Gubernot DM, Nakhasi HL, Mied PA, Asher DM, Epstein JS, et al. Transfusion-transmitted babesiosis in the United States: summary of a workshop. Transfusion 2009;49(12):2759-2771. https://doi:10.1111/j.1537-2995.2009.02429.x
- 5. Hunfeld KP, Hildebrandt A, Gray JS. Babesiosis: recent insights into an ancient disease. Int J Parasitol 2008;38(11):1219-1237. https://doi.org/10.1016/j.ijpara.2008.03.001
- 6. Krause PJ, Telford SR 3rd, Ryan R, Hurta AB, Kwasnik I, et al. Geographical and temporal distribution of babesial infection in Connecticut. J Clin Microbiol 1991;29(1):1-4. https://doi.org/10.1128/jcm.29.1.1-4.1991
- 7. Gorenflot A, Moubri K, Precigout E, Carcy B, Schetters TP. Human babesiosis. Ann Trop Med Parasitol 1998;92(4):489-501. https://doi.org/10.1080/00034989859465
- 8. Gelfand JA, Callahan MV. Babesiosis. Curr Clin Top Infect Dis 1998;18:201-216.
- 9. Magnarelli LA, Ijdo JW, Anderson JF, Padula SJ, Flavell RA, et al. Human exposure to a granulocytic Ehrlichia and other tick-borne agents in Connecticut. J Clin Microbiol 1998;36(10):2823-2827. https://doi.org/10.1128/JCM.36.10.2823-2827.1998
- 10. Jiang JF, Zheng YC, Jiang RR, Li H, Huo QB, et al. Epidemiological, clinical, and laboratory characteristics of 48 cases of “Babesia venatorum” infection in China: a descriptive study. Lancet Infect Dis 2015;15(2):196-203. https://doi.org/10.1016/S1473-3099(14)71046-1
- 11. Carcy B, Précigout E, Schetters T, Gorenflot A. Genetic basis for GPI-anchor merozoite surface antigen polymorphism of Babesia and resulting antigenic diversity. Vet Parasitol 2006;138(1–2):33-49. https://doi.org/10.1016/j.vetpar.2006.01.038
- 12. Nathaly Wieser S, Schnittger L, Florin-Christensen M, Delbecq S, Schetters T. Vaccination against babesiosis using recombinant GPI-anchored proteins. Int J Parasitol 2019;49(2):175-181. https://doi.org/10.1016/j.ijpara.2018.12.002
- 13. Luo Y, Jia H, Terkawi MA, Goo YK, Kawano S, et al. Identification and characterization of a novel secreted antigen 1 of Babesia microti and evaluation of its potential use in enzyme-linked immunosorbent assay and immunochromatographic test. Parasitol Int 2011;60(2):119-125. https://doi.org/10.1016/j.parint.2010.11.001
- 14. Cornillot E, Dassouli A, Pachikara N, Lawres L, Renard I, et al. A targeted immunomic approach identifies diagnostic antigens in the human pathogen Babesia microti. Transfusion 2016;56(8):2085-2099. https://doi.org/10.1111/trf.13640
- 15. Thekkiniath J, Mootien S, Lawres L, Perrin BA, Gewirtz M, et al. BmGPAC, an Antigen Capture Assay for Detection of Active Babesia microti Infection. J Clin Microbiol 2018;56(10):e00067-18. https://doi.org/10.1128/JCM.00067-18
- 16. Cai YC, Wu F, Hu W, Chen J, Chen SH, et al. Molecular Characteriz red blood cell ation of Babesia microti Seroreactive Antigen 5-1-1 and Development of Rapid Detection Methods for Anti-B. microti Antibodies in Serum. Acta Trop 2018;185:371-379. https://doi.org/10.1016/j.actatropica.2018.03.020
- 17. Zhang Y, Jiang N, Lu H, Hou N, Piao X, et al. Proteomic analysis of Plasmodium falciparum schizonts reveals heparin-binding merozoite proteins. J Proteome Res 2013;12(5):2185-2193. https://doi.org/10.1021/pr400038j
- 18. Cai YC, Yang CL, Hu W, Song P, Xu B, et al. Molecular characterization and immunological evaluation of truncated Babesia microti rhoptry neck protein 2 (BmRON2) as a vaccine candidate. Front Immunol 2021;12:616343. https://doi.org/10.3389/fimmu.2021.616343
- 19. Vogt AM, Pettersson F, Moll K, Jonsson C, Normark J, et al. Release of sequestered malaria parasites upon injection of a glycosaminoglycan. PLoS Pathogens 2006;2(9):e100. https://doi.org/10.1371/journal.ppat.0020100
- 20. Boyle MJ, Richards JS, Gilson PR, Chai W, Beeson JG. Interactions with heparin-like molecules during erythrocyte invasion by P. falciparum merozoites. Blood 2010;115(22):4559-4568. https://doi.org/10.1182/blood-2009-09-243725
- 21. Homer MJ, Aguilar-Delfin I, Telford SR 3rd, Krause PJ, Persing DH. Babesiosis. Clin Microbiol Rev 2000;13(3):451-469. https://doi.org/10.1128/CMR.13.3.451
- 22. Sharma P, Bhargava M, Sukhachev D, Datta S, Wattal C. LH750 hematology analyzers to identify malaria and dengue and distinguish them from other febrile illnesses. Int J Lab Hematol 2014;36(1):45-55. https://doi.org/10.1111/ijlh.12116
- 23. Yu-Chun C, Shao-Hong C, Chun-Li Y, Zhi-Xin Z, Hao L, et al. Dynamic of routine blood test in BALB/c mice with Babesia microti infection. Chin J Schisto Control 2018;30(3):300-306. (in Chinese). https://doi.org/10.16250/j.32.1374.2018119
- 24. Hemmer RM, Ferrick DA, Conrad PA. Up-regulation of tumor necrosis factor-alpha and interferon-gamma expression in the spleen and lungs of mice infected with the human Babesia isolate WA1. Parasitol Res 2000;86(2):121-128. https://doi.org/10.1007/s004360050021
- 25. Goff WL, Johnson WC, Parish SM, Barrington GM, Elsasser TH, et al. IL-4 and IL-10 inhibition of IFN-gamma- and TNF-alpha-dependent nitric oxide production from bovine mononuclear phagocytes exposed to Babesia bovis merozoites. Vet Immunol Immunopathol 2002;84(3–4):237-251. https://doi.org/10.1016/s0165-2427(01)00413-5
- 26. Stich RW, Shoda LK, Dreewes M, Adler B, Jungi TW, et al. Stimulation of nitric oxide production in macrophages by Babesia bovis.. Infect Immun 1998;66(9):4130-4136. https://doi.org/10.1128/IAI.66.9.4130-4136.1998
- 27. Clawson ML, Paciorkowski N, Rajan TV, La Vake C, Pope C, et al. Cellular immunity, but not gamma interferon, is essential for resolution of Babesia microti infection in BALB/c mice. Infect Immun 2002;70(9):5304-5306. https://doi.org/10.1128/IAI.70.9.5304-5306.2002
- 28. Buddle BM, Wedlock DN, Denis M, Skinner MA. Identification of immune response correlates for protection against bovine tuberculosis. Vet Immunol Immunopathol 2005;108(1–2):45-51. https://doi.org/10.1016/j.vetimm.2005.08.002