Abstract
The ovalbumin (OVA)-alum mouse model, which induces a Th2-biased immune response, is commonly used to study allergic airway inflammation. However, the artificial nature of this model limits its relevance to environmental or infection-related airway diseases. The free-living environmental protozoan Acanthamoeba is a potential trigger of airway inflammation, but its immune mechanisms remain largely unknown. To compare these 2 models of airway inflammation, this study carried out microarray-based transcriptomic analysis of lung tissue obtained from mice with OVA-alum treatment or intranasal Acanthamoeba exposure. Compared to controls, OVA-alum treatment induced broad transcriptional changes involving >2,900 probes (fold change ≥1.5); Acanthamoeba exposure led to a substantially weaker response, with <500 probes affected at the same threshold. Unlike the OVA-alum–treated group, the Acanthamoeba-exposed mice showed minimal overlap with only 5 genes significantly downregulated, suggesting a distinct immune activation profile. Downregulation of genes related to the immunoglobulin variable region (Ighv1–58 and Igkv3–10) and eosinophil function (Rnase2a) in the Acanthamoeba group suggest suppression of a typical Th2/humoral response. Heatmap and clustering analysis demonstrated clear separation between the Acanthamoeba, OVA-alum, and control groups. Taken together, these results suggest that Acanthamoeba induces a unique airway immune response that is markedly different from traditional Th2-dominant inflammation, and may be a more suitable model for studying environmentally-induced or infection-related respiratory diseases.
-
Key words: Airway inflammation, Acanthamoeba, ovalbumin-alum model, transcriptome analysis
Introduction
Airway inflammation, which is characterized by eosinophil infiltration, mucus hypersecretion, and airway hyperresponsiveness, is a key feature of various respiratory diseases such as asthma [
1,
2]. Animal models play an important role in understanding the pathophysiology of allergic airway inflammation, with the ovalbumin (OVA)-alum model being the most widely used. This model reliably induces a Th2-biased immune response characterized by increased IL-4, IL-5, and IL-13 levels as well as increased B cell activation, IgE production, and eosinophil influx. Although this model has provided important insights into allergic asthma, its relevance to naturally occurring or environmentally-induced airway inflammation is limited due to artificial sensitization methods and the use of potent adjuvants.
Acanthamoeba, a free-living opportunistic protozoan, has recently emerged as a potential environmental trigger of airway inflammation [
3,
4]. Although primarily known for causing keratitis and granulomatous amoebic encephalitis in immunocompromised patients, there is growing evidence that
Acanthamoeba can interact with respiratory epithelial cells to modulate immune responses [
5,
6]. However, the mechanisms by which
Acanthamoeba causes airway inflammation remain poorly understood [
7]. Specifically, it is unclear whether
Acanthamoeba triggers a classic Th2-mediated allergic response, like the classical OVA model, or activates other immune pathways such as innate immune cells or Th1/Th17 responses [
8].
To explore these differences, this study established and compared 2 murine models of airway inflammation: one induced by OVA-alum sensitization and the other induced by Acanthamoeba exposure. The goals of this study were to characterize the nature and magnitude of the immune response induced by Acanthamoeba, identify differentially expressed genes (DEGs) and enriched pathways, and assess whether Acanthamoeba induces distinct immune signatures compared to traditional models.
Using transcriptome profiling by microarray analysis, we identified DEGs and characterized the underlying immune features of each model [
9]. We observed significant downregulation of genes related to B cell receptor diversity and antibody production [
10], such as Ighv1–58, Igkv3–10, and Igkv5–48, in the
Acanthamoeba group compared to the OVA model. Expression of Rnase2a, a gene associated with eosinophil activation [
11], was also reduced, suggesting reduced Th2-type or humoral response in the
Acanthamoeba exposure model. Overall, these findings provide insights into the immune mechanisms underlying environmentally-induced airway inflammation and highlight key differences between traditional allergen models and pathogen-related models.
Materials and Methods
Ethics statement
All experimental protocols were approved by the Institution Animal Care and Use Committee of Pusan National University (PNU-2019-2287 and PNU-2022-0194).
Acanthamoeba cultivation
The
Acanthamoeba sp. KFA21 (an homolog of
Acanthamoeba lugdunensis KA/E2) strain was cultured in peptone yeast glucose medium at 25°C and maintained as previously described [
12]. Trophozoites were detached from plates and washed 3 times with sterile phosphate buffered saline (PBS). After washing, the counted trophozoites were intranasally introduced to mice.
Female C57BL/6 mice (6 weeks old) were purchased from Samtako (Osan, Korea) and housed under standard conditions (22±2°C, 50±10% humidity, 12 h light/dark cycle) with free access to food and water.
Acanthamoeba-induced airway inflammation model
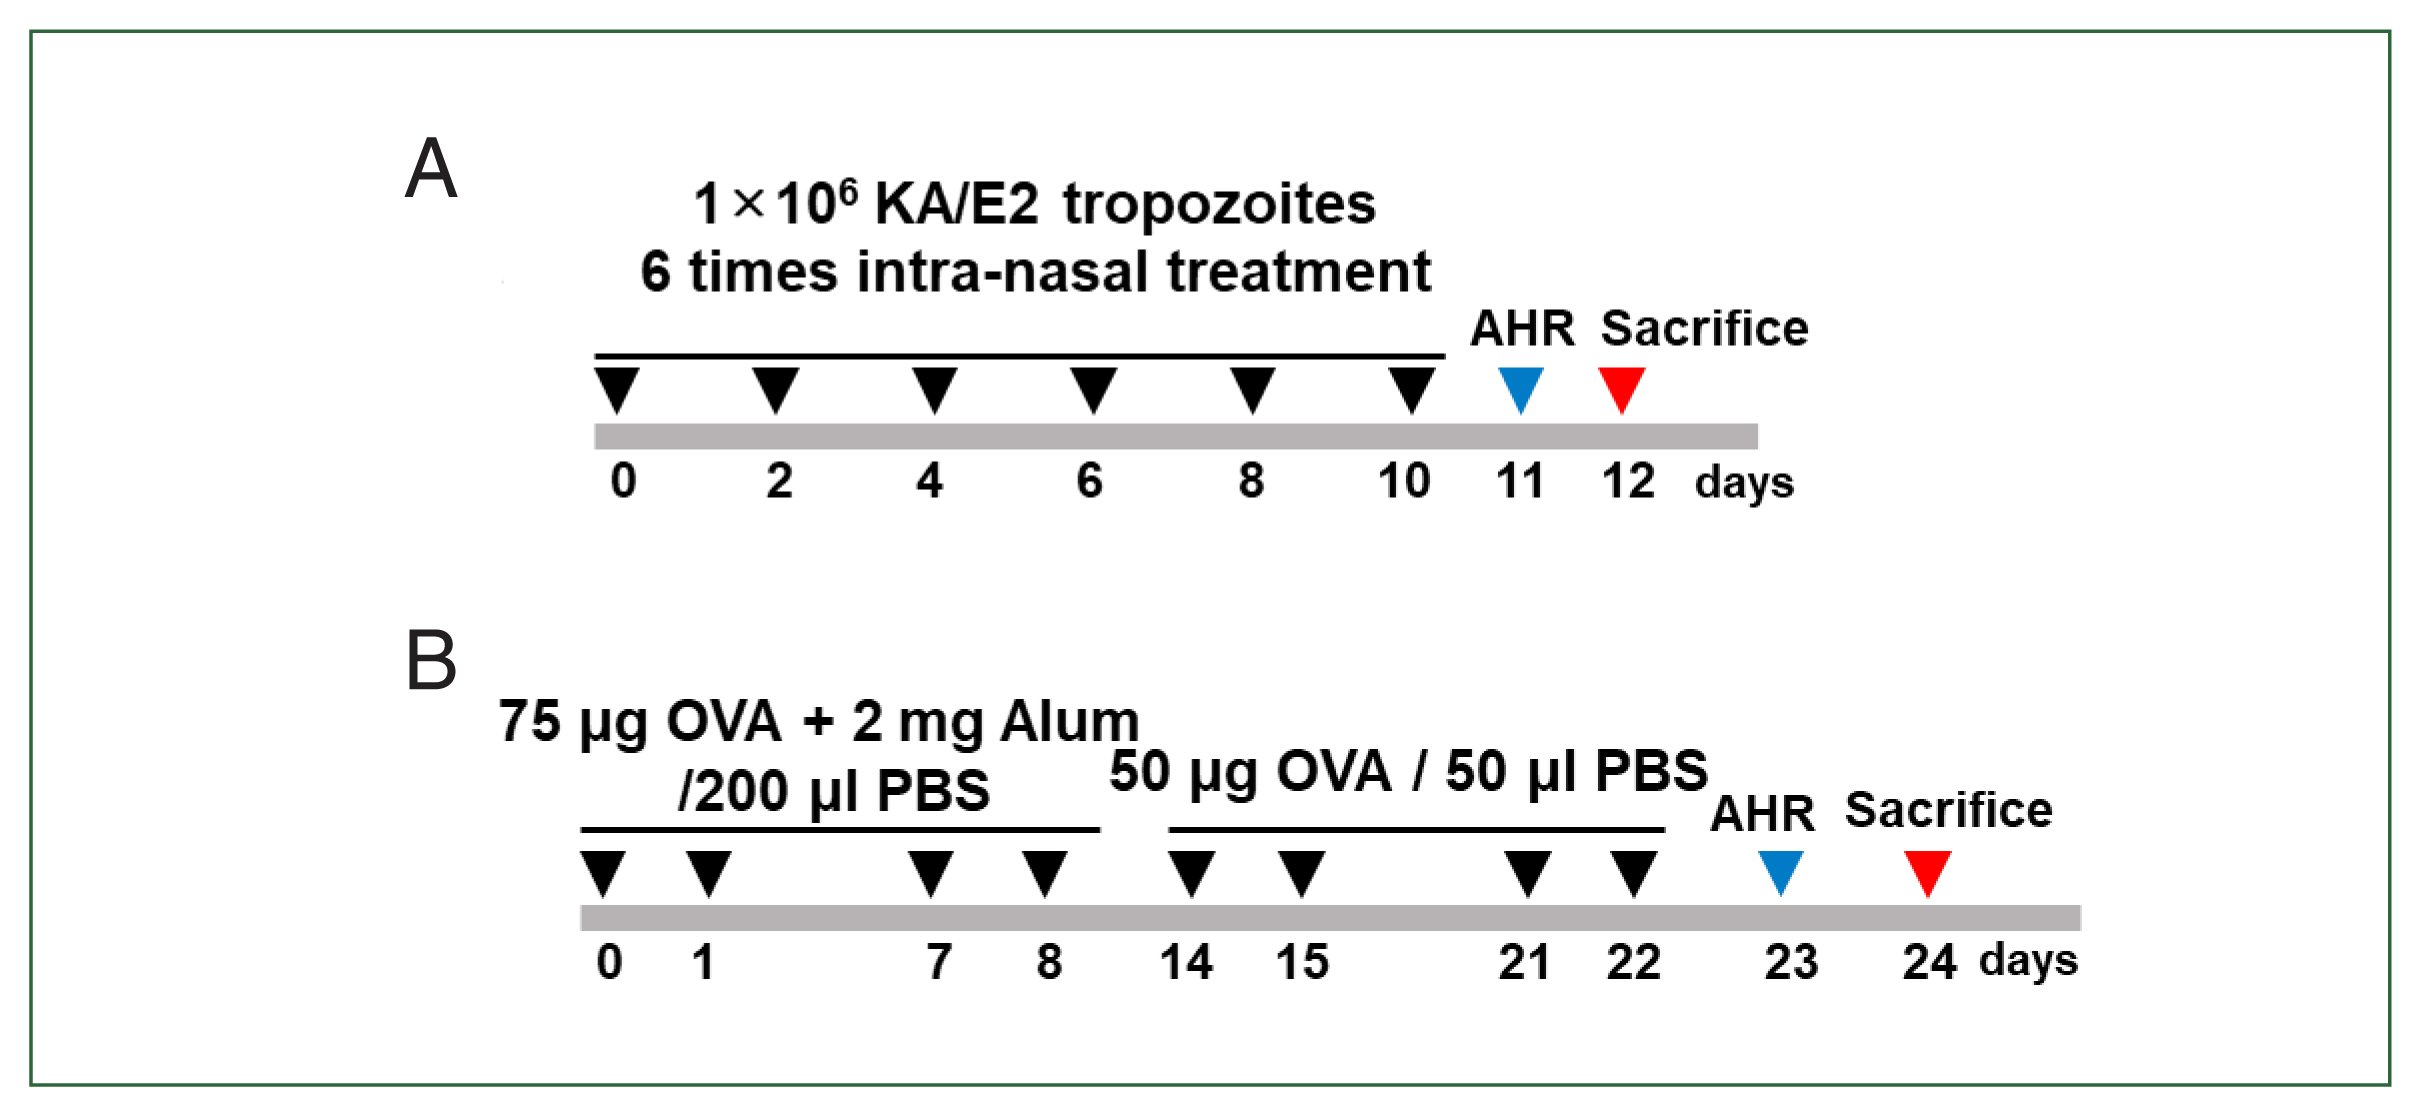
Mice in the infected group received intranasal administration of 5×10
4 A. lugdunensis trophozoites on days 0, 2, 4, 6, 8, and 10. For the control group, mice received an equal volume of PBS intranasally according to the same schedule. Administration was performed under light isoflurane anesthesia (
Fig. 1A).
The OVA-alum mouse model of allergic airway inflammation was induced as previously described with minor modifications [
13]. Mice were sensitized by intraperitoneal injection of 75 μg OVA (Sigma-Aldrich, St. Louis, MO, USA) with 2 mg of aluminum hydroxide (Sigma-Aldrich) in 200 μl of PBS on days 0, 1, 7, and 8. The mice were challenged intranasally with 50 μg of OVA in 50 μl of PBS on days 14, 15, 21, and 22. Mice were sacrificed on day 24. For the control group, mice received PBS alone according to the same sensitization and challenge schedule (
Fig. 1B).
To compare gene expression changes between the Acanthamoeba-exposed and OVA alum-induced airway inflammation models, total RNA was extracted from lung tissue using the GeneChip Whole Transcript PLUS Reagent Kit (Affymetrix, Santa Clara, CA, USA) according to the manufacturer’s protocol. Complementary DNA (cDNA) was synthesized using the GeneChip WT Amplification Kit, followed by fragmentation and biotin labeling of the sense cDNA with terminal deoxynucleotidyl transferase using the GeneChip WT Terminal Labeling Kit. A total of 5.5 μg of labeled cDNA was hybridized to the Affymetrix GeneChip Mouse 2.0 ST Array at 45°C for 16 h. After hybridization, the arrays were washed and stained using the GeneChip Fluidics Station 450 and then scanned using a GCS 3000 Scanner (Affymetrix). Raw data were processed and the signal intensities were calculated using GeneChip Command Console Software (Affymetrix). Microarray analysis was performed by Macrogen (Seoul, Korea).
Raw data processing
Raw microarray data files were generated using GeneChip Command Console Software following the manufacturer’s standard operating procedures. Background correction, normalization, and summarization were performed using the Robust Multi-array Average algorithm within the Affymetrix Expression Console platform. The processed gene-level expression data were then exported and used for downstream differential expression analysis.
Statistical and bioinformatics analyses
Differential gene expression was determined primarily based on fold change (FC) thresholds. To investigate the relationships between gene expression profiles across experimental groups, hierarchical clustering analysis was performed using Euclidean distance metrics and average linkage methods. Functional enrichment analysis for significantly altered gene sets was performed using the Gene Ontology (GO) and Kyoto Encyclopedia of Genes and Genomes (KEGG) pathway databases (
http://www.geneontology.org/). Two annotation outputs were used: gomap_stat provides enrichment significance based on GO terms across a set of DEGs, while gomap_genes maps individual genes to their associated GO terms and statistics.
Results
Identification of distinct gene expression patterns between Acanthamoeba- or OVA-induced airway inflammation models and controls
Transcriptomic profiling of lung tissue revealed distinct gene expression responses after treatment with
Acanthamoeba or OVA-alum adjuvant. Compared to control mice,
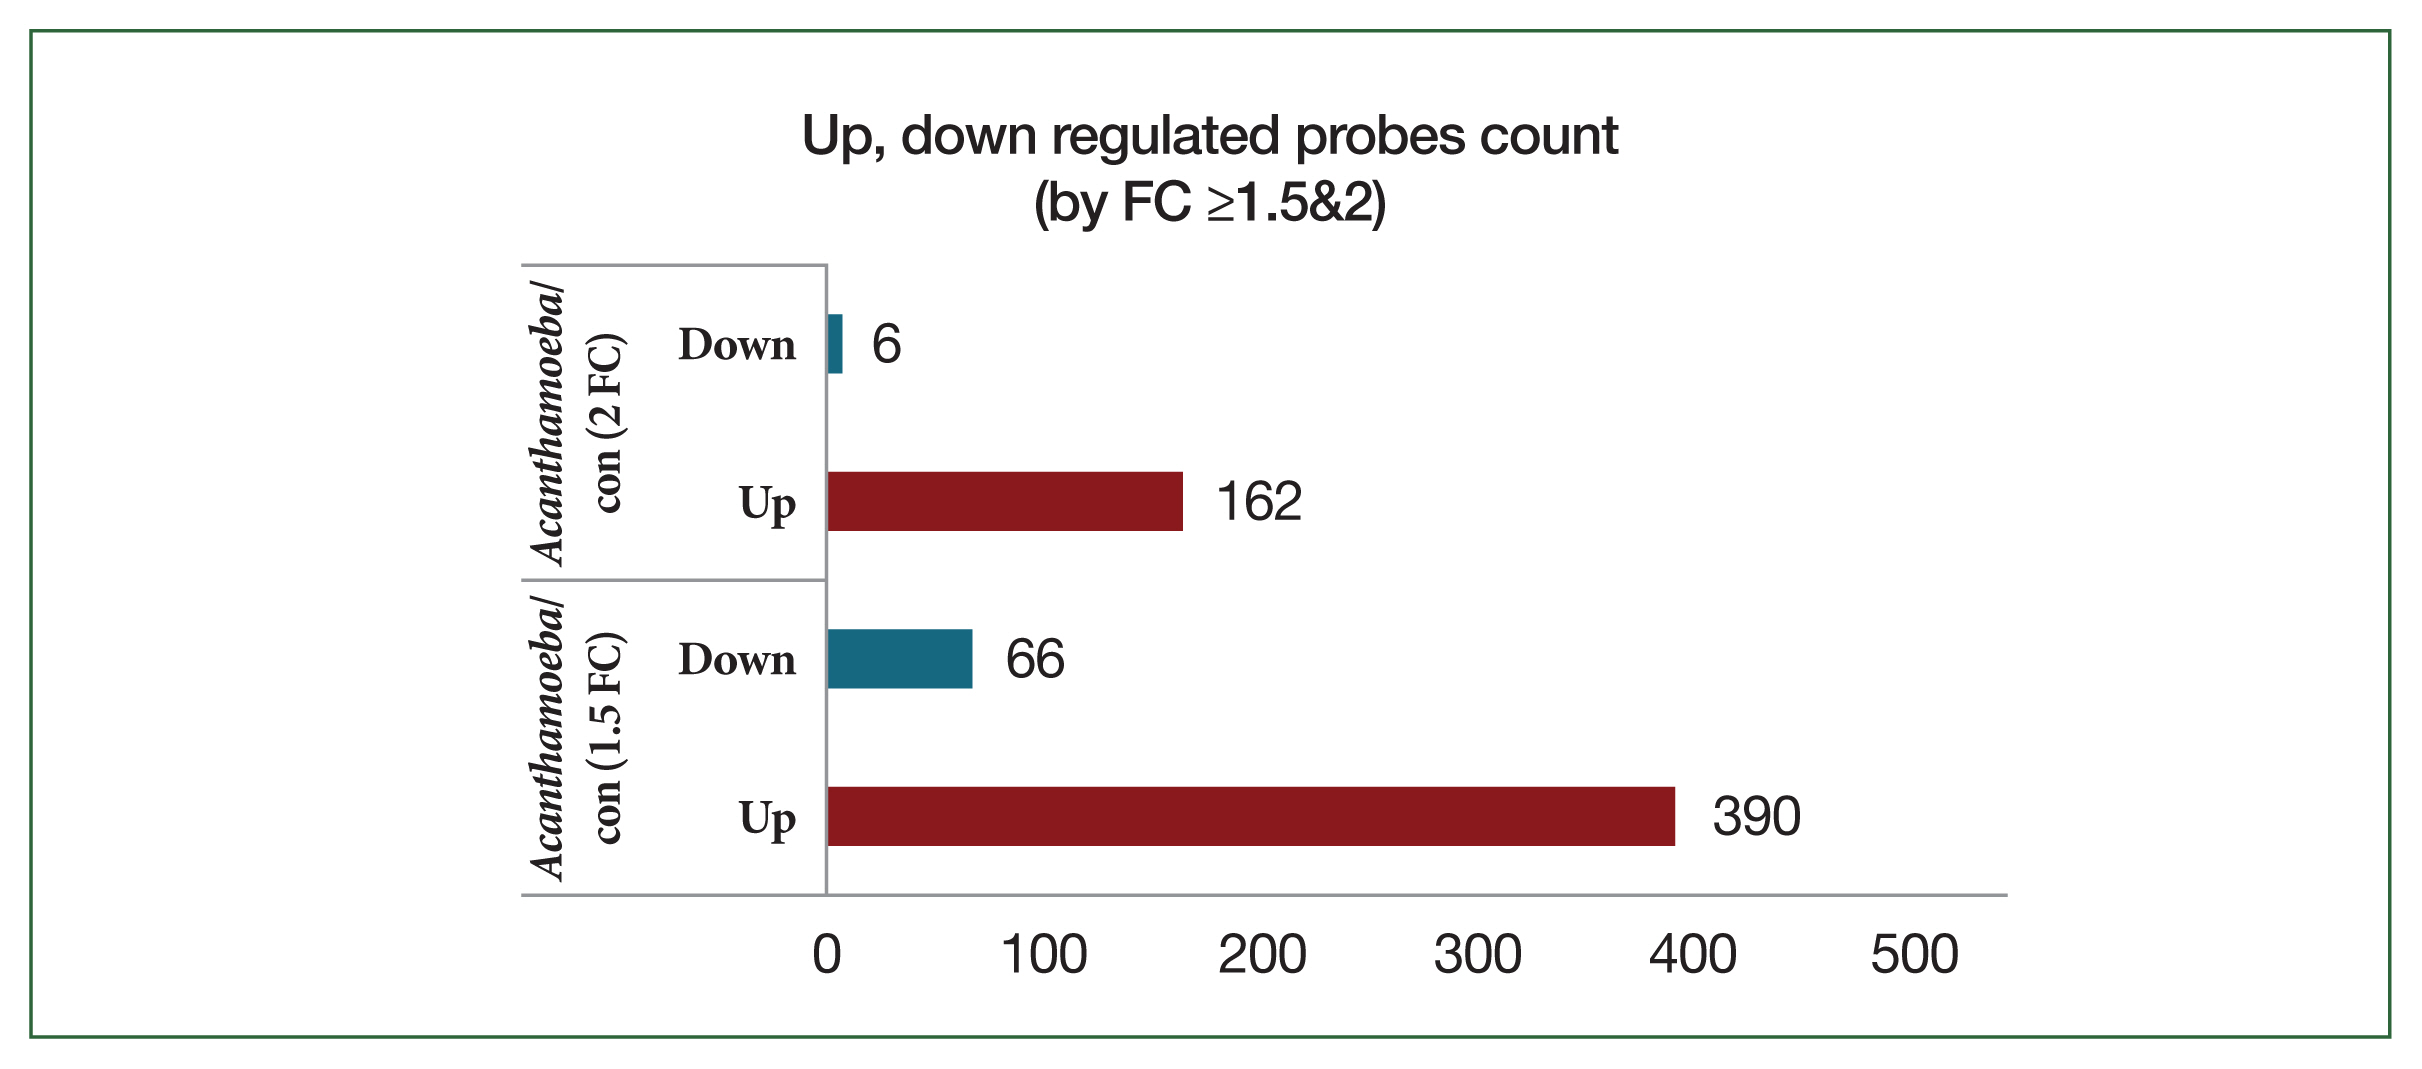
Acanthamoeba-exposed mice exhibited 390 upregulated and 66 downregulated probes at a FC threshold ≥1.5. Using the more stringent threshold of FC ≥2, 162 probes were upregulated and 6 probes were downregulated (
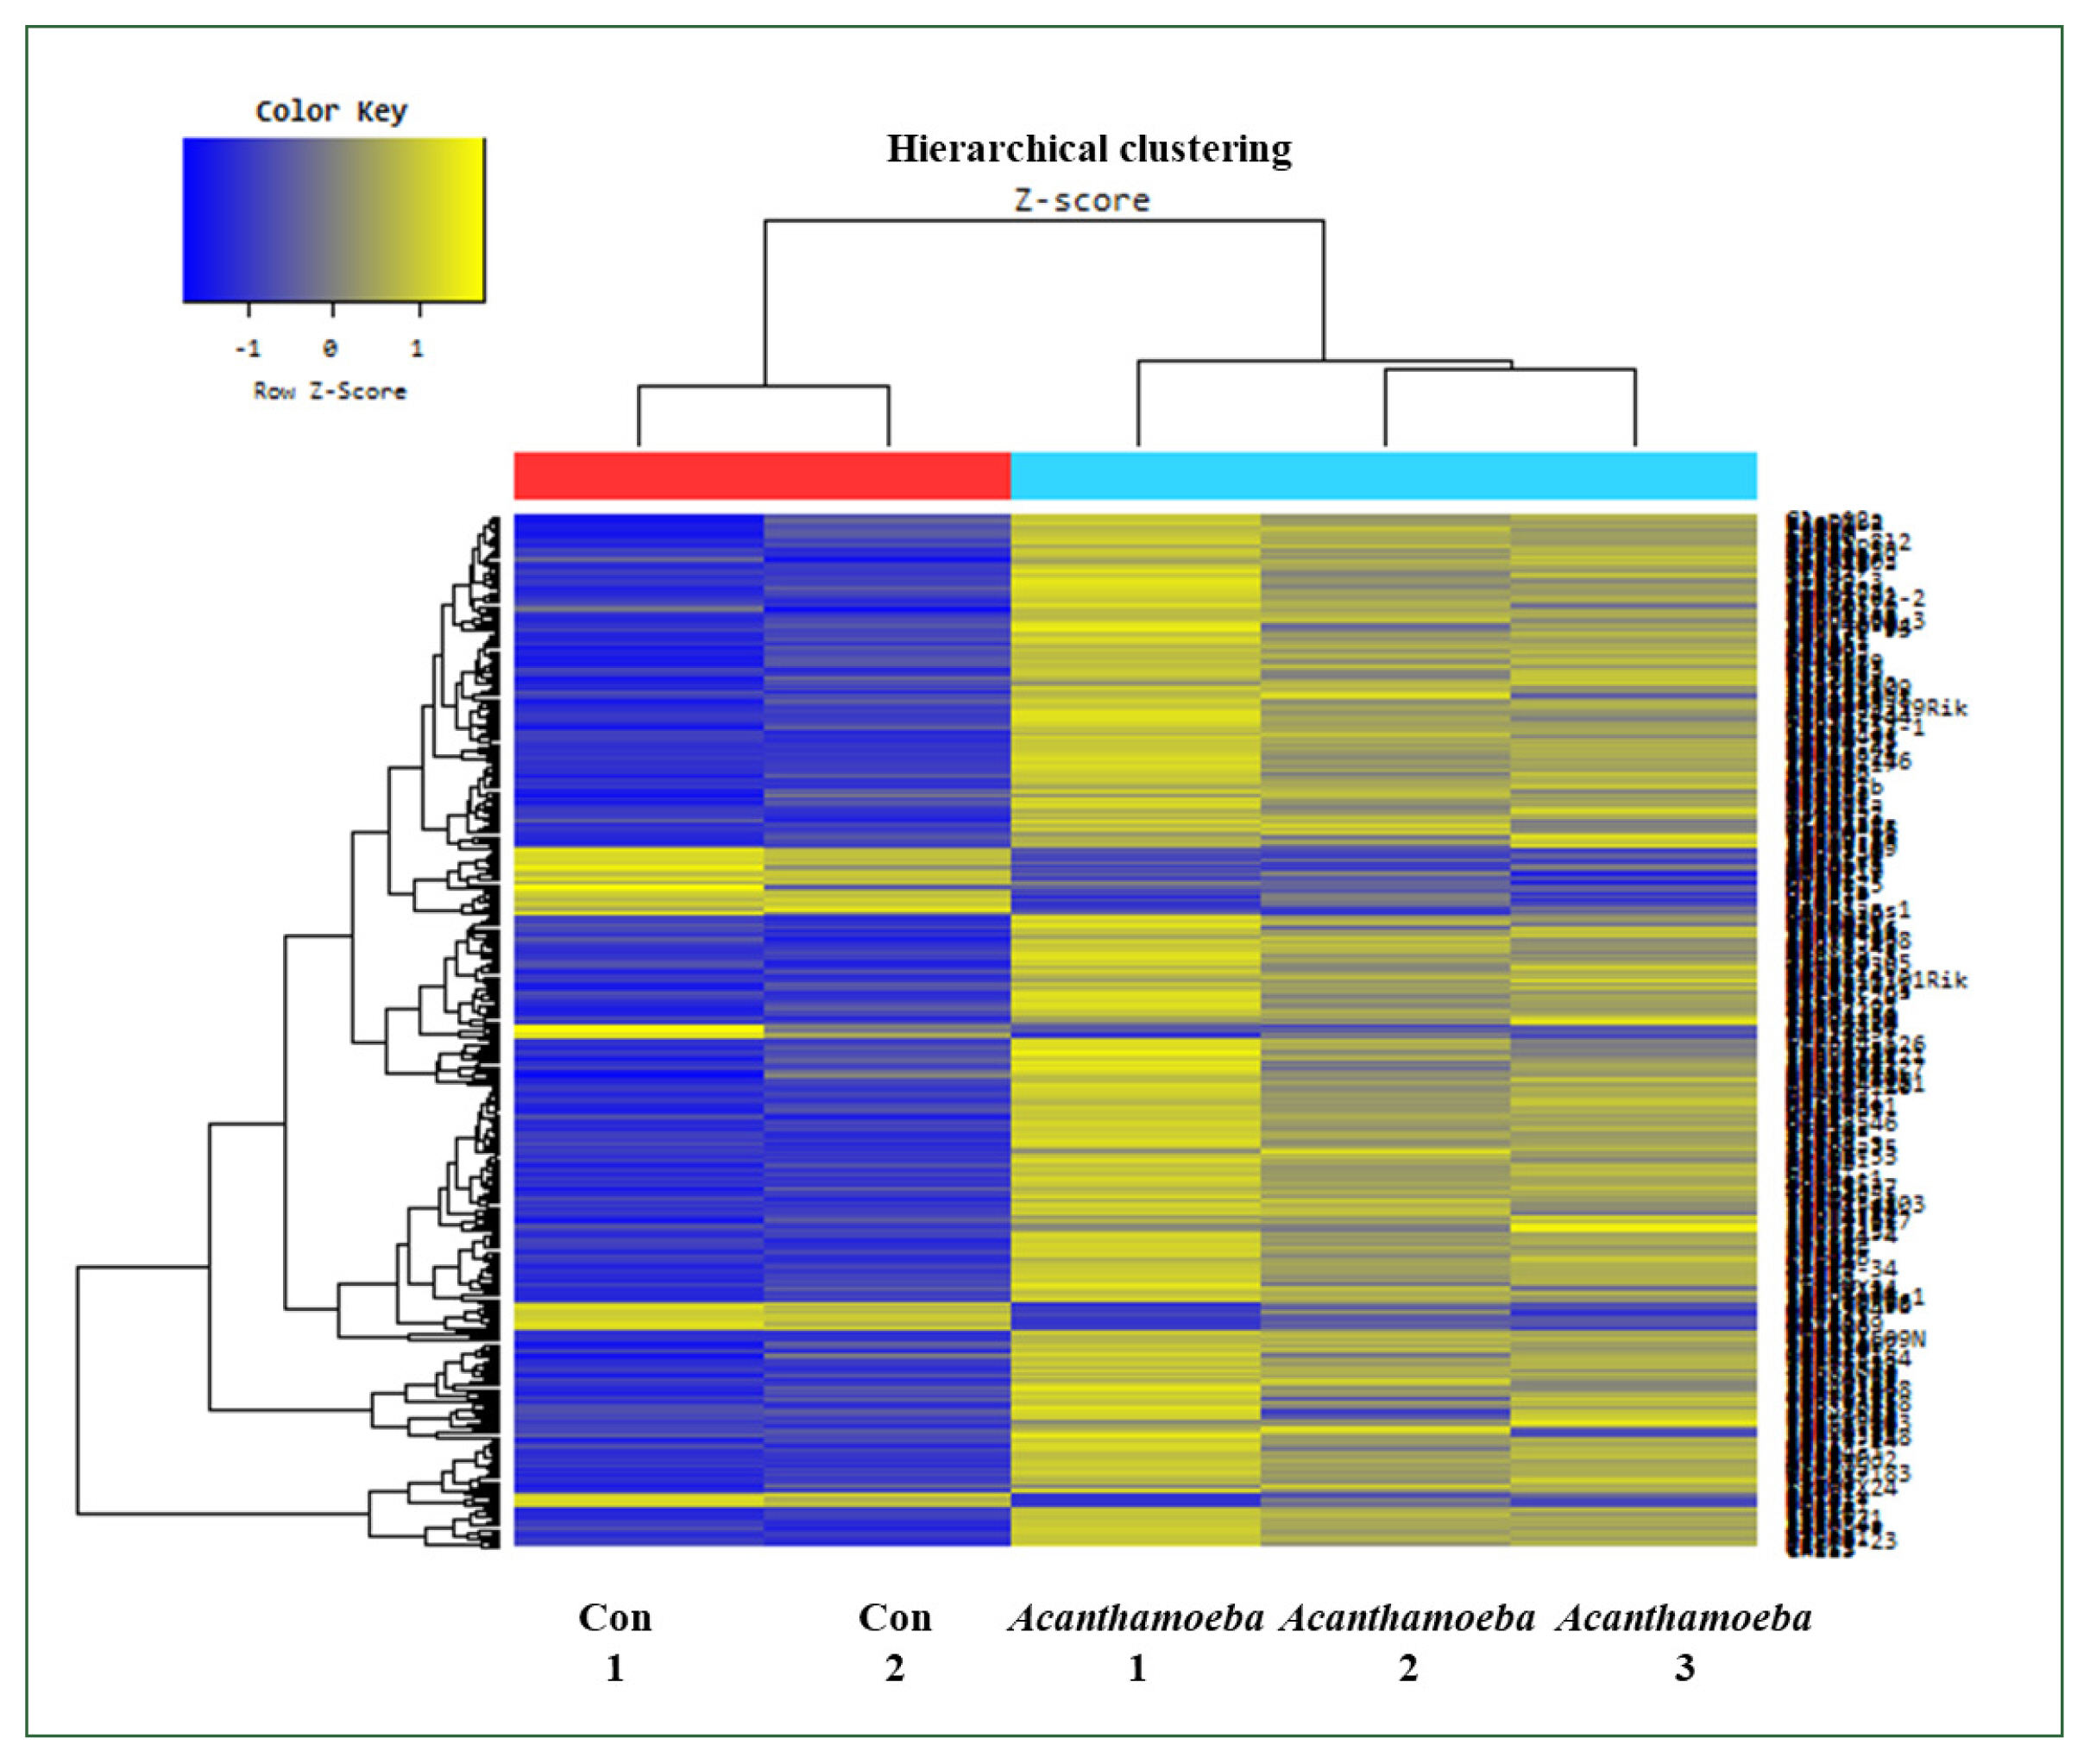
Fig. 2). Hierarchical cluster heat map analysis of gene expression profiles showed distinct transcriptional signatures between
Acanthamoeba treatment and control groups. Upregulated and downregulated genes in the
Acanthamoeba group are shown in yellow and blue, respectively. The clustering pattern indicated functional grouping of DEGs (
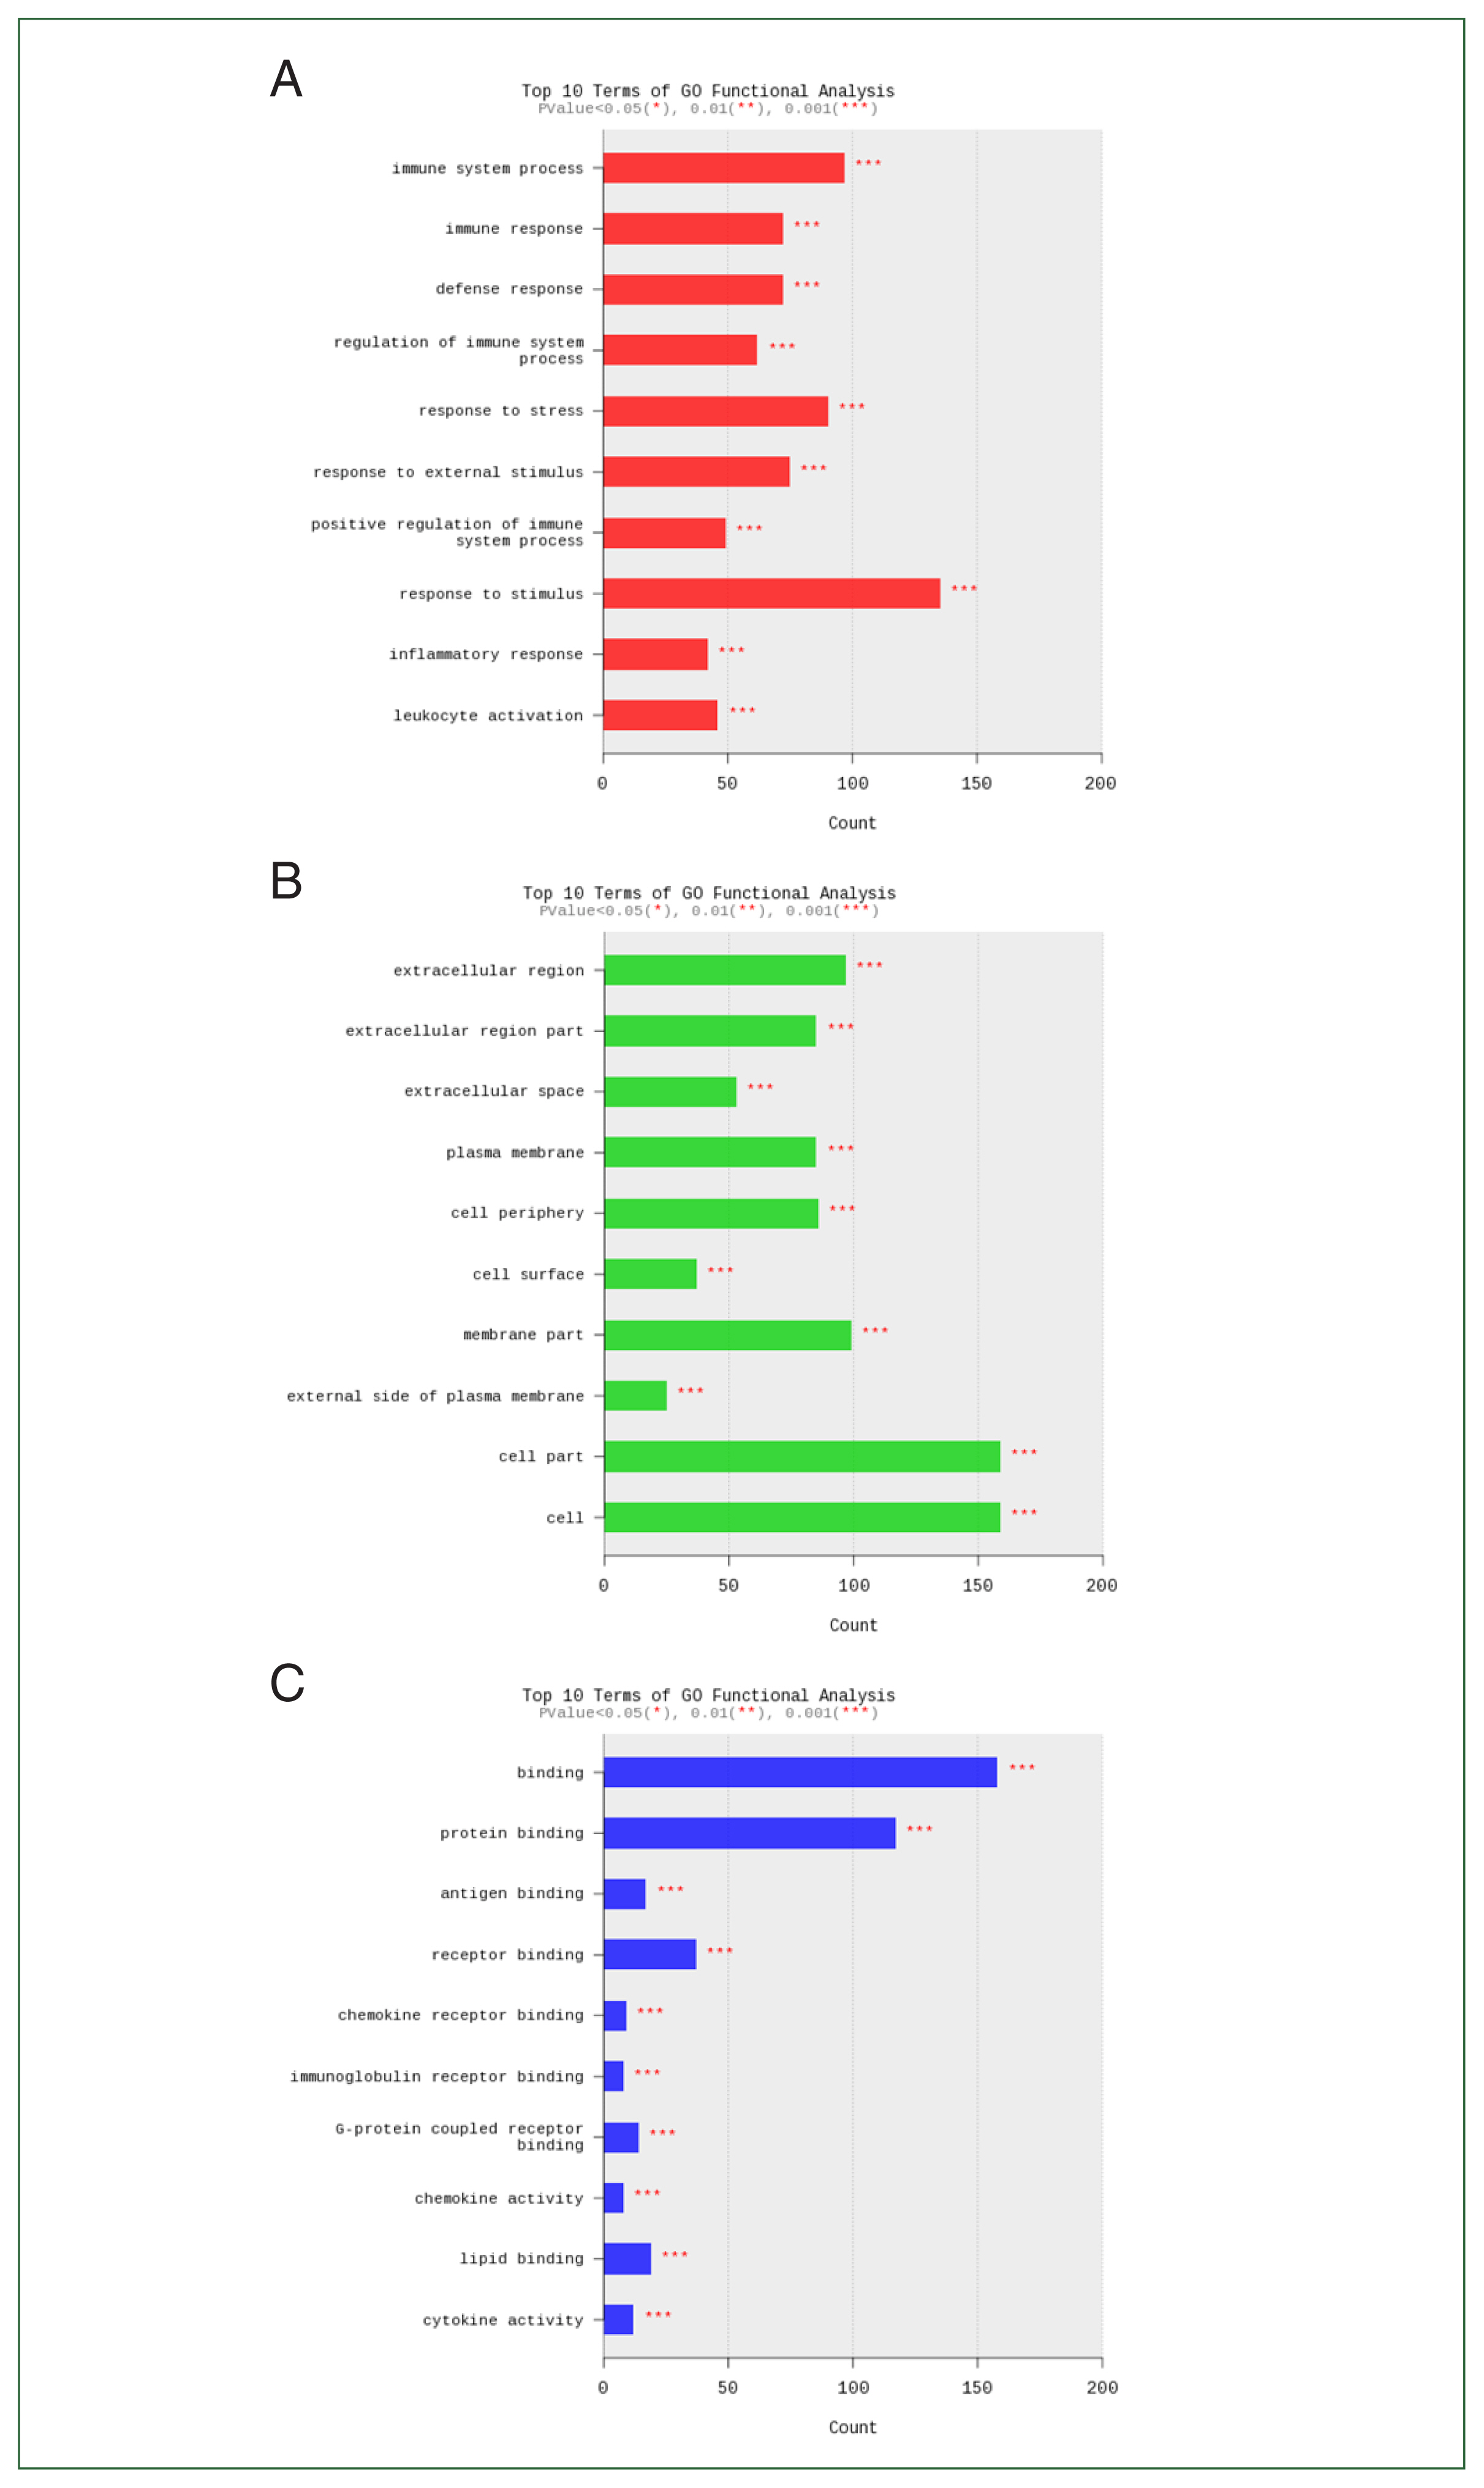
Fig. 3). We performed enrichment analysis of DEGs using the GO database to investigate associations with biological processes, cellular components, and molecular functions. The 10 most significant terms associated with DEGs with a cutoff of false discovery rate–adjusted
P<0.05 were summarized for each category. Genes downregulated or upregulated after
Acanthamoeba exposure were closely related to immune system processes, cells, and binding (
Fig. 4).
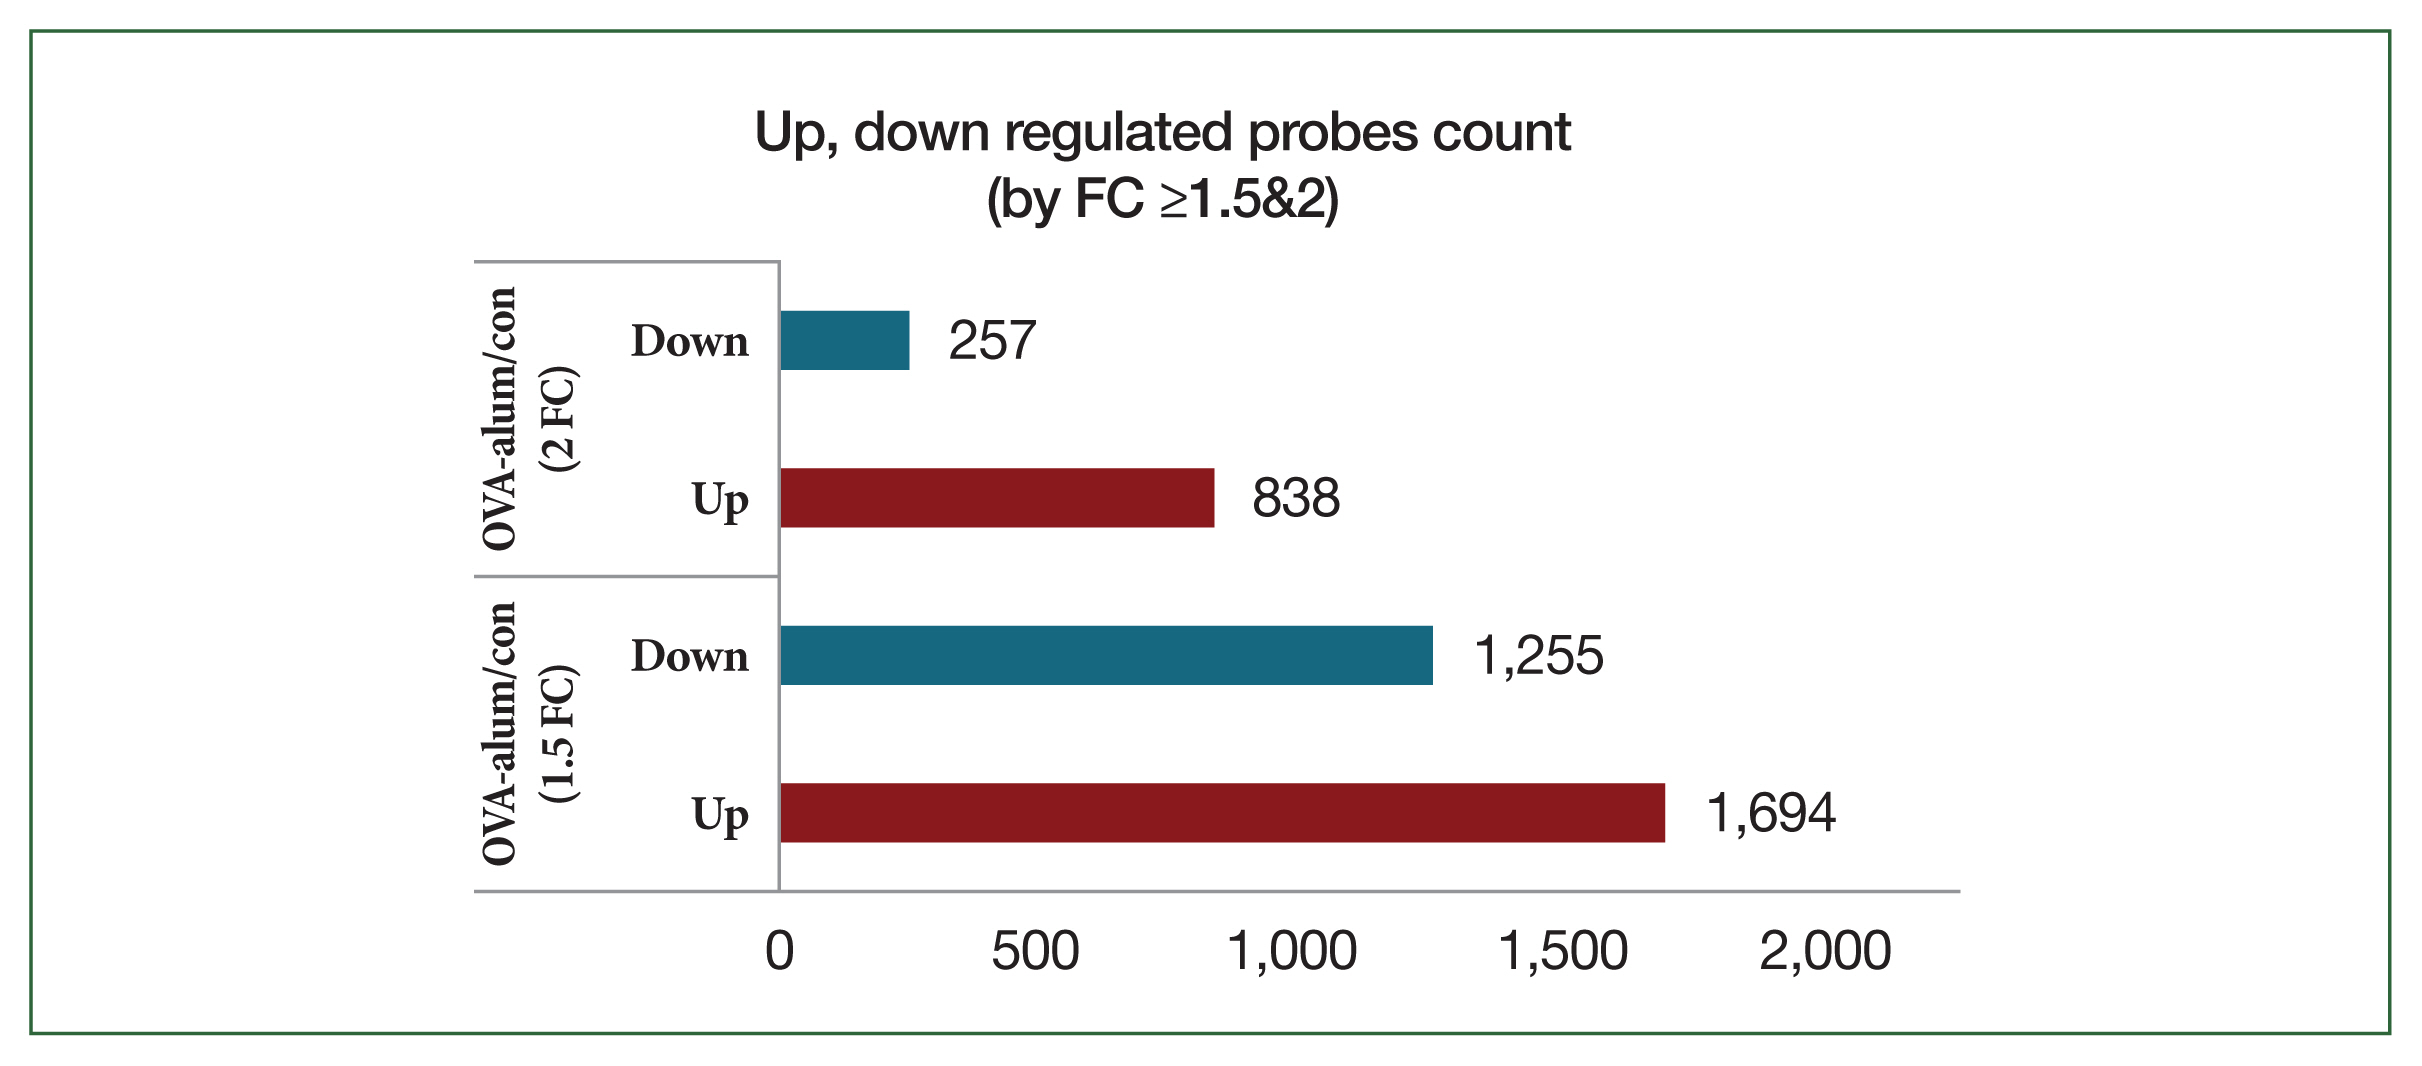
In contrast, OVA-alum-treated mice had significantly higher transcriptional reprogramming, with 1,694 upregulated probes and 1,255 downregulated probes at FC ≥1.5 and 838 upregulated probes and 257 downregulated probes at FC ≥2 (
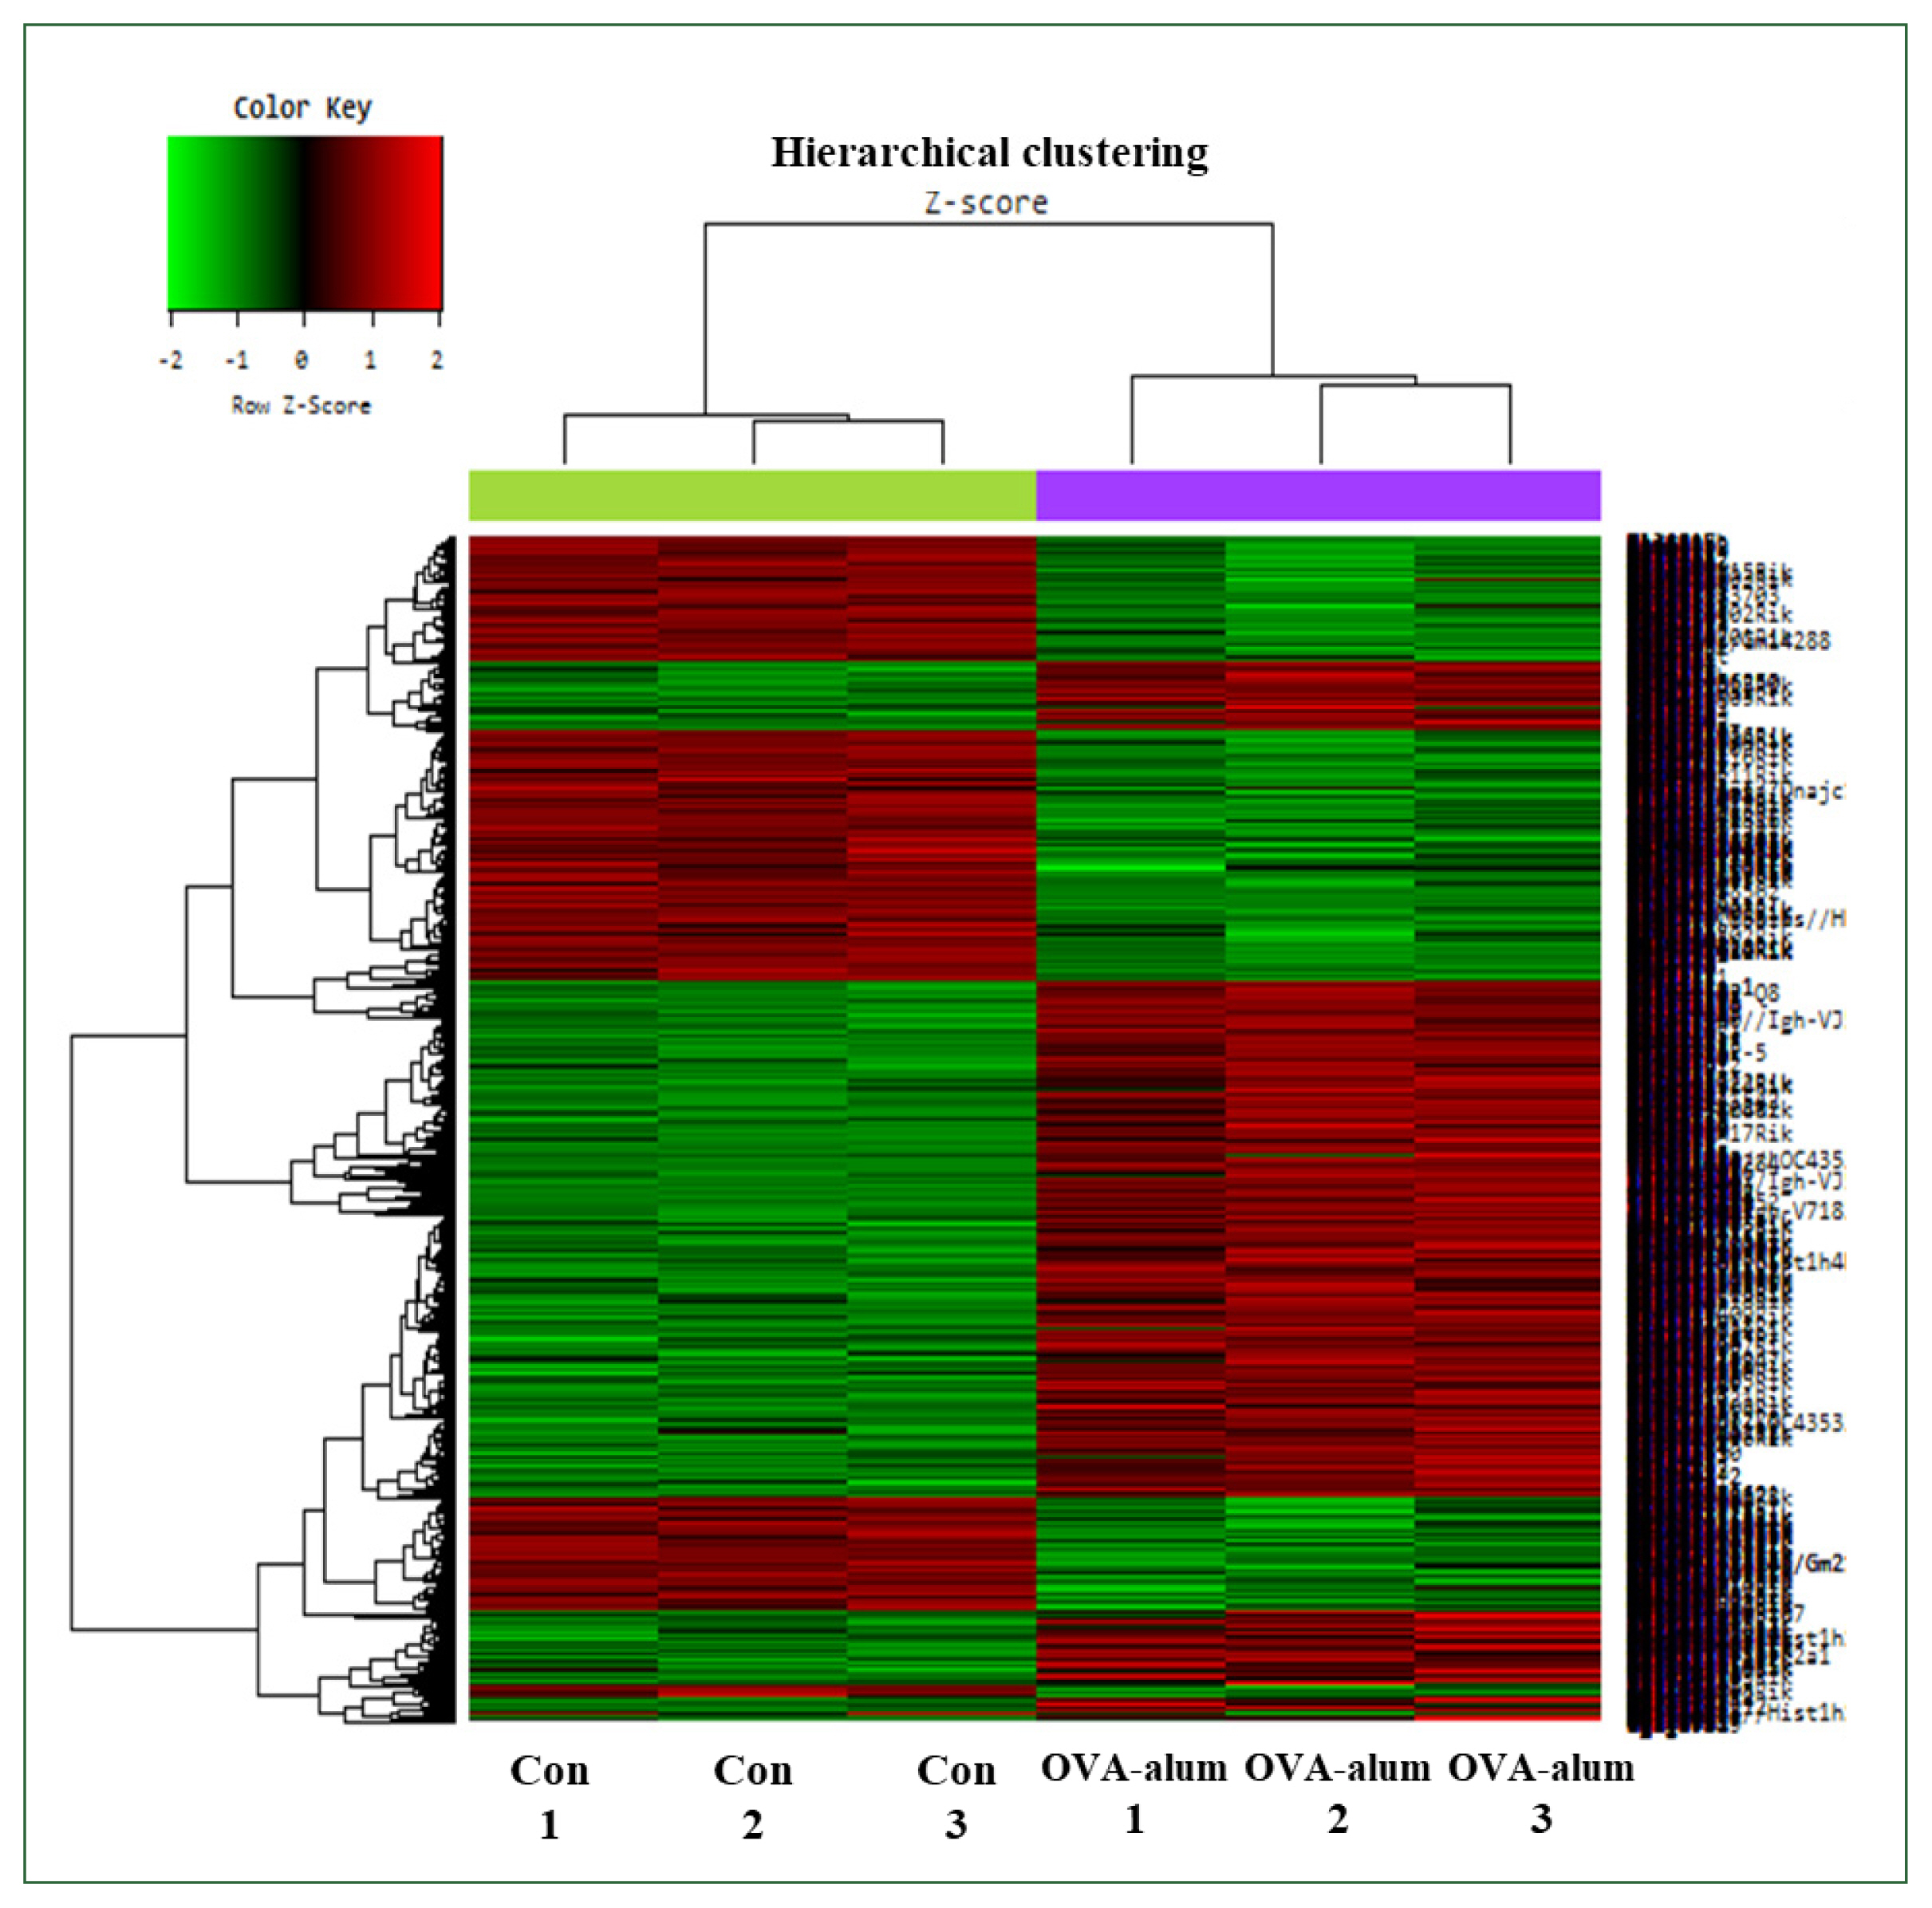
Fig. 5). The heat map comparing the OVA-alum and control groups revealed distinct clusters of DEGs. Genes upregulated and downregulated in the OVA-alum group are shown in red and green, respectively (
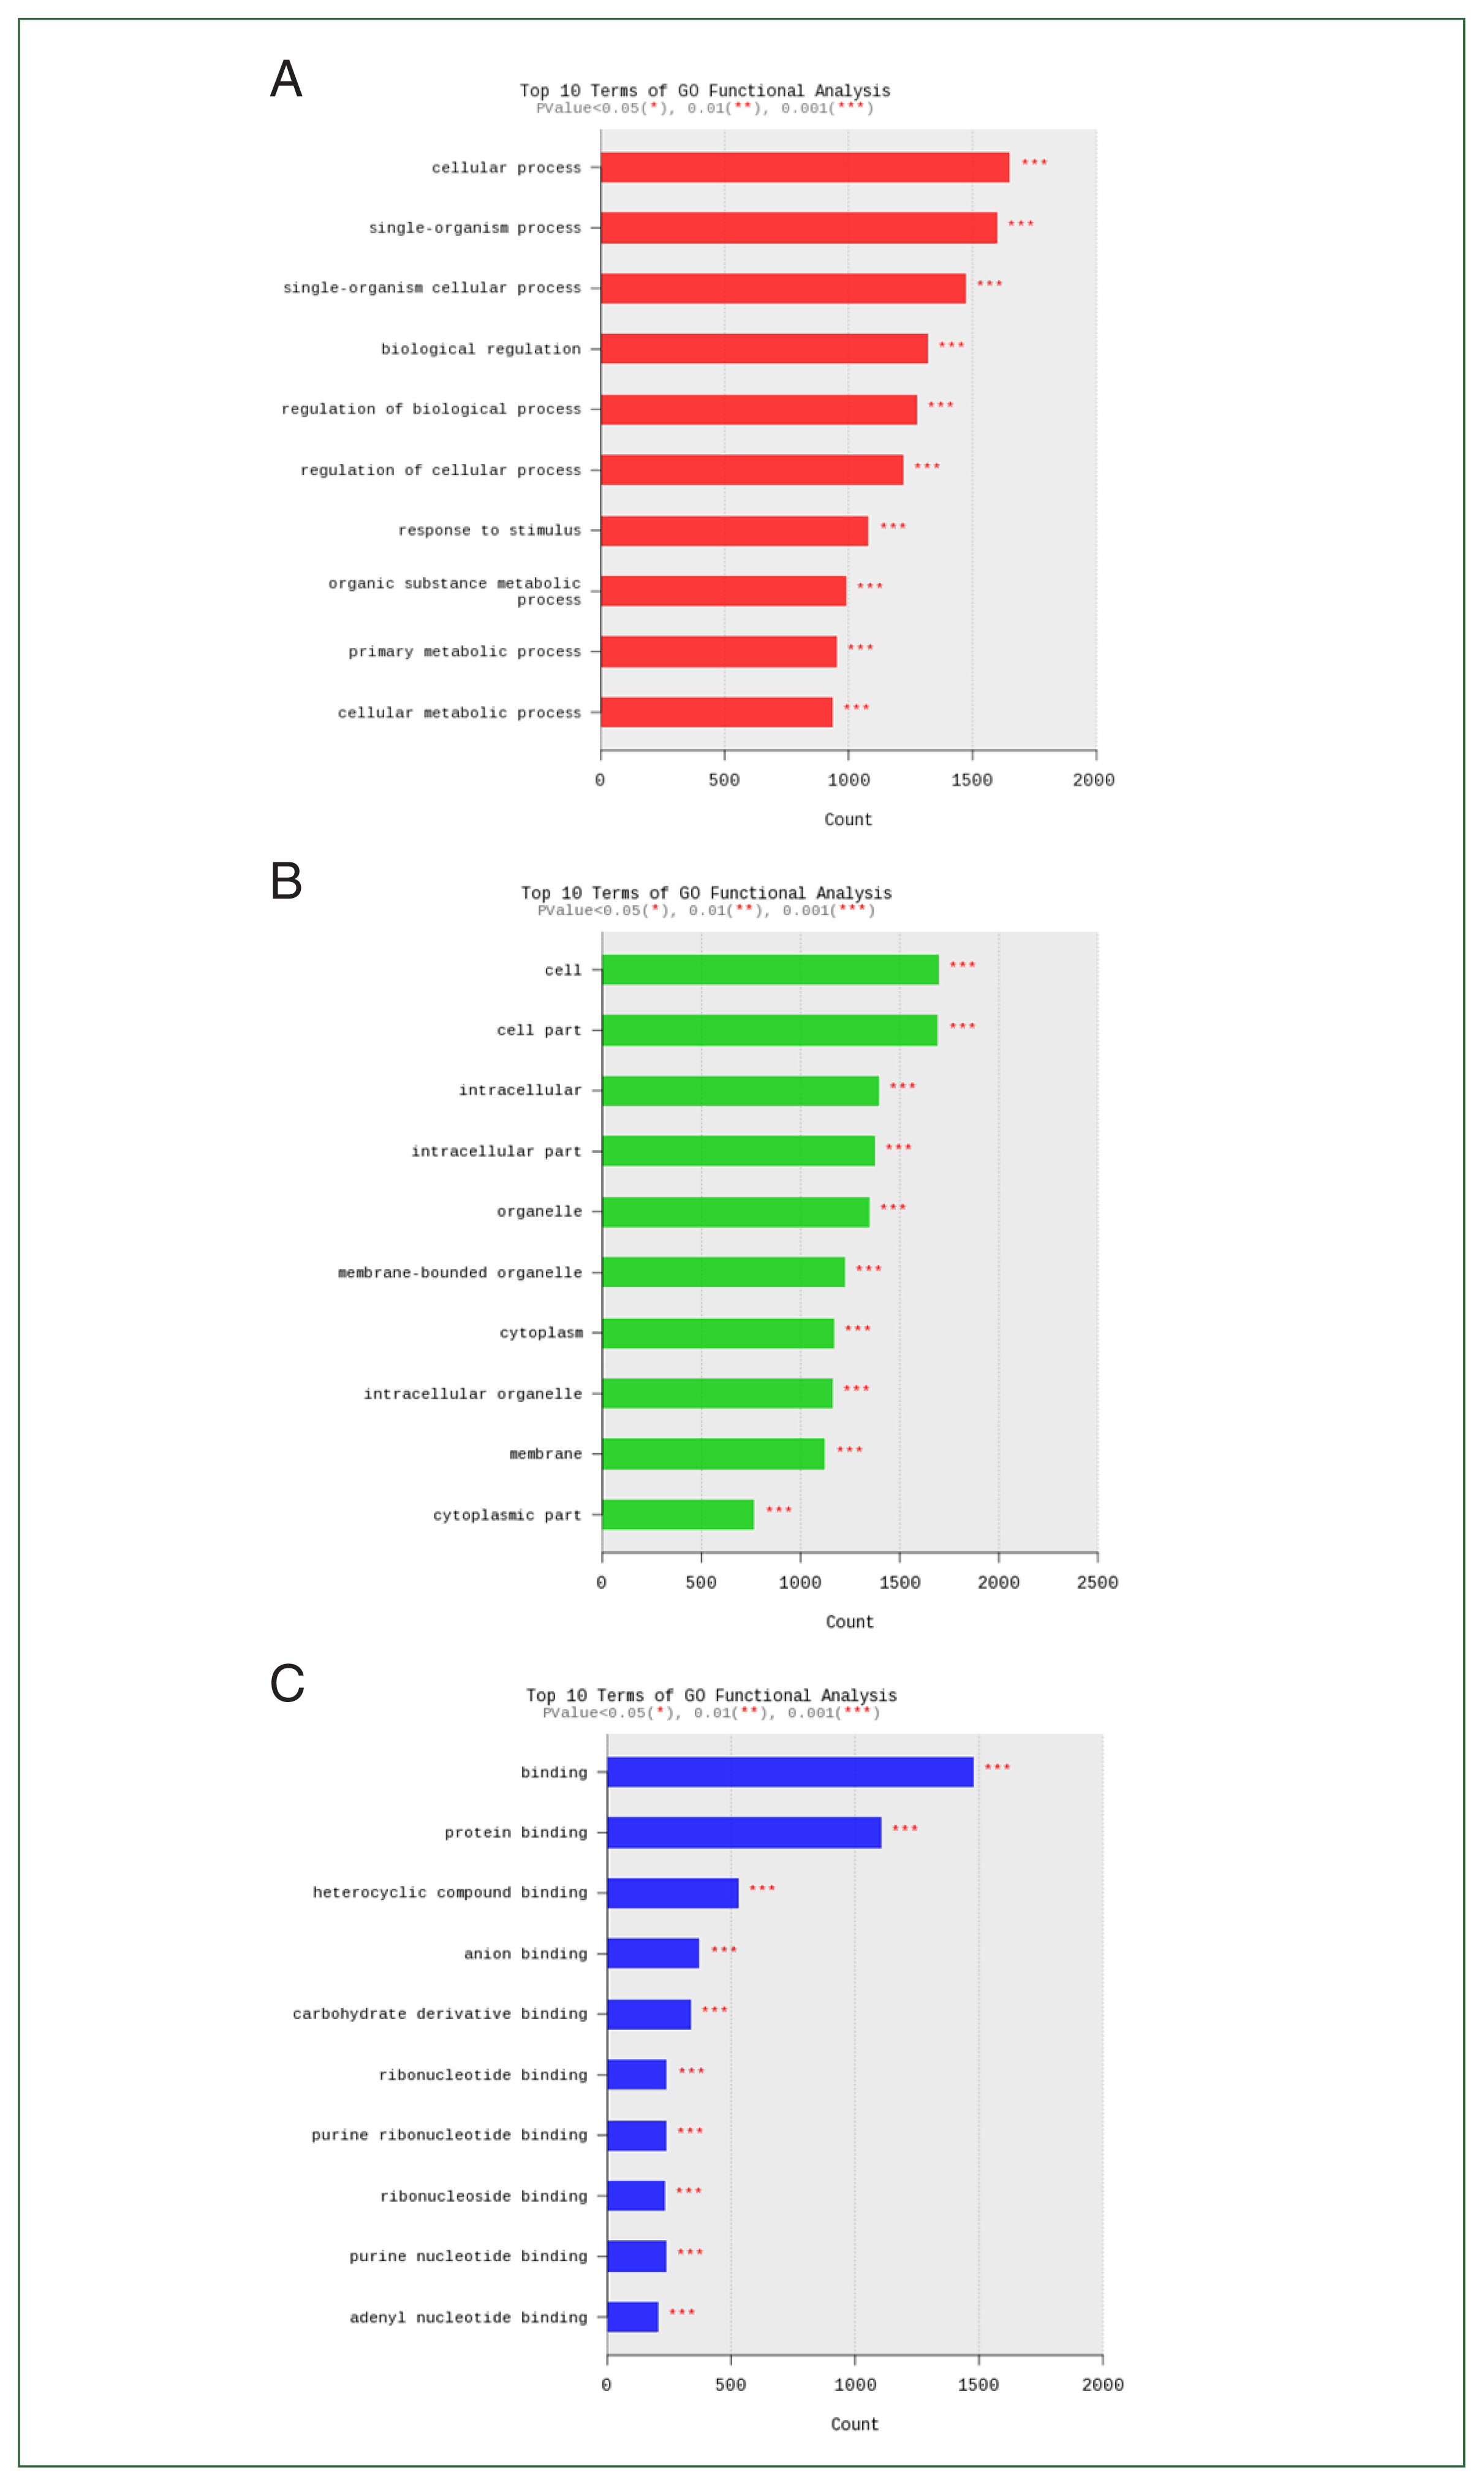
Fig. 6). The genes downregulated and upregulated after
Acanthamoeba exposure were closely related to cellular processes, cells, and binding (
Fig. 7).
To identify molecular differences between the
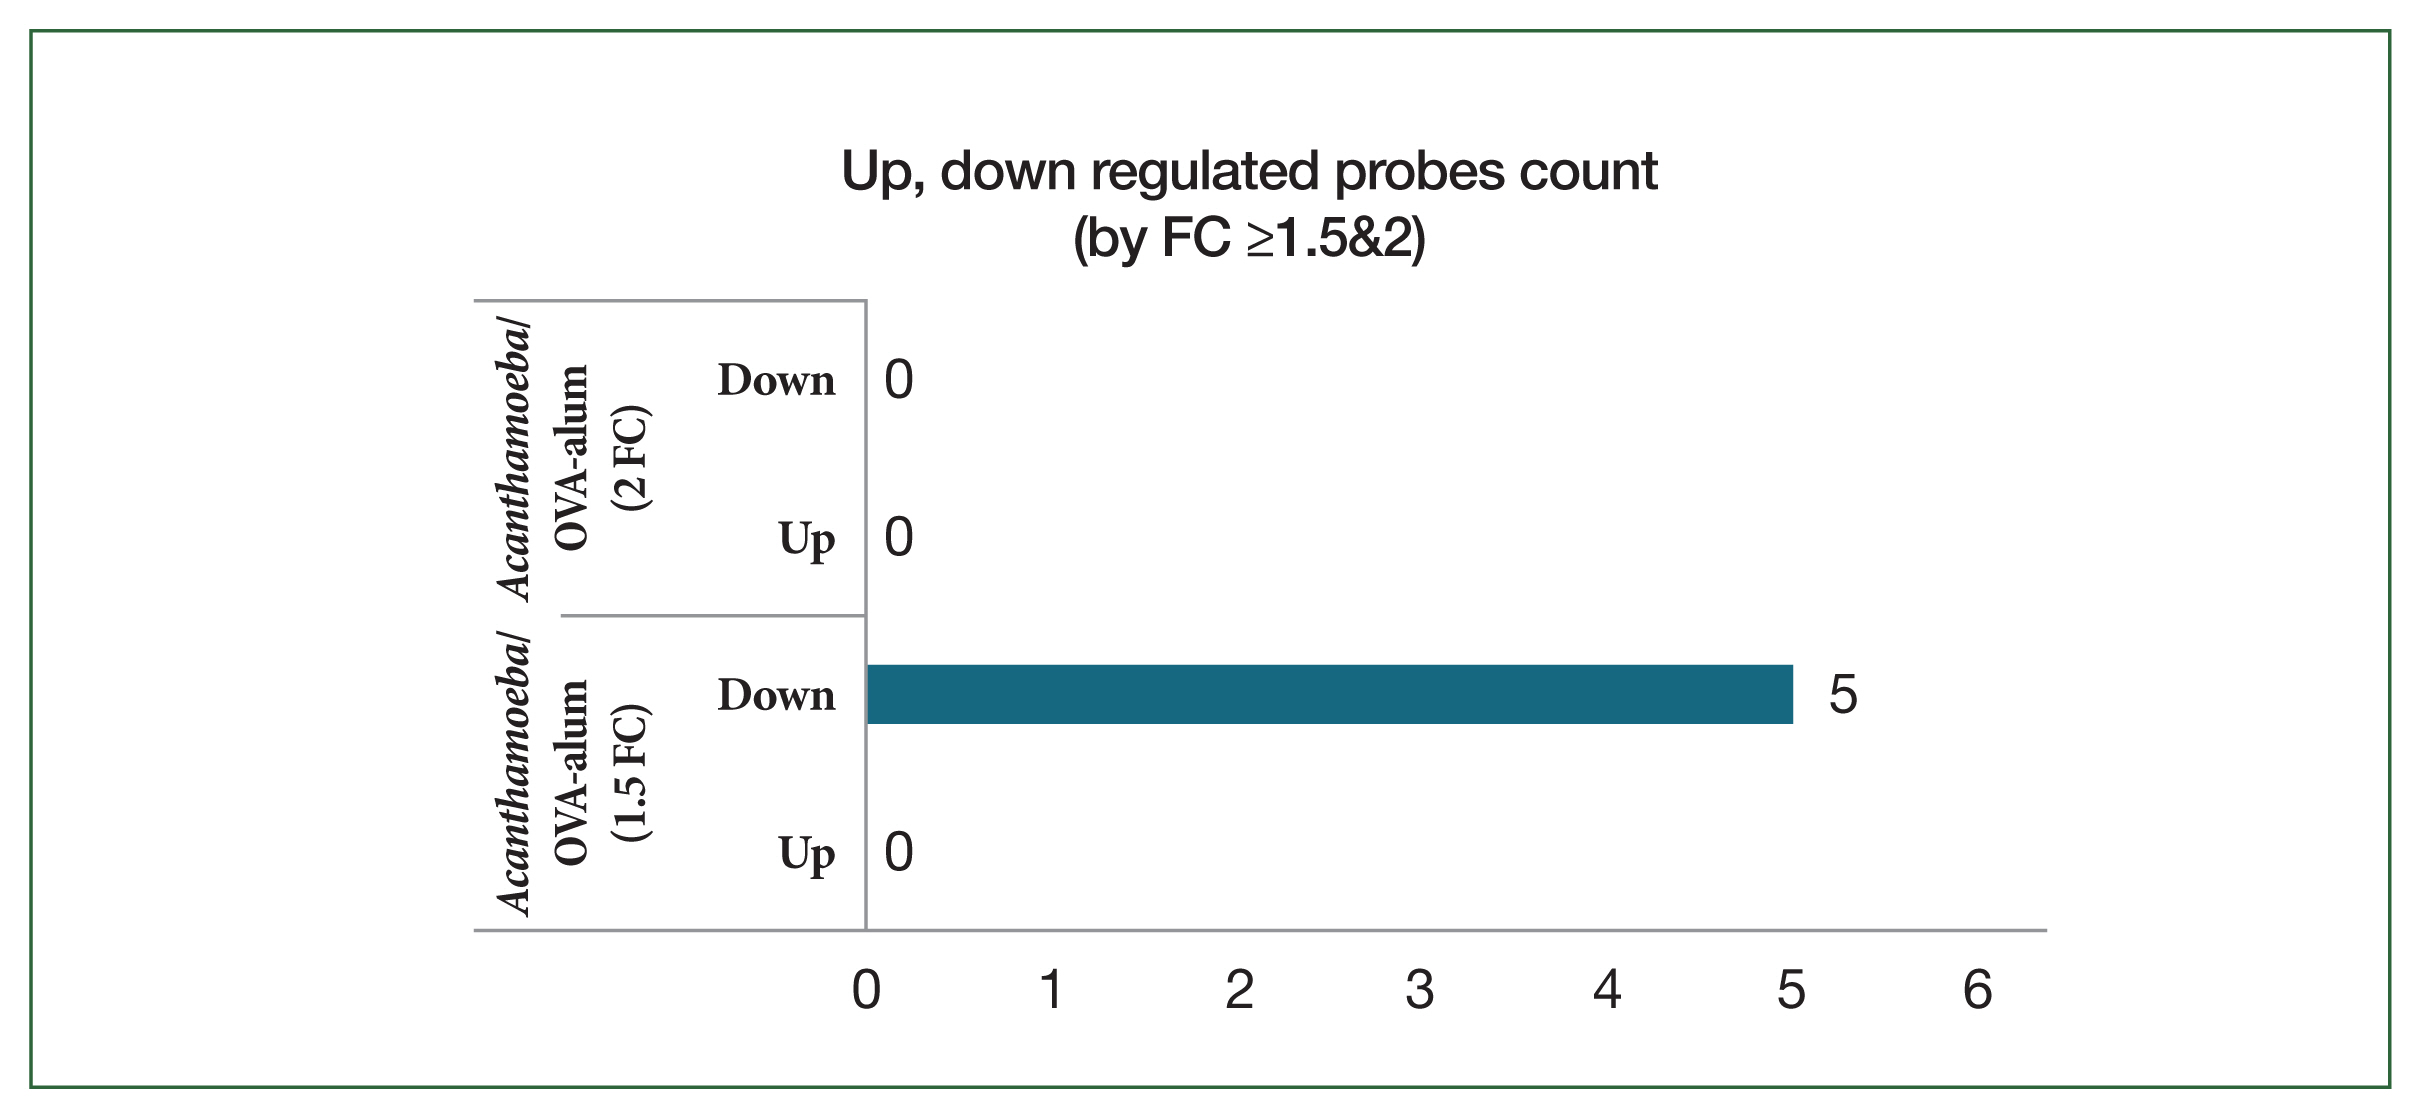
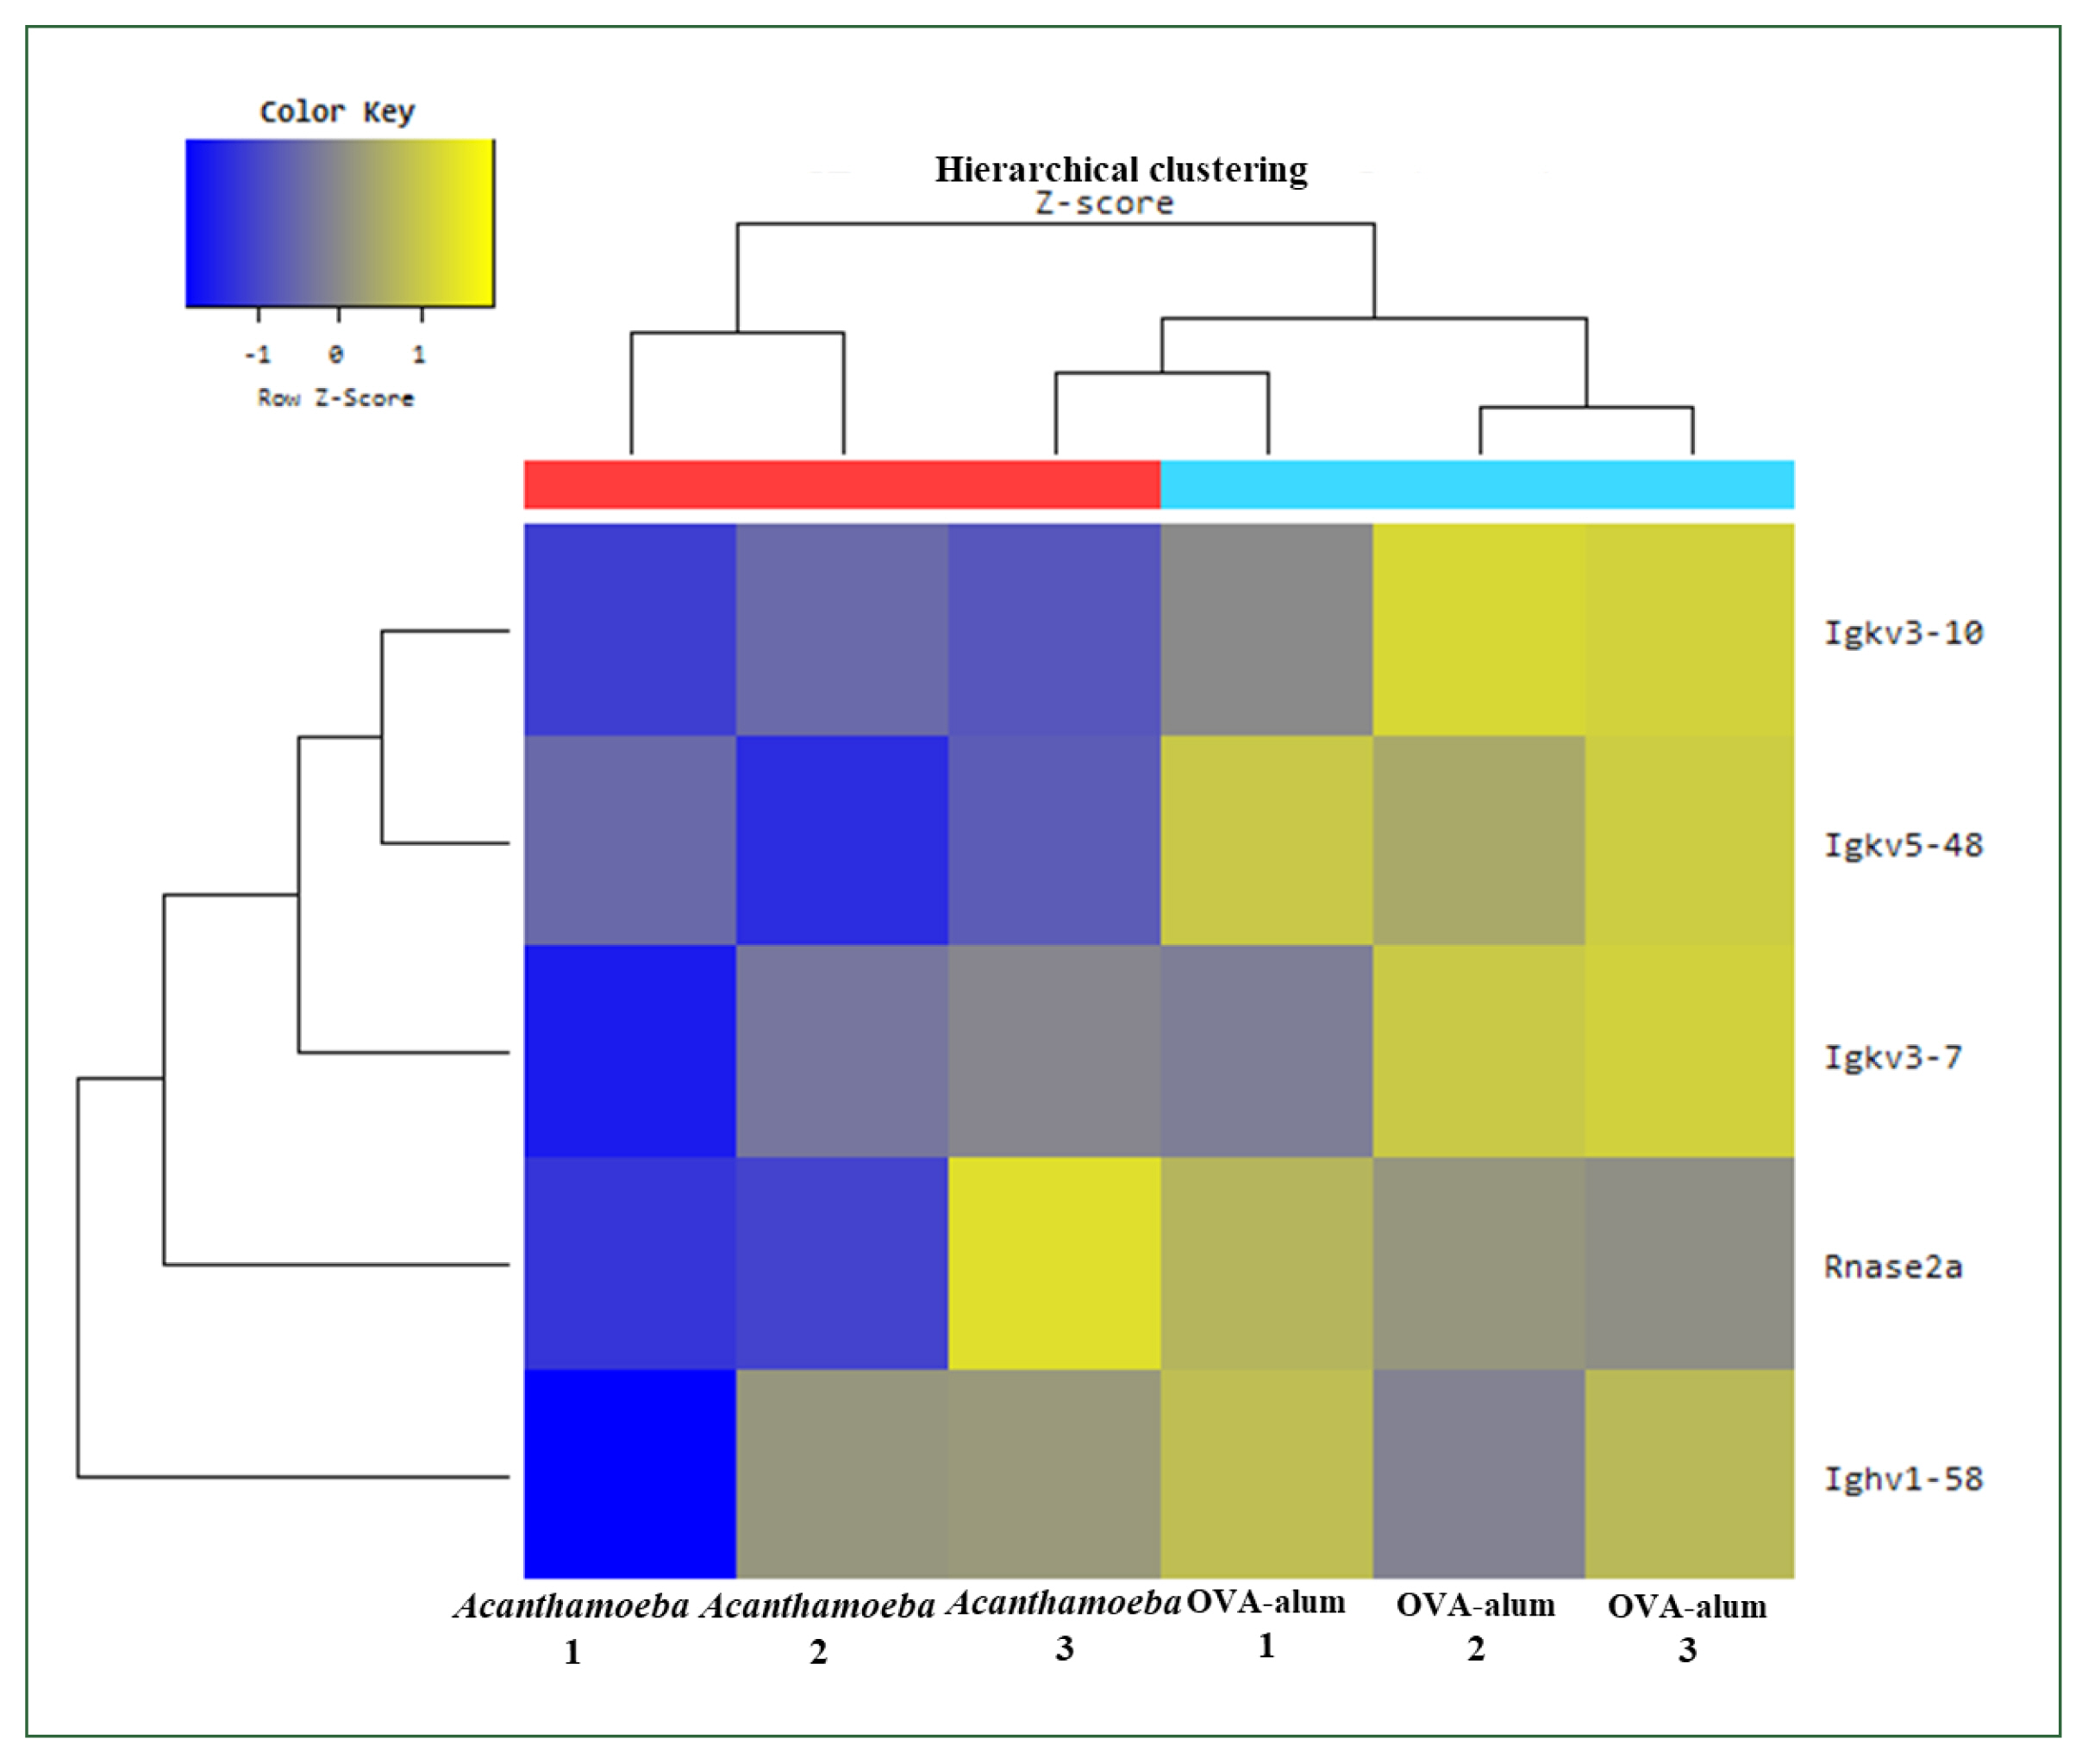
Acanthamoeba-induced and OVA-alum–nduced airway inflammation models, transcriptome analysis was performed using lung tissue samples from each group. Microarray analysis identified significant DEGs between the 2 models. The results showed that 4 genes related to humoral immunity and one gene related to eosinophilic inflammation were significantly downregulated in the
Acanthamoeba group compared to the OVA-alum group (
Fig. 8).
Among the downregulated genes, several immunoglobulin variable region genes, including Ighv1–58, Igkv3–10, Igkv3–7, and Igkv5–48, were significantly suppressed in the
Acanthamoeba group (
Fig. 9). These genes relate to B cell receptor diversity and antibody production, suggesting reduction of B cell activation and humoral immune responses in this model. In contrast, these genes were upregulated in the OVA-alum group, consistent with its Th2 and IgE-mediated allergic inflammation profile.
Rnase2a, a gene that encodes eosinophil-derived neurotoxin and is considered a marker of eosinophil activation, was significantly downregulated in the
Acanthamoeba group (
Fig. 9). This finding suggests that eosinophilic inflammation, a hallmark of Th2-type allergic responses, is less pronounced in the
Acanthamoeba model.
Next, we compared the expression of 5 genes showing significantly decreased expression in lung tissue samples from the OVA-alum model compared to the
Acanthamoeba model. We also compared expression of these genes between the 2 model groups and the control group.
Table 1 shows the log FC in gene expression relative to controls or between experimental groups. Overall, there was significantly stronger induction of immunoglobulin-related genes and innate immune markers in the OVA-alum group compared to the
Acanthamoeba group.
Acanthamoeba treatment also increased the expression of certain genes, but to a significantly lesser extent than OVA-alum. Both
Acanthamoeba and OVA-alum treatments (
Acanthamoeba/OVA-alum) resulted in consistent downregulation, suggesting that
Acanthamoeba induces a weaker immune response than the conventional OVA-alum adjuvant model.
Based on GO enrichment and functional annotation analysis, only one of the significantly downregulated DEGs was annotated (Rnase2a). Immunoglobulin-associated genes were not mapped to GO terms due to limited expression coverage in the current GO annotation database. As a result, additional pathway-based enrichment analysis using KEGG or Reactome is warranted to better interpret the functional significance of these DEGs.
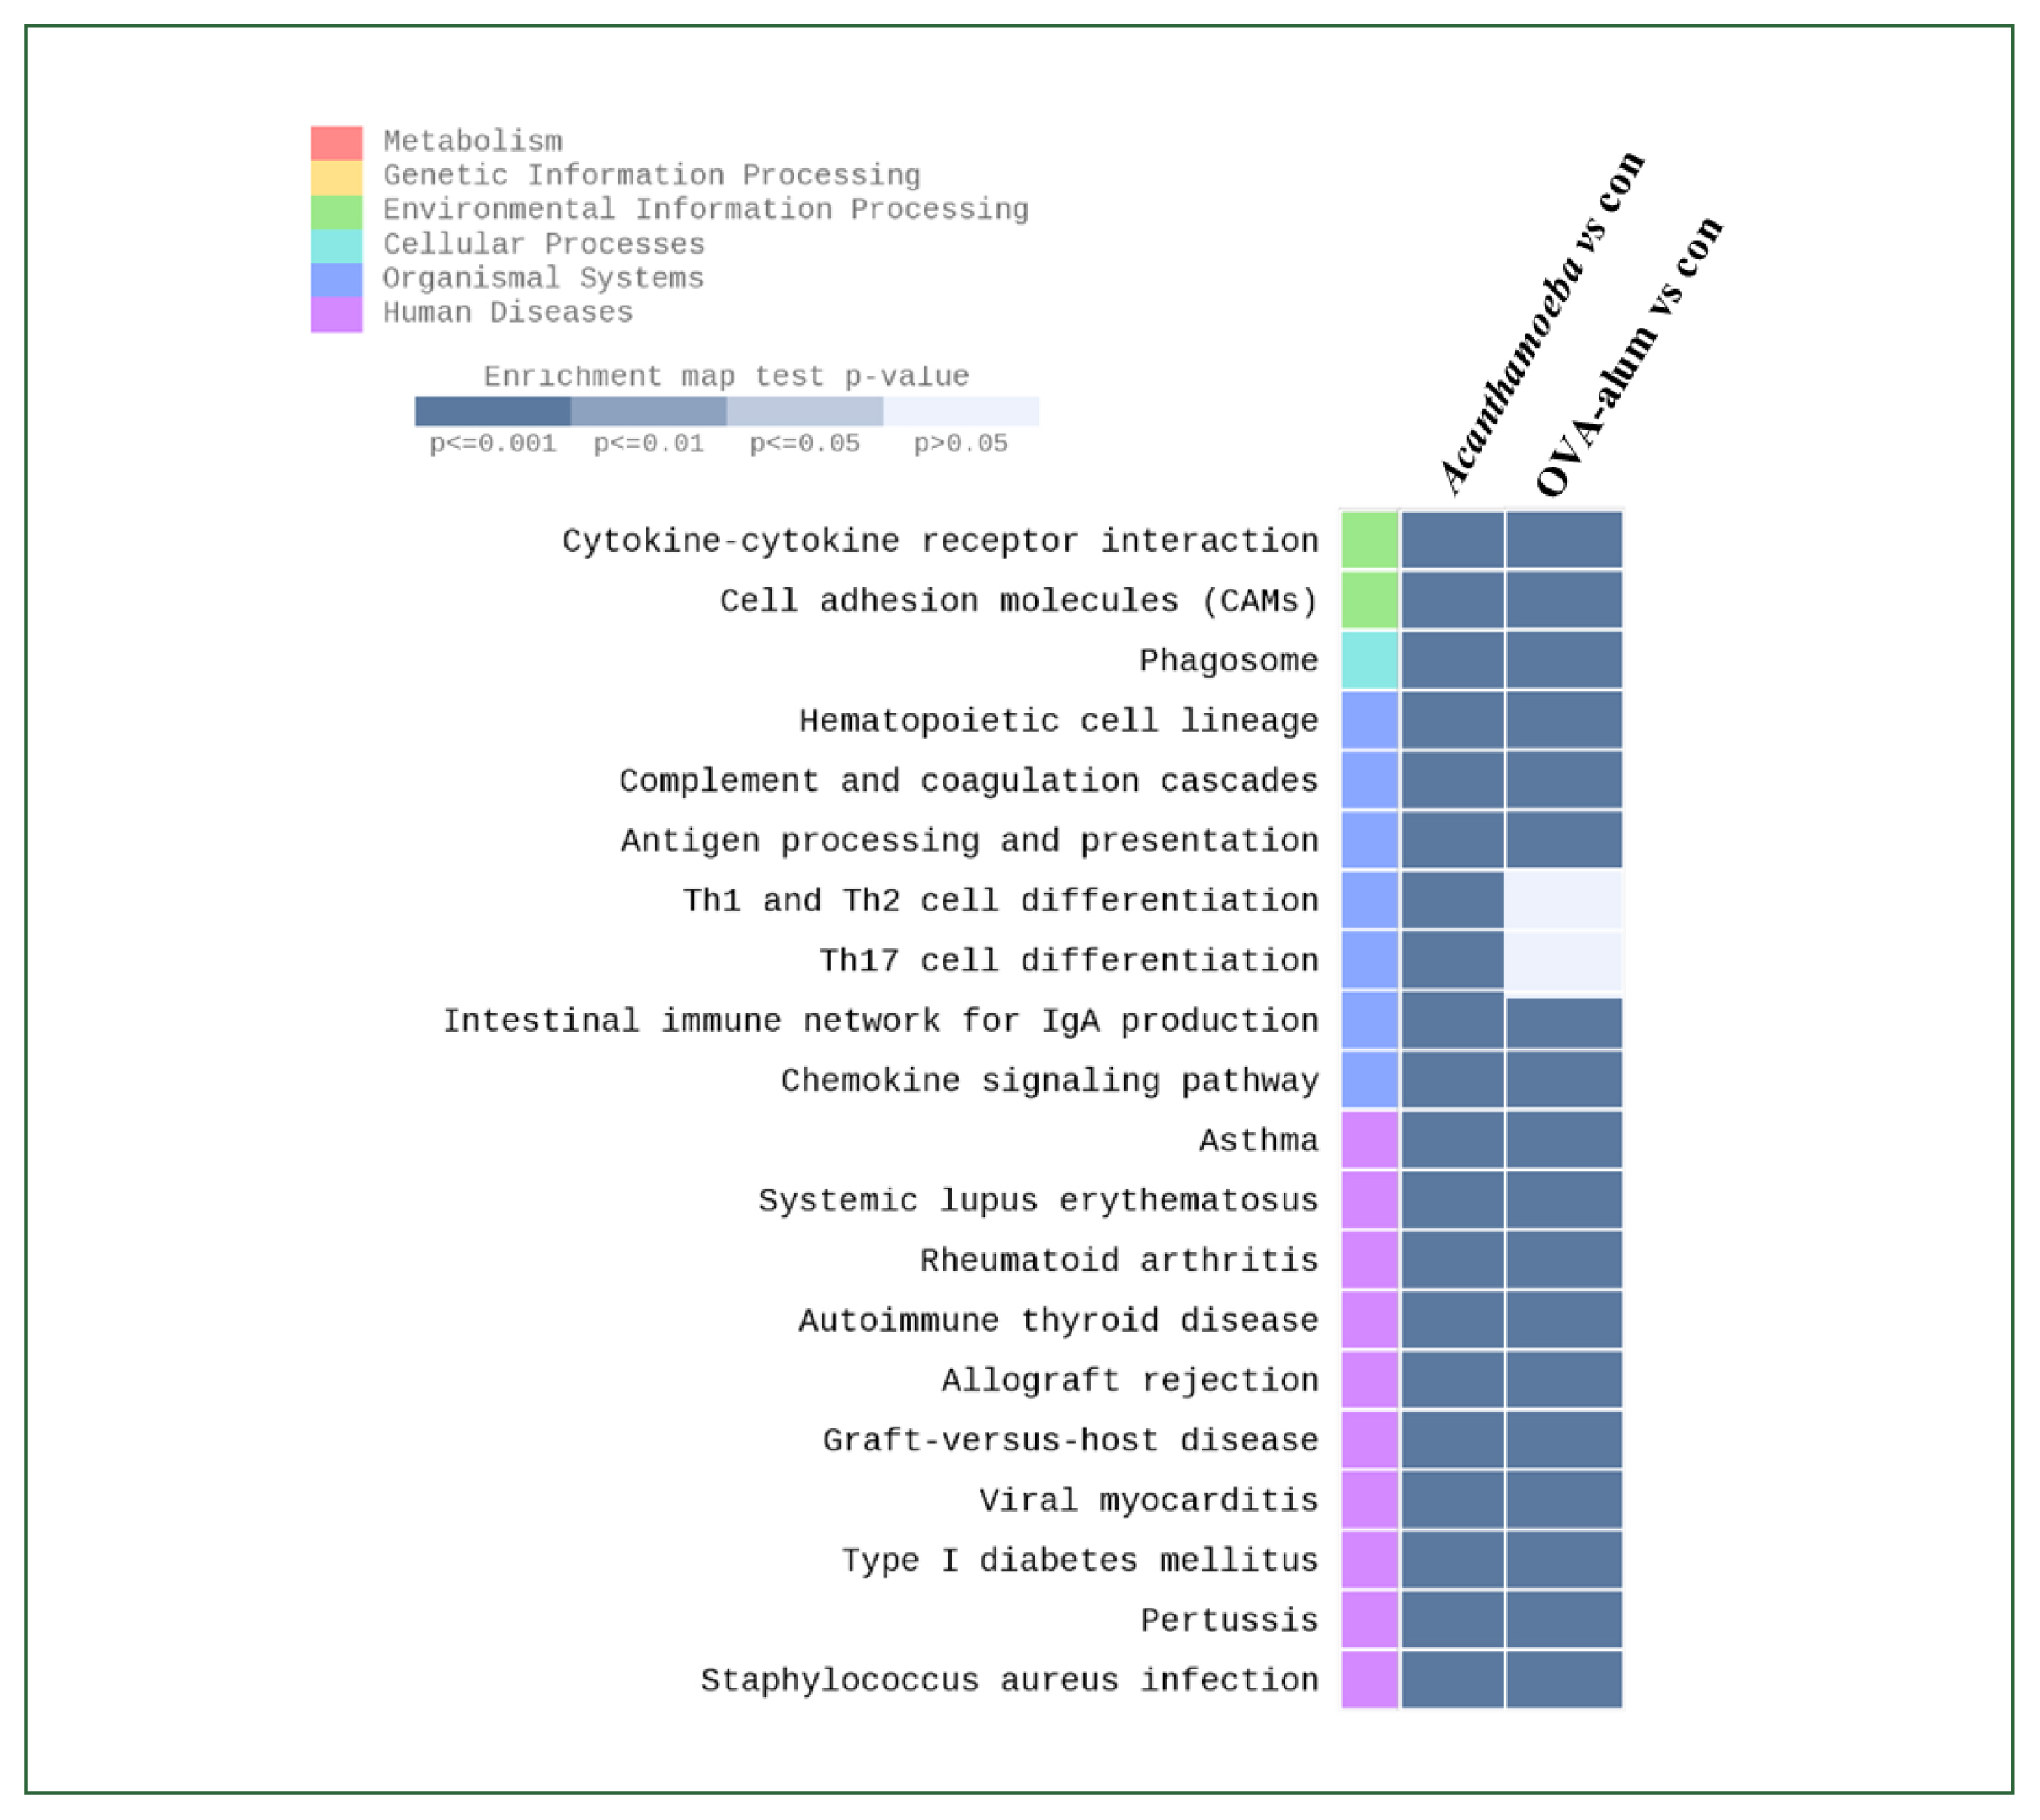
KEGG pathway analysis results
Fig. 10 indicates increased expression of KEGG pathways based on DEGs, especially when comparing airway inflammation models (e.g.,
Acanthamoeba vs. control or OVA-alum). The intensity of the color indicates statistical significance (
P-value), with darker colors indicating a more significant increase in expression. Enrichment analysis based on the KEGG pathway showed highly significant DEGs following treatment with
Acanthamoeba or OVA-alum compared to the group. Although some common pathways (e.g., Th1 and Th2 cell differentiation, Th17 differentiation) were detected between the models, their relative enrichment and statistical significance differed.
Discussion
OVA-alum is a Th2 polarizing adjuvant known to induce a potent inflammatory response, including eosinophil mobilization, antigen-specific IgE production, and upregulation of proinflammatory cytokines in the lung [
14]. Consistent with previous findings [
15], our transcriptome analysis revealed that OVA-alum stimulation resulted in extensive transcriptional changes, affecting more than 2,949 probes (FC ≥1.5) (
Fig. 2). These changes likely reflect activation of innate and adaptive immune pathways, including antigen presentation, lymphocyte activation, and cytokine production.
In contrast, exposure to
Acanthamoeba resulted in a significantly weaker transcriptional response, with only 456 modified probes at FC ≥1.5 and 168 probes at FC ≥2 (
Fig. 5). Although there was some immune gene activation, the magnitude and extent of the response was significantly lower compared to the OVA-alum model.
These findings suggest that Acanthamoeba may not act as a potent proinflammatory stimulus in the lung; alternatively, the immune activity induced by Acanthamoeba may be more selective or modulatory, affecting only some pathways.
Our comparison of gene expression in lung tissue samples from OVA-alum induced and Acanthamoeba-exposed airway inflammation models identified notable differences. Several immunoglobulin variable region genes, including Ighv1–58, Igkv3–10, Igkv3–7, Igkv5–48, and the eosinophil-associated gene Rnase2a, were significantly downregulated in the Acanthamoeba model compared to the conventional OVA-alum model. These results suggest that Acanthamoeba triggers a unique inflammatory pathway that is not heavily reliant on B cell-mediated humoral responses or eosinophil activation, unlike the typical Th2-biased allergic response observed in the OVA-alum sensitization model.
Notably, OVA-alum modulated over 2,900 probes at FC ≥1.5, whereas Acanthamoeba modulated <500 probes. This significant difference in the overall number and amplitude of regulated genes suggests that Acanthamoeba induces a weaker and more selective immune response than OVA-alum adjuvants.
Next, we performed GO enrichment and functional annotation analysis to identify the biological processes associated with DEGs between the
Acanthamoeba and OVA-alum airway inflammation models. Among the genes significantly downregulated in the
Acanthamoeba model, only Rnase2a was annotated with GO terms and included in the enrichment results. This limited annotation precluded further functional analysis using GO-based enrichment methods for the remaining immunoglobulin-associated genes [
16].
These limitations reflect a broader problem with the current GO databases: immunoglobulin variable region genes are often under-annotated due to their high sequence variability, repetitive nature, and lack of direct functional descriptors [
17]. Although these genes play important roles in antigen recognition and B cell-mediated immune responses [
18], they are often excluded or poorly represented in automated ontology-based analyses [
19].
Given this limitation, alternative strategies such as manual curation, pathway-based enrichment (e.g., using KEGG or Reactome), or immune-specific databases may be required to more accurately determine the functional relevance of these genes [
20]. The collective downregulation of several immunoglobulin variable region genes in the
Acanthamoeba model strongly suggests suppression of B cell activation and humoral immunity [
21], although these genes are absent in the GO annotations. Moreover, these findings starkly contrast with those of the OVA-alum model, which exhibited features consistent with a Th2-dominant antibody-producing allergic response [
22].
Future studies using time-lapse transcriptome analysis could reveal dynamic changes in gene expression that were not captured by our study’s single time point design. Such an analysis could reveal whether Acanthamoeba triggers a delayed or transient response compared to the sustained activation observed with OVA-alum.
Notes
-
Author contributions
Conceptualization: Yu HS
Data curation: Kang SA
Formal analysis: Kang SA
Investigation: Kang SA
Methodology: Kang SA
Project administration: Yu HS
Software: Kang SA
Supervision: Yu HS
Writing – original draft: Kang SA, Yu HS
Writing – review & editing: Kang SA, Yu HS
-
Conflict of interest
Hak Sun Yu serves as an editor of Parasites, Hosts and Diseases but had no involvement in the decision to publish this article. No other potential conflicts of interest relevant to this study were reported.
Fig. 1Experimental model. (A) Induction of allergic airway infiltration through 6 challenge of 1×10⁶ KA/E2 tropozoites. Lung inflammation was induced via intranasal inoculation of 1×10⁶ KA/E2 KA/E2 trophozoites. (B) Mice were sensitized on days 0, 1, 7, and 8 by intraperitoneal injection of ovalbumin (OVA) and challenged intranasally on days 14, 15, 21, and 22 with OVA. AHR, airway hyperresponsiveness.
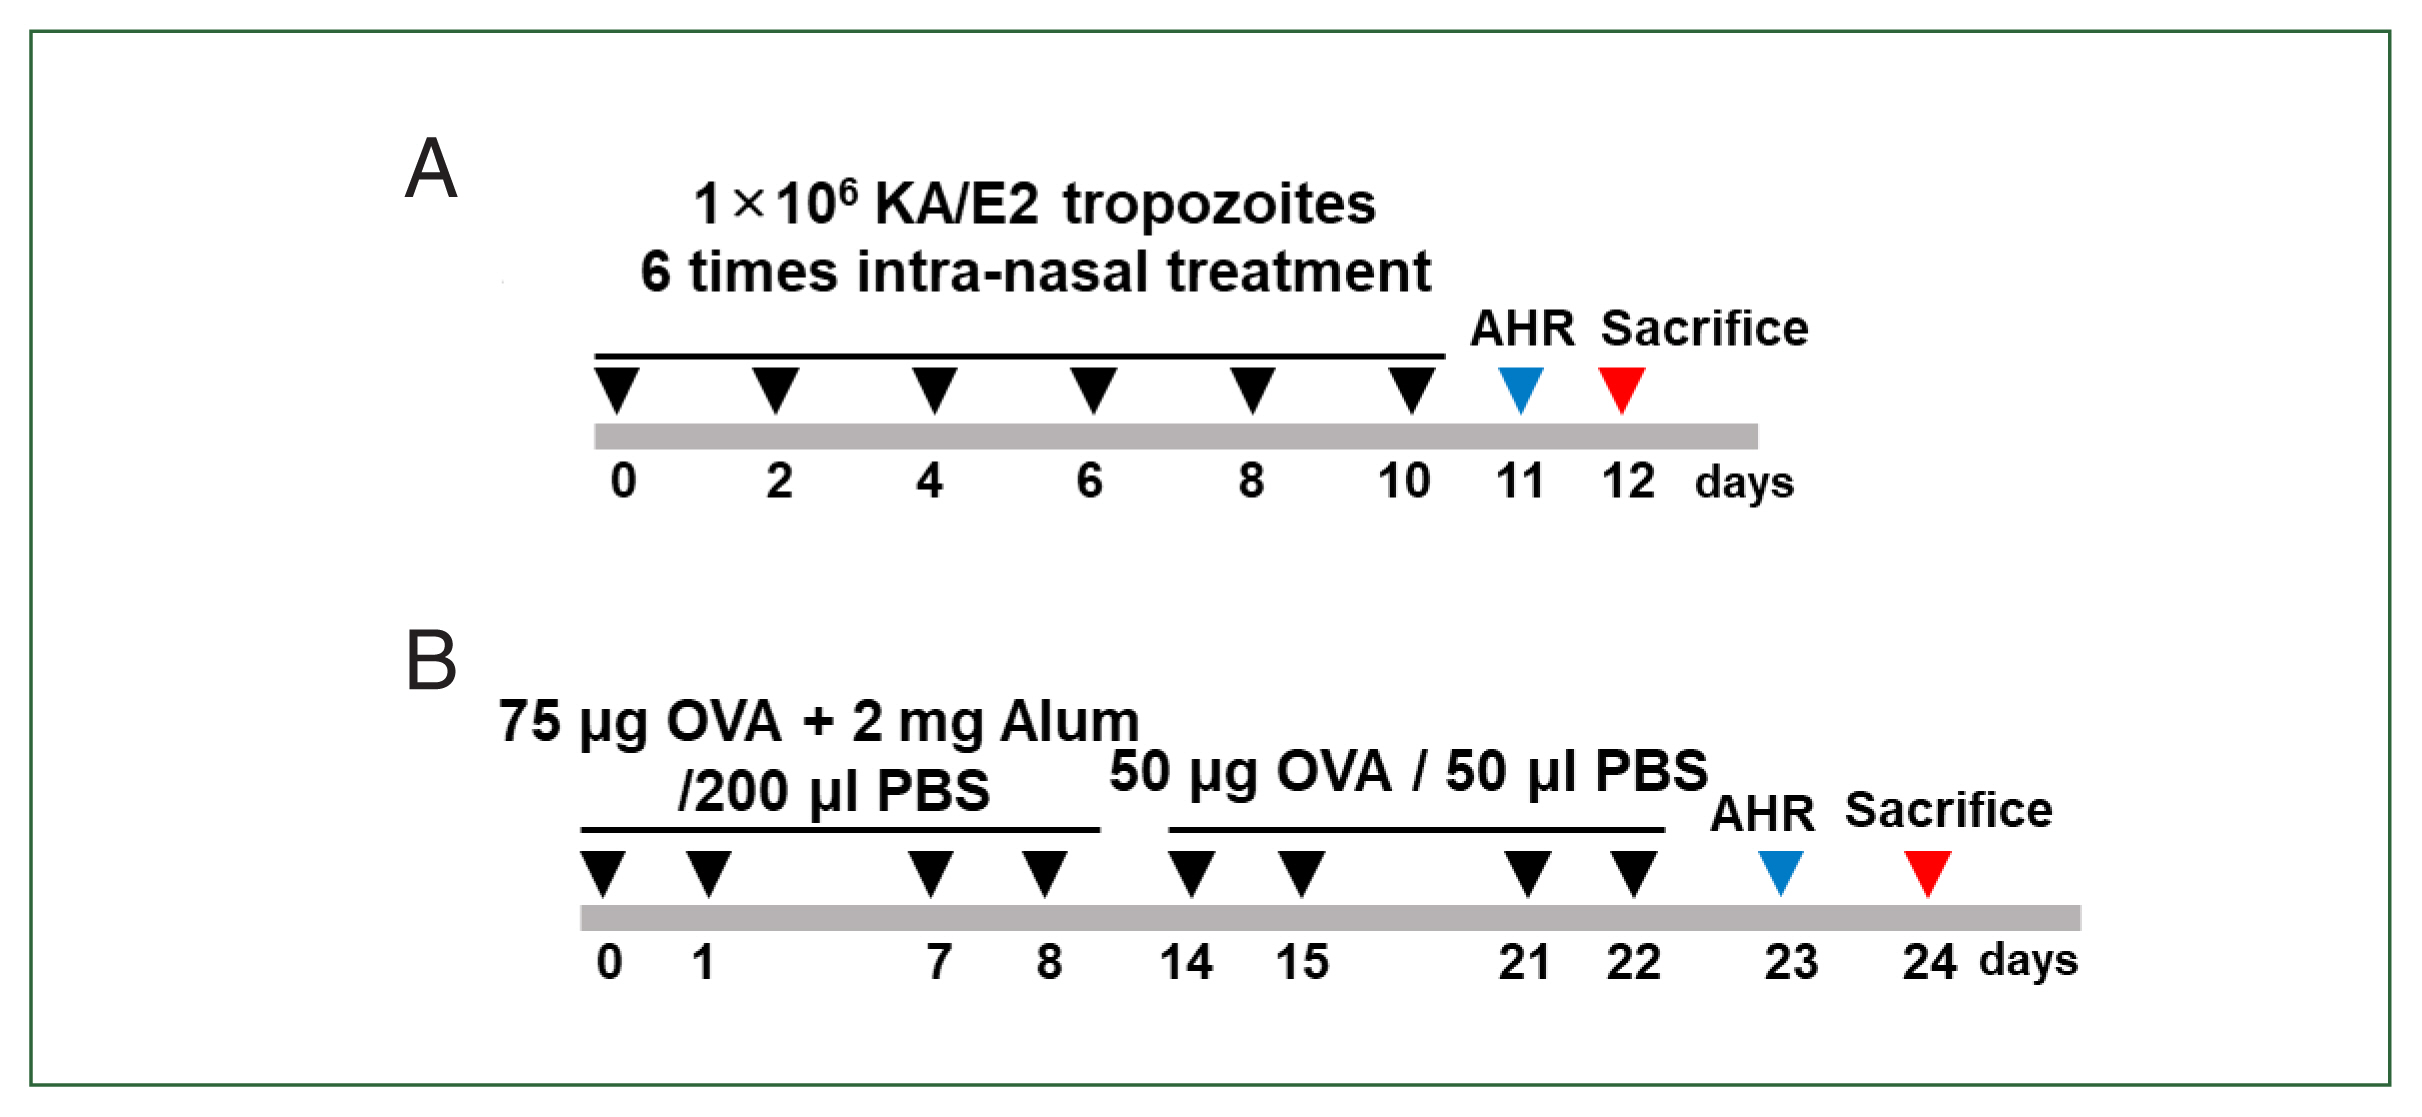
Fig. 2Bar plot of significant probes. We identified 456 and 172 differentially expressed genes with a fold change (FC) of |logFC| ≥1.5 and |logFC| ≥2, respectively, between the Acanthamoeba and control (con) groups.
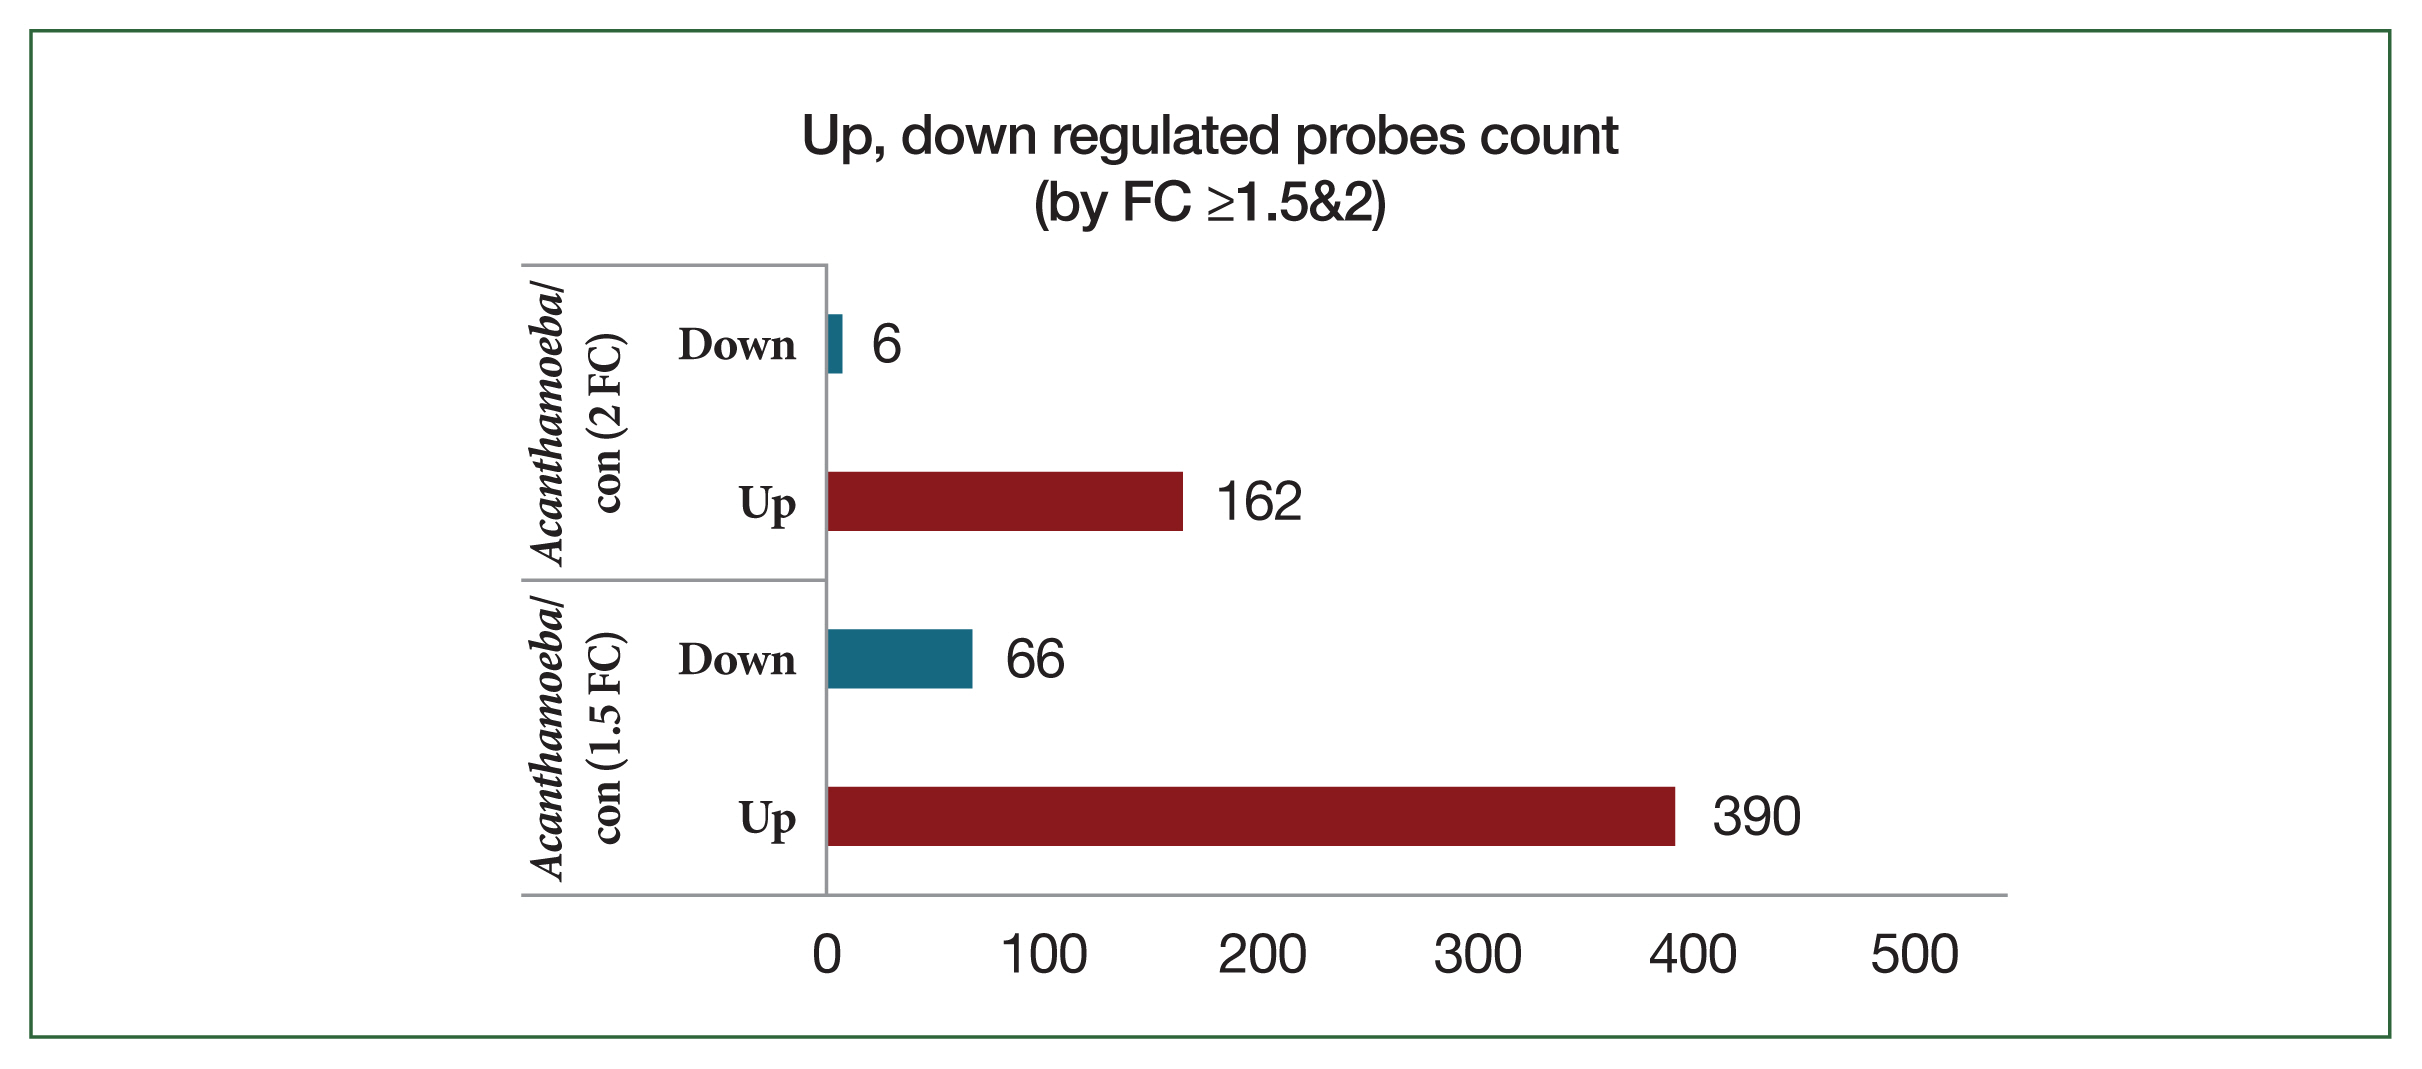
Fig. 3Hierarchical clustering analysis and heat map. The 456 mRNAs with the most significant differences are presented (fold change >1.5, P<0.05). Blue and yellow shading indicates downregulated and upregulated genes, respectively.
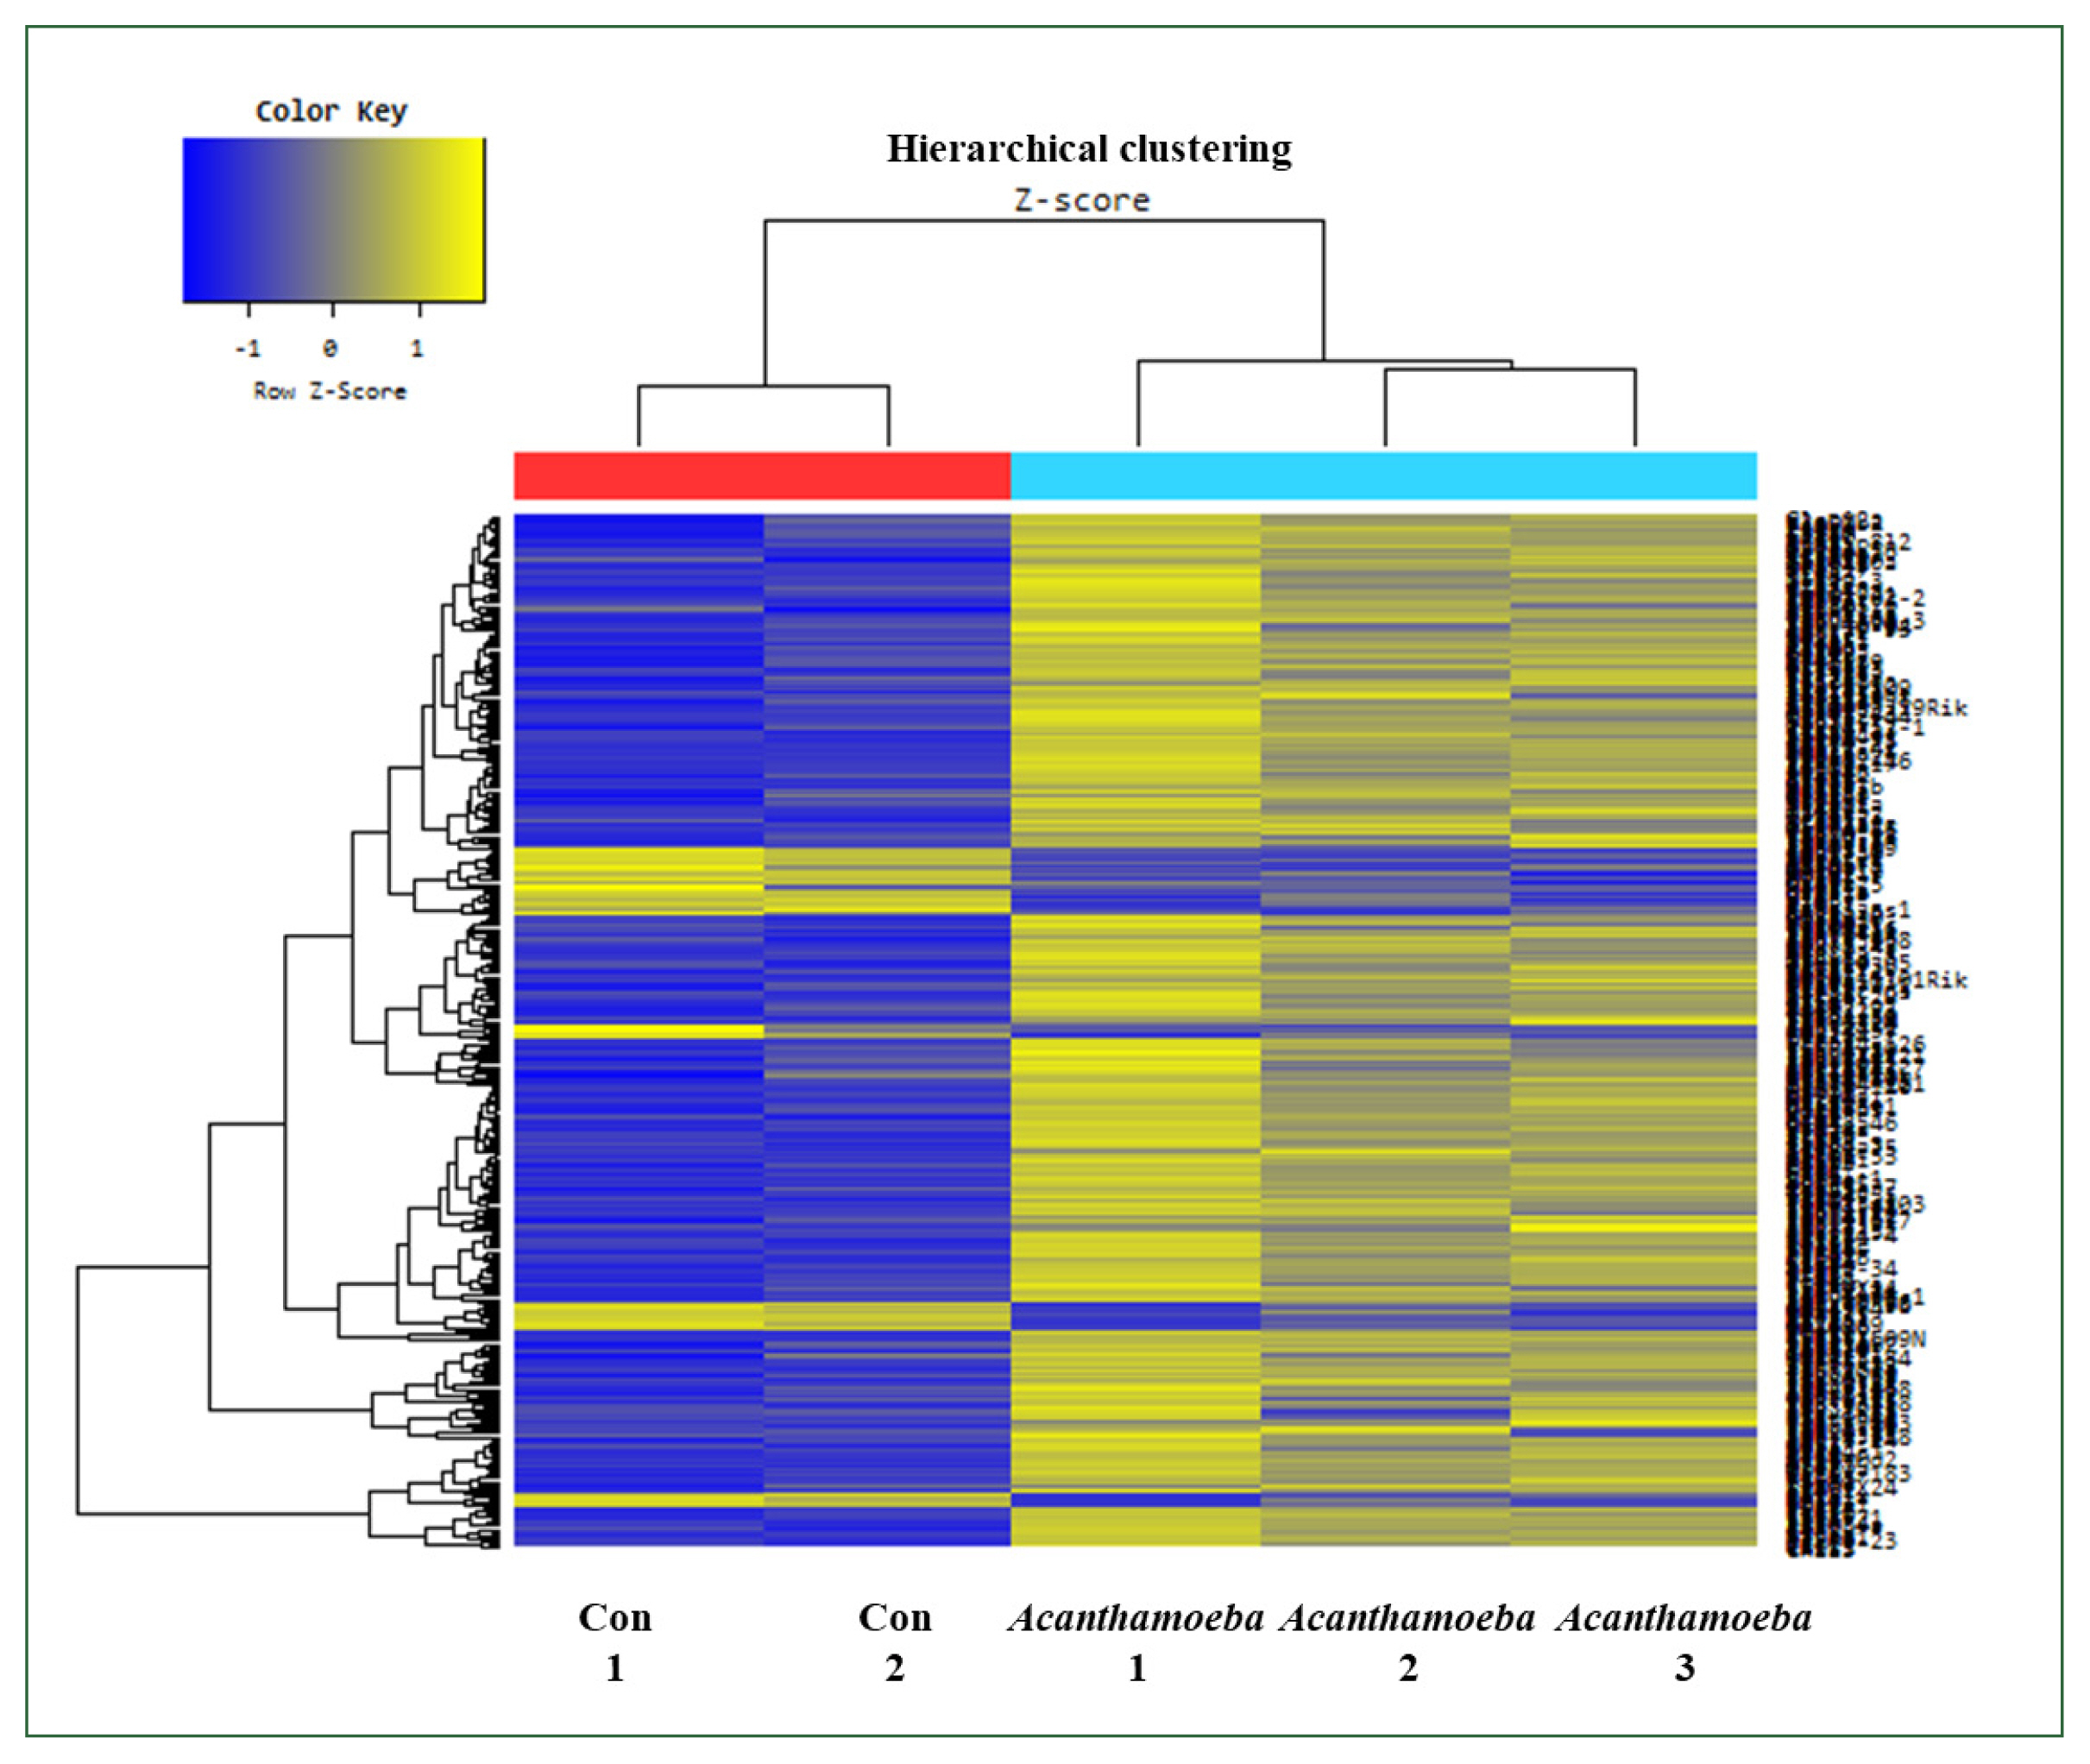
Fig. 4Functional category enrichment analysis of differentially expressed genes. The Y-axis shows significantly enriched gene ontology (GO) terms, while the X-axis shows the counts of these terms. GO analysis includes 3 categories: (A) biological processes, (B) cellular components, and (C) molecular function.
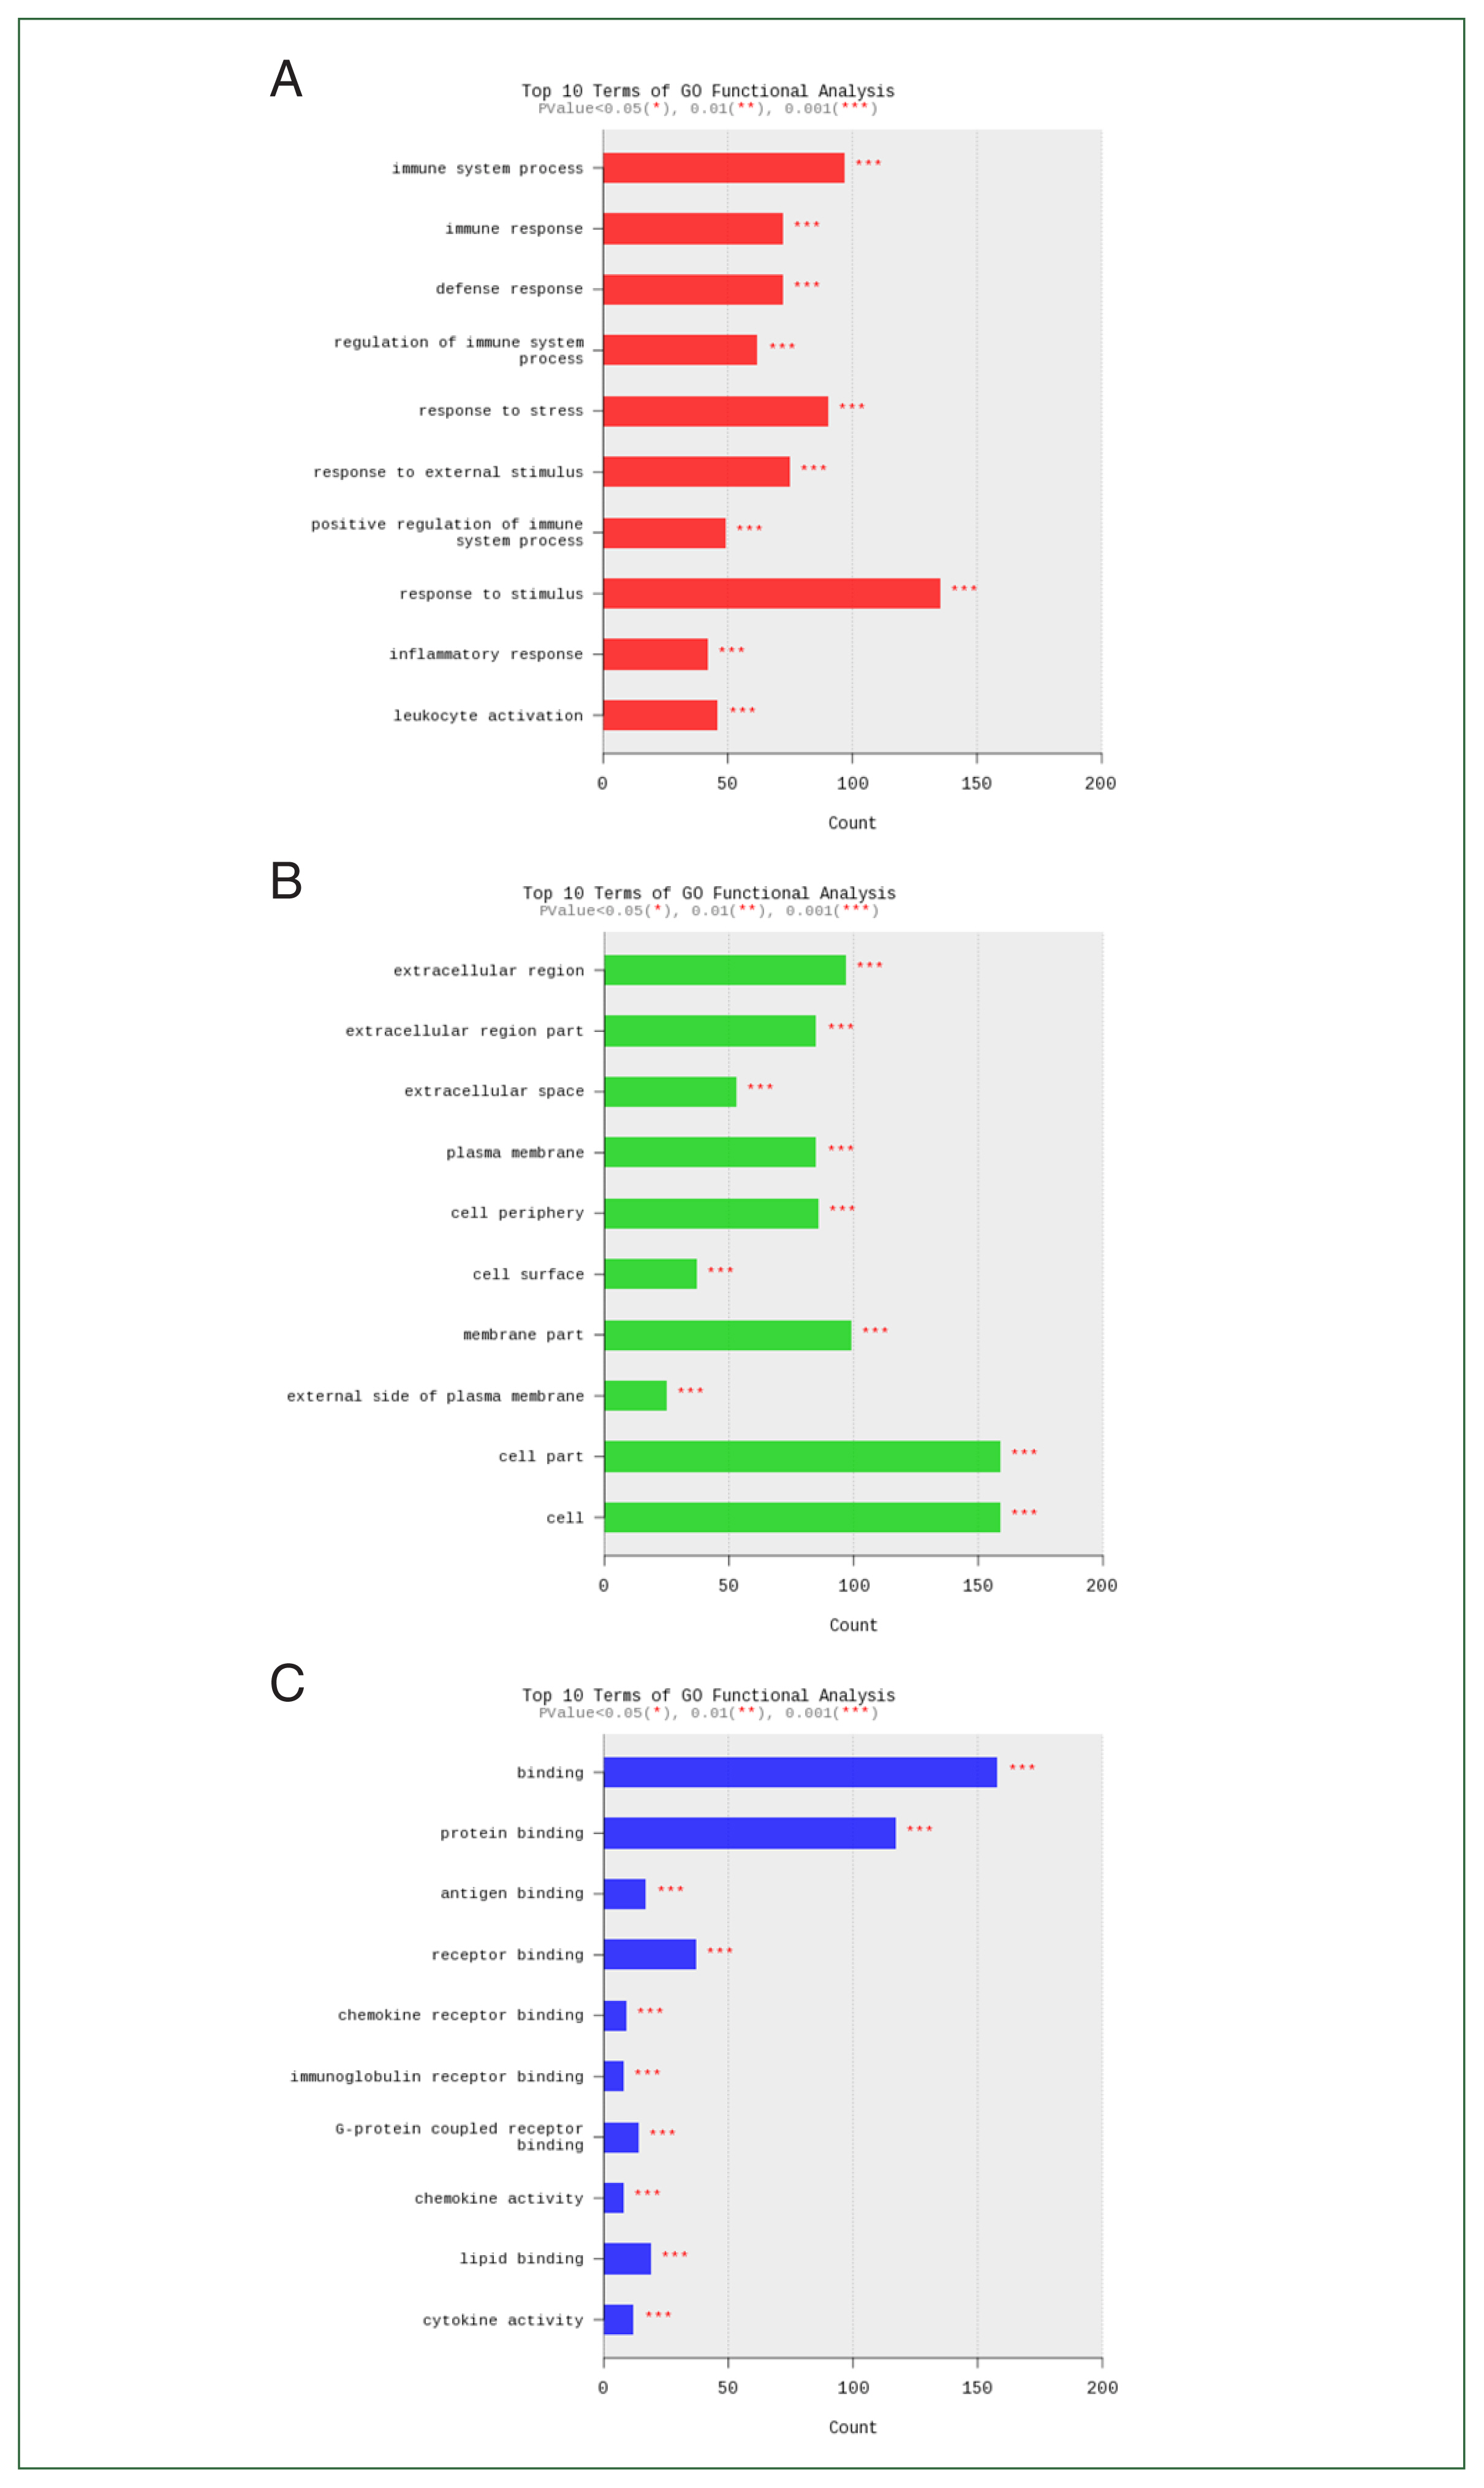
Fig. 5Bar plot of significant probes. We identified 2,949 and 1,095 differentially expressed genes with a fold change (FC) of |logFC| ≥1.5 and |logFC| ≥2, respectively, between the ovalbumin (OVA)-alum model and control (con) group.
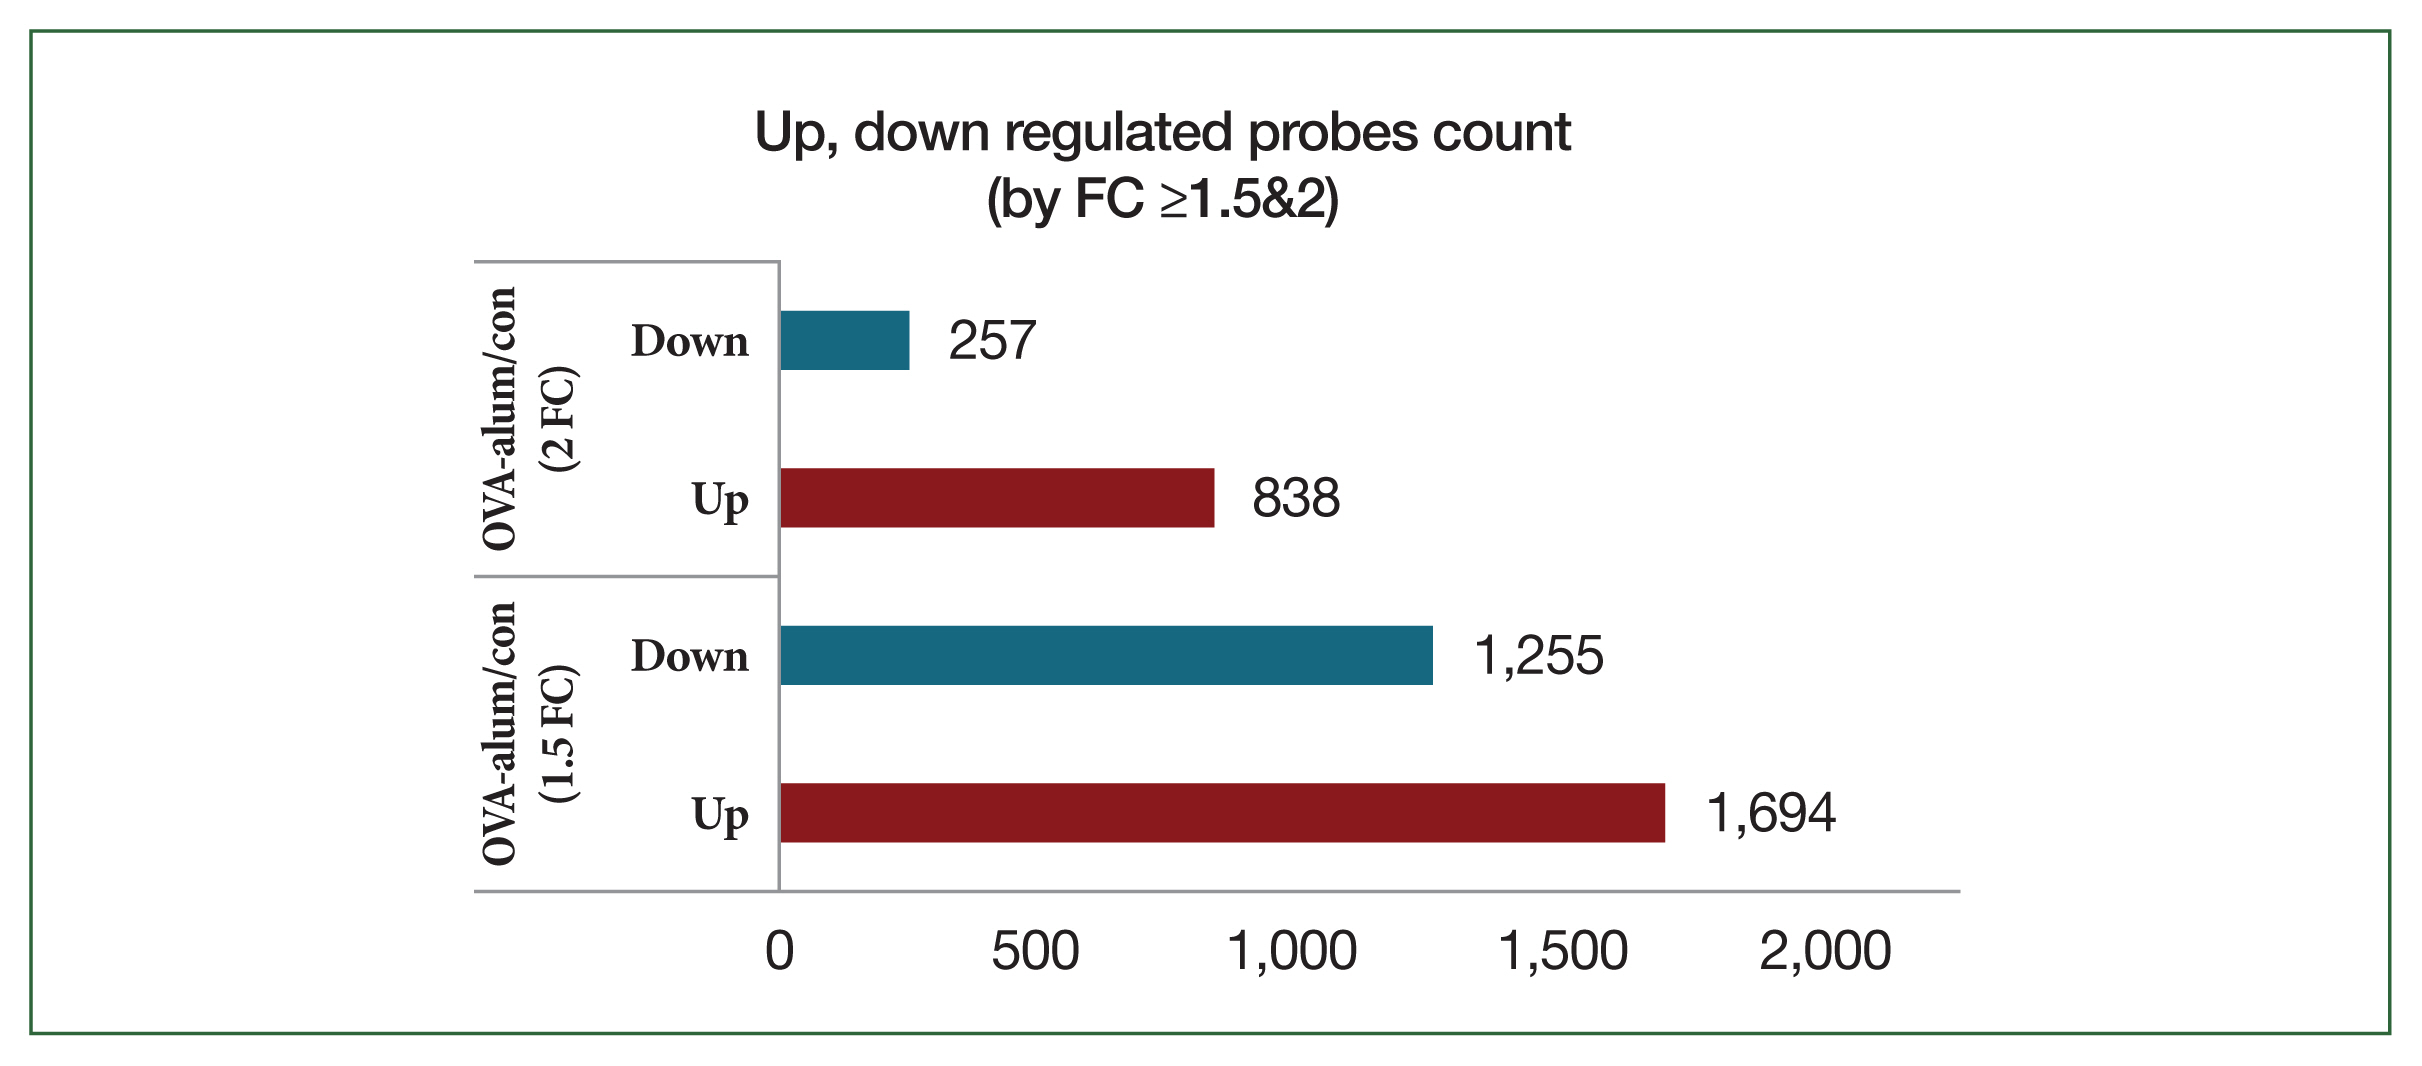
Fig. 6Hierarchical clustering analysis and heat map diagram. The 2949 mRNAs with the most significant differences are presented (fold change >1.5, P<0.05). Green and red shading indicates downregulated and upregulated genes, respectively. Con, control; OVA, ovalbumin.
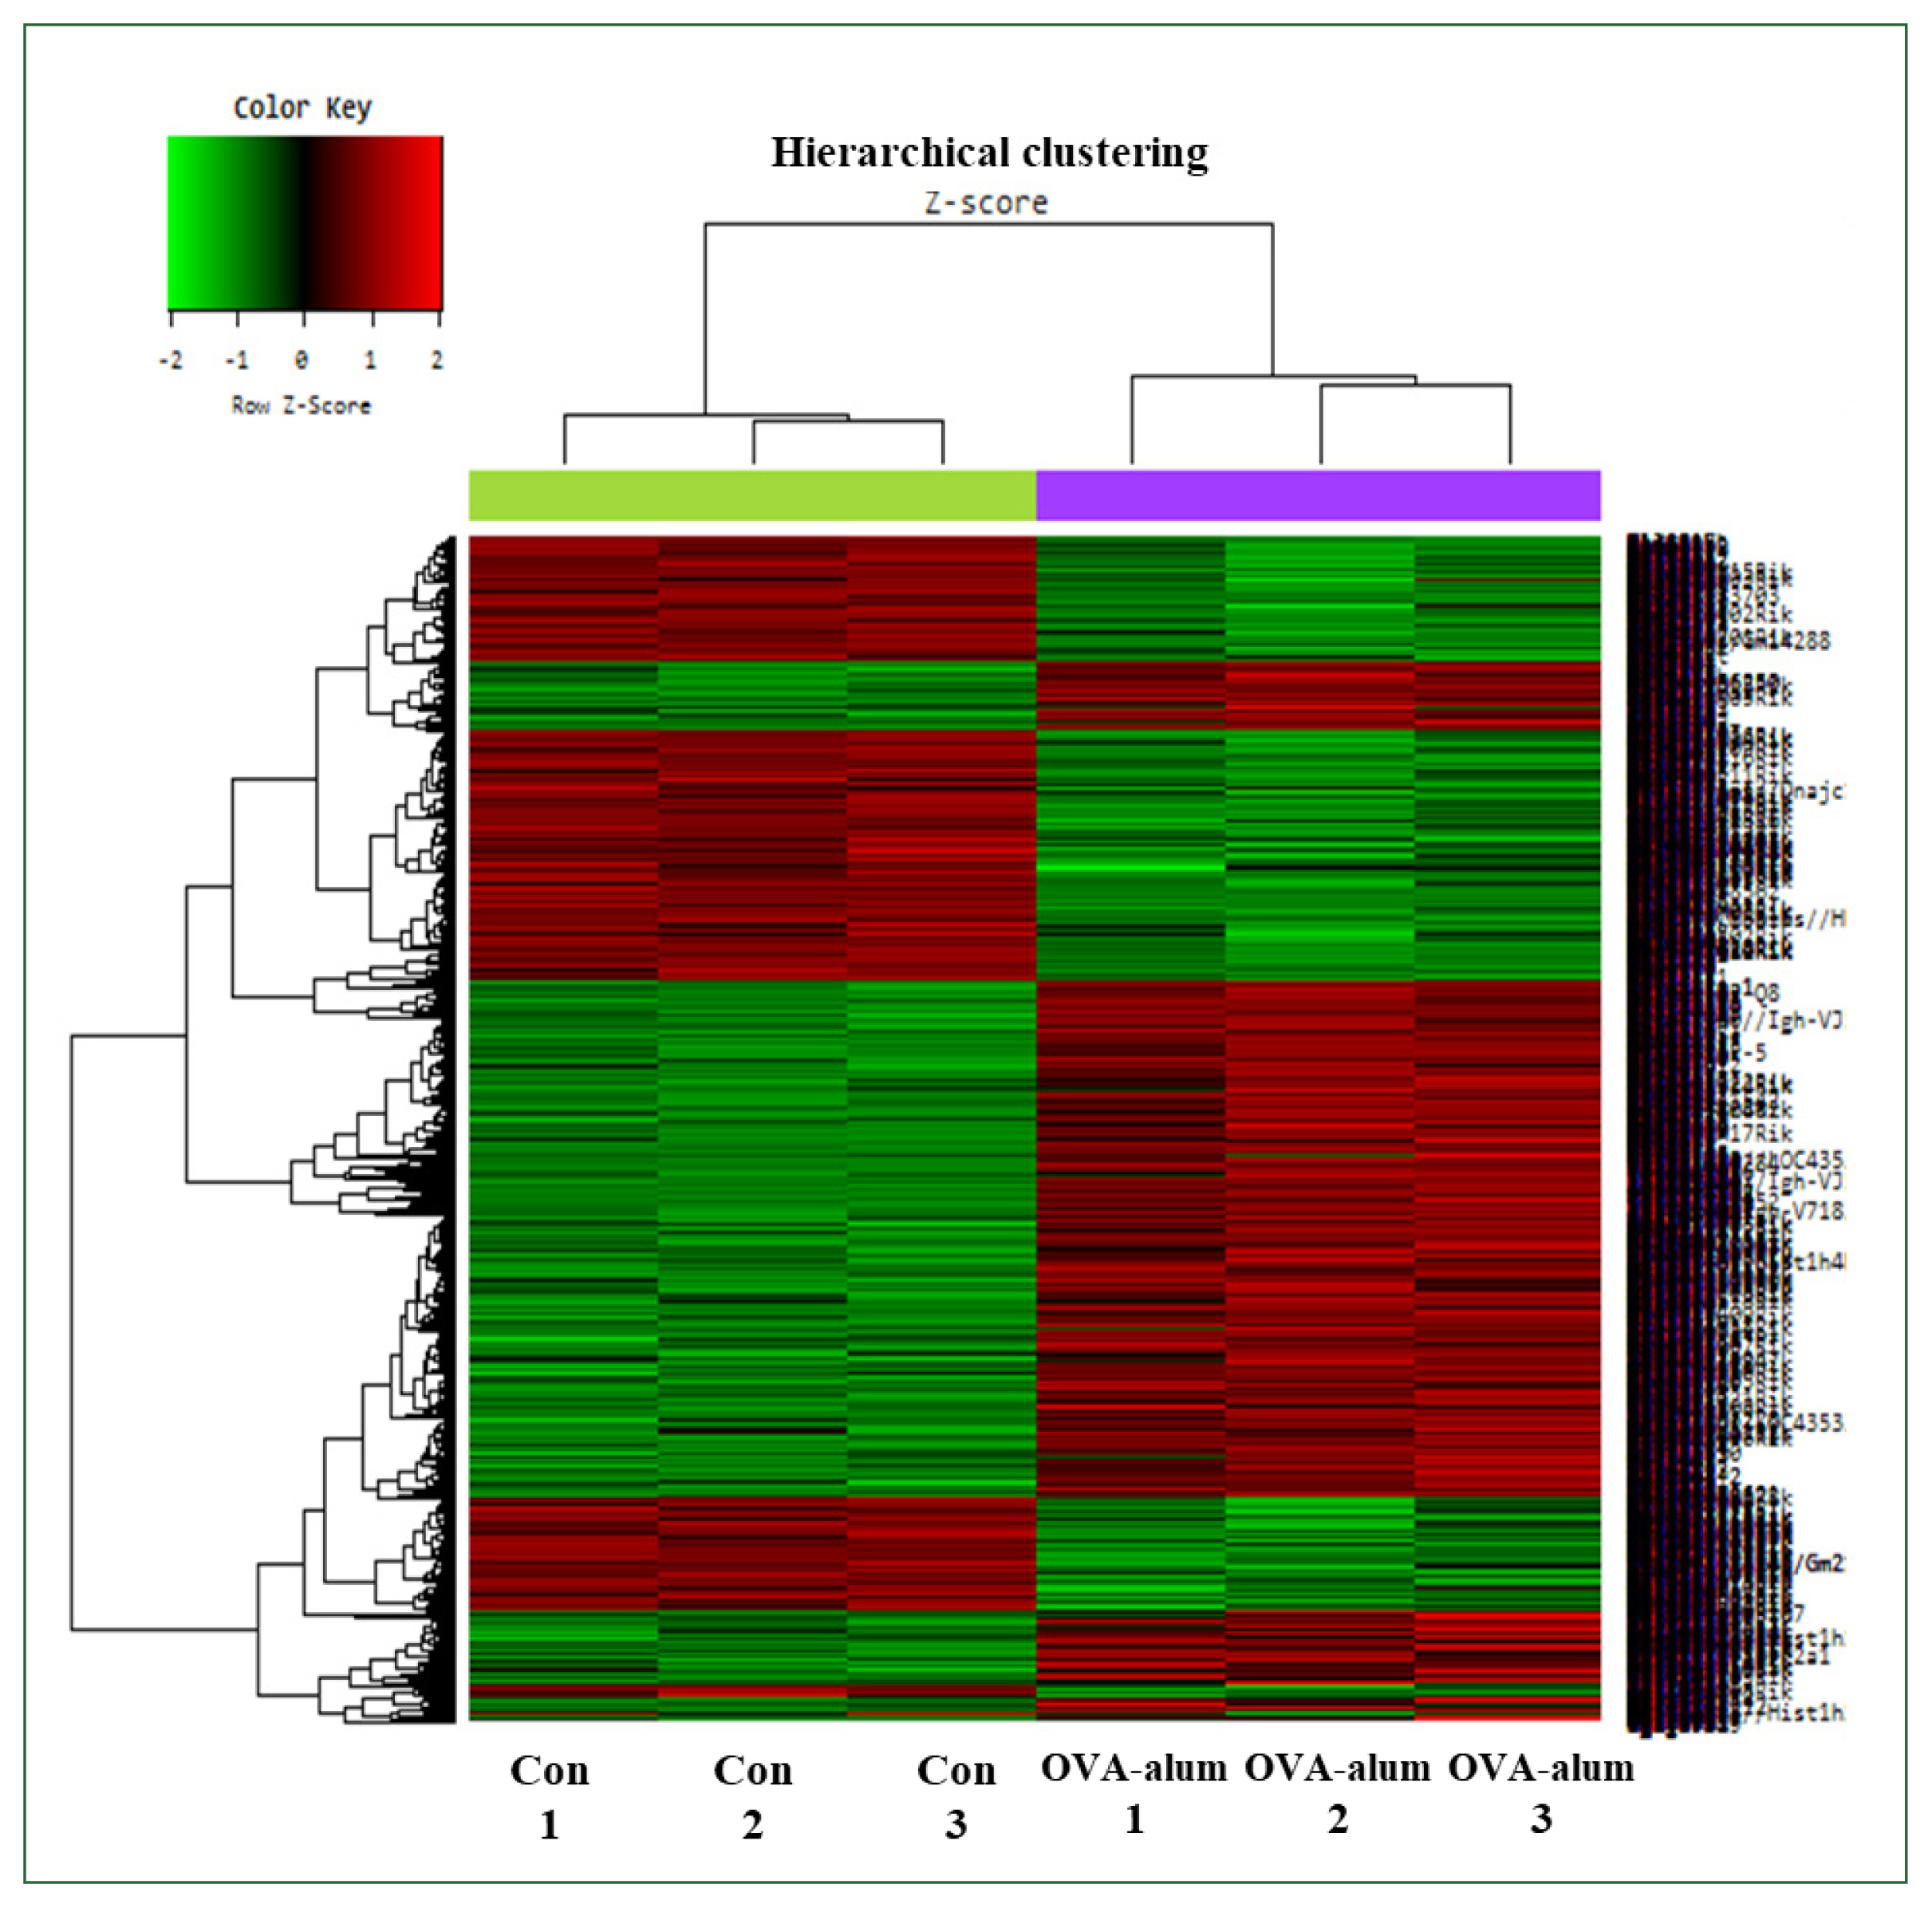
Fig. 7Functional category enrichment analysis of differentially expressed genes. The Y-axis shows significantly enriched gene ontology (GO) terms, while the X-axis shows the counts of these terms. GO analysis includes 3 categories: (A) biological processes, (B) cellular components, and (C) molecular function.
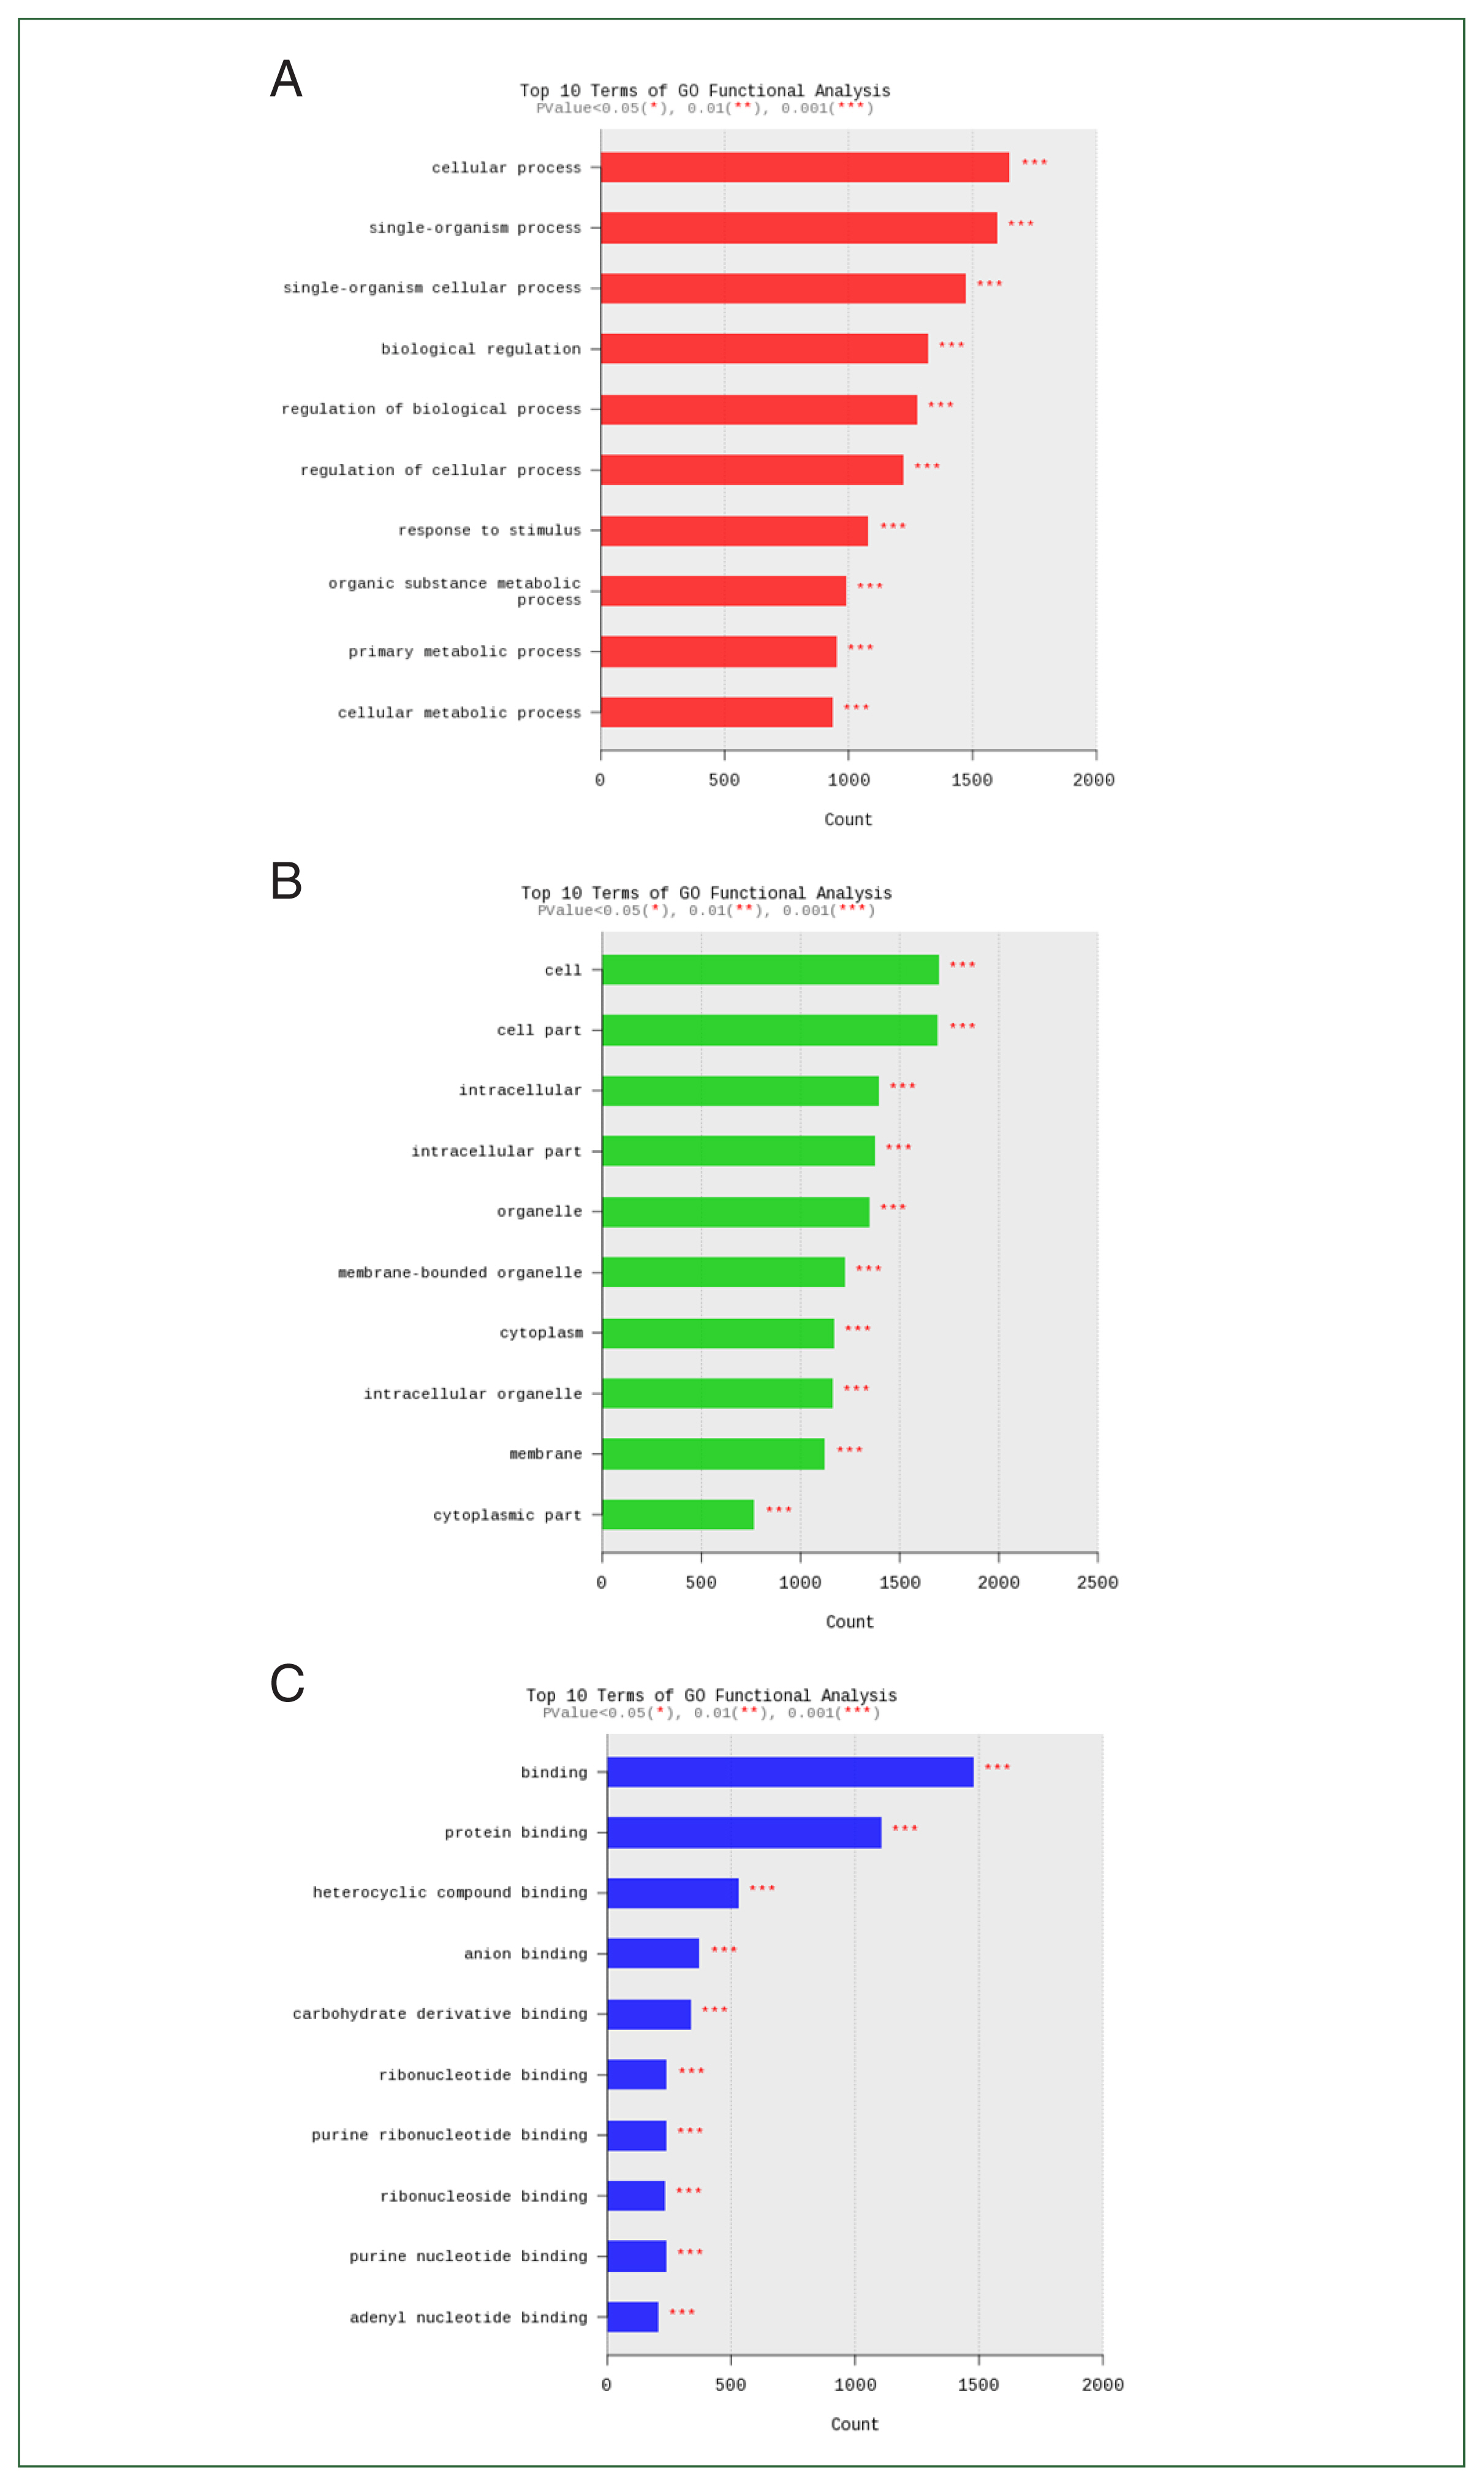
Fig. 8Bar plot of significant probes. We identified 5 differentially expressed genes with a fold change (FC) of |logFC| ≥1.5 between the ovalbumin (OVA)-alum model and Acanthamoeba group.
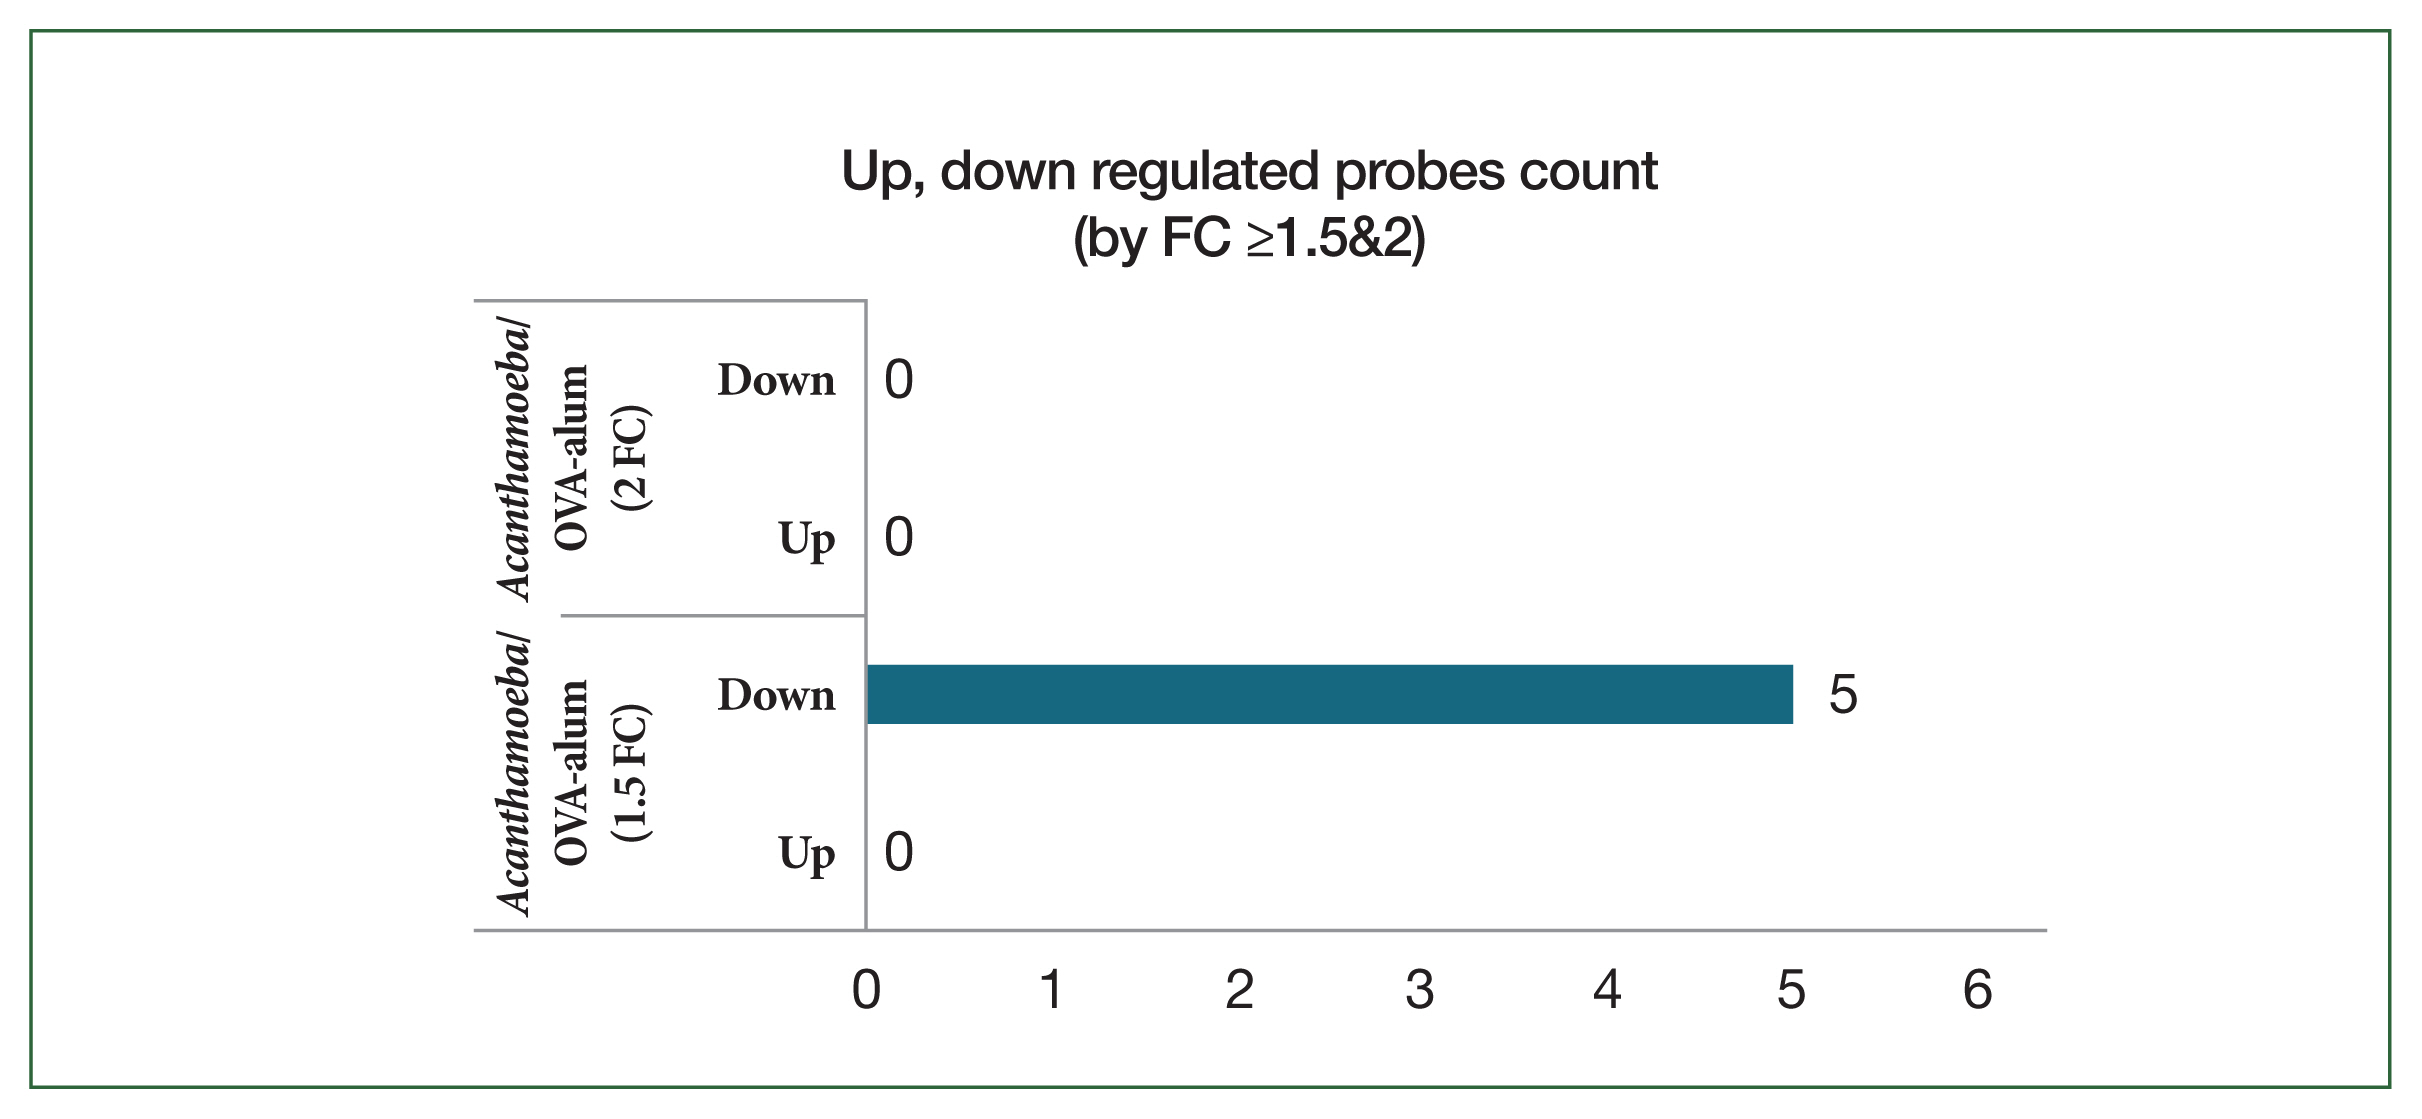
Fig. 9Hierarchical clustering analysis and heat map. The 5 mRNAs with the most significant differences are presented (fold change >1.5, P<0.05). Blue and yellow shading indicates downregulated and upregulated genes, respectively. OVA, ovalbumin.
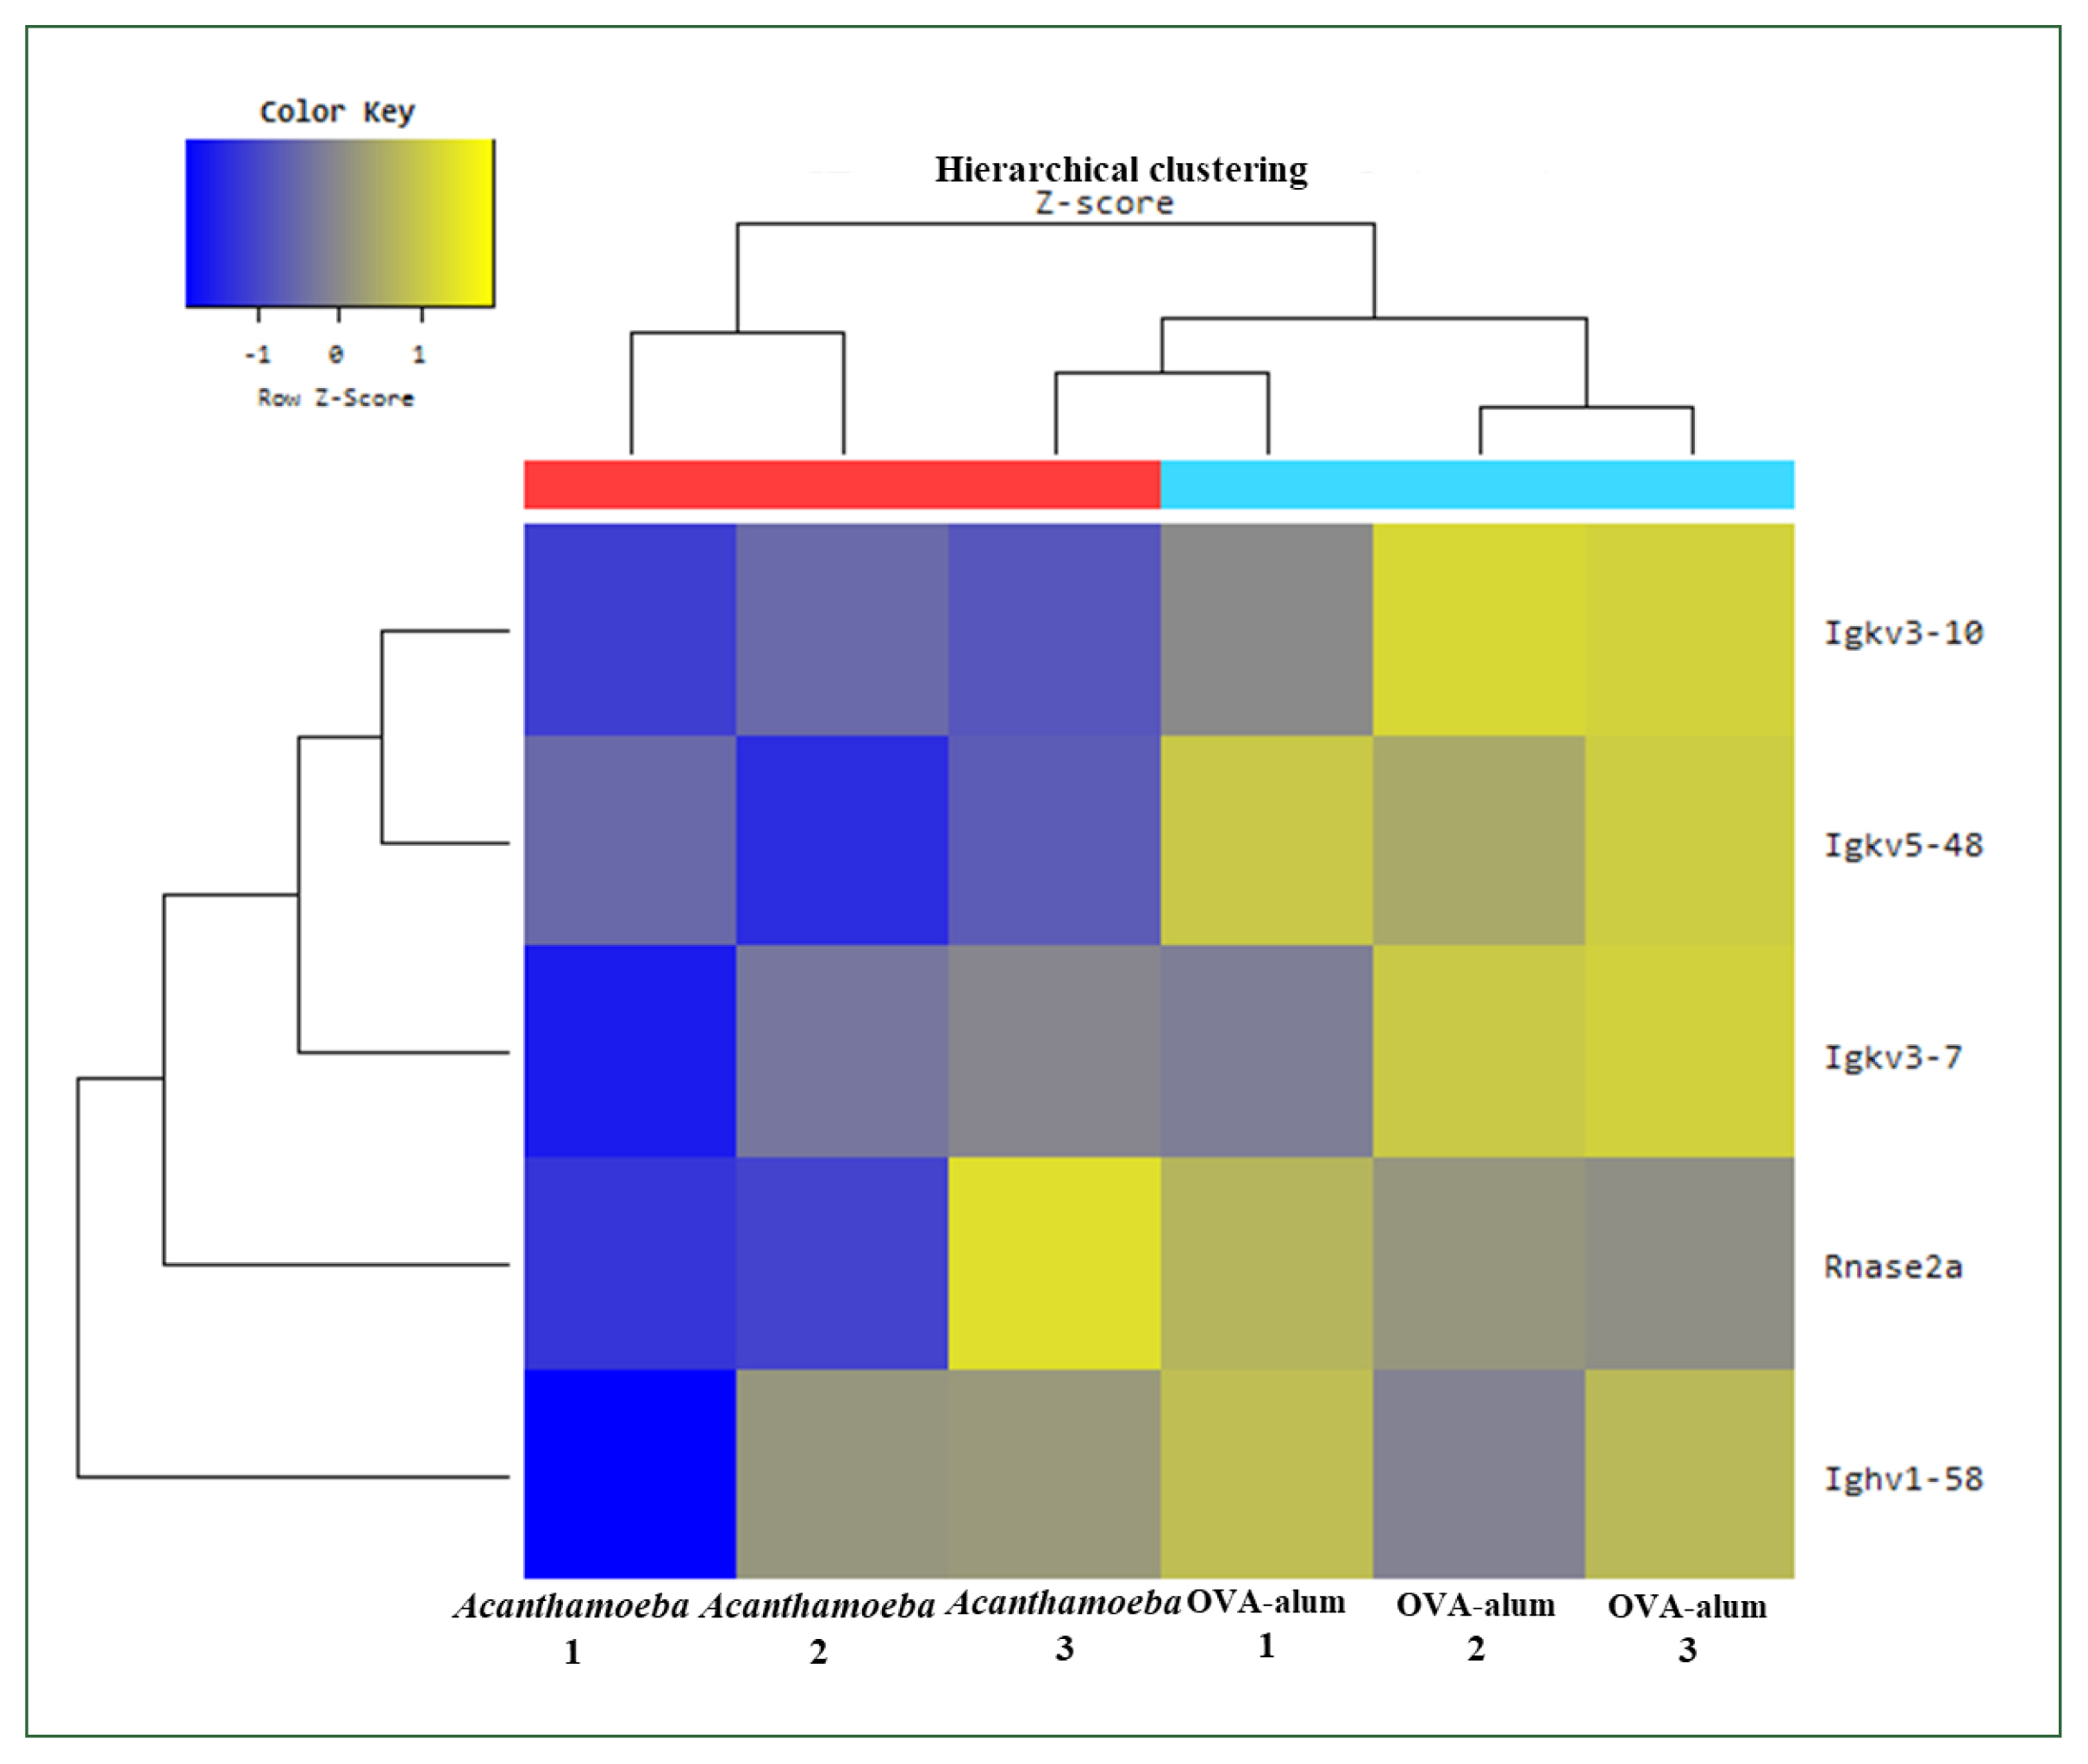
Fig. 10Enrichment analysis based on Kyoto Encyclopedia of Genes and Genomes pathway identified genes showing significantly differential expression. Differentially expressed genes were strongly associated with environmental information processing, organismal systems, and human diseases. OVA, ovalbumin; con, control.
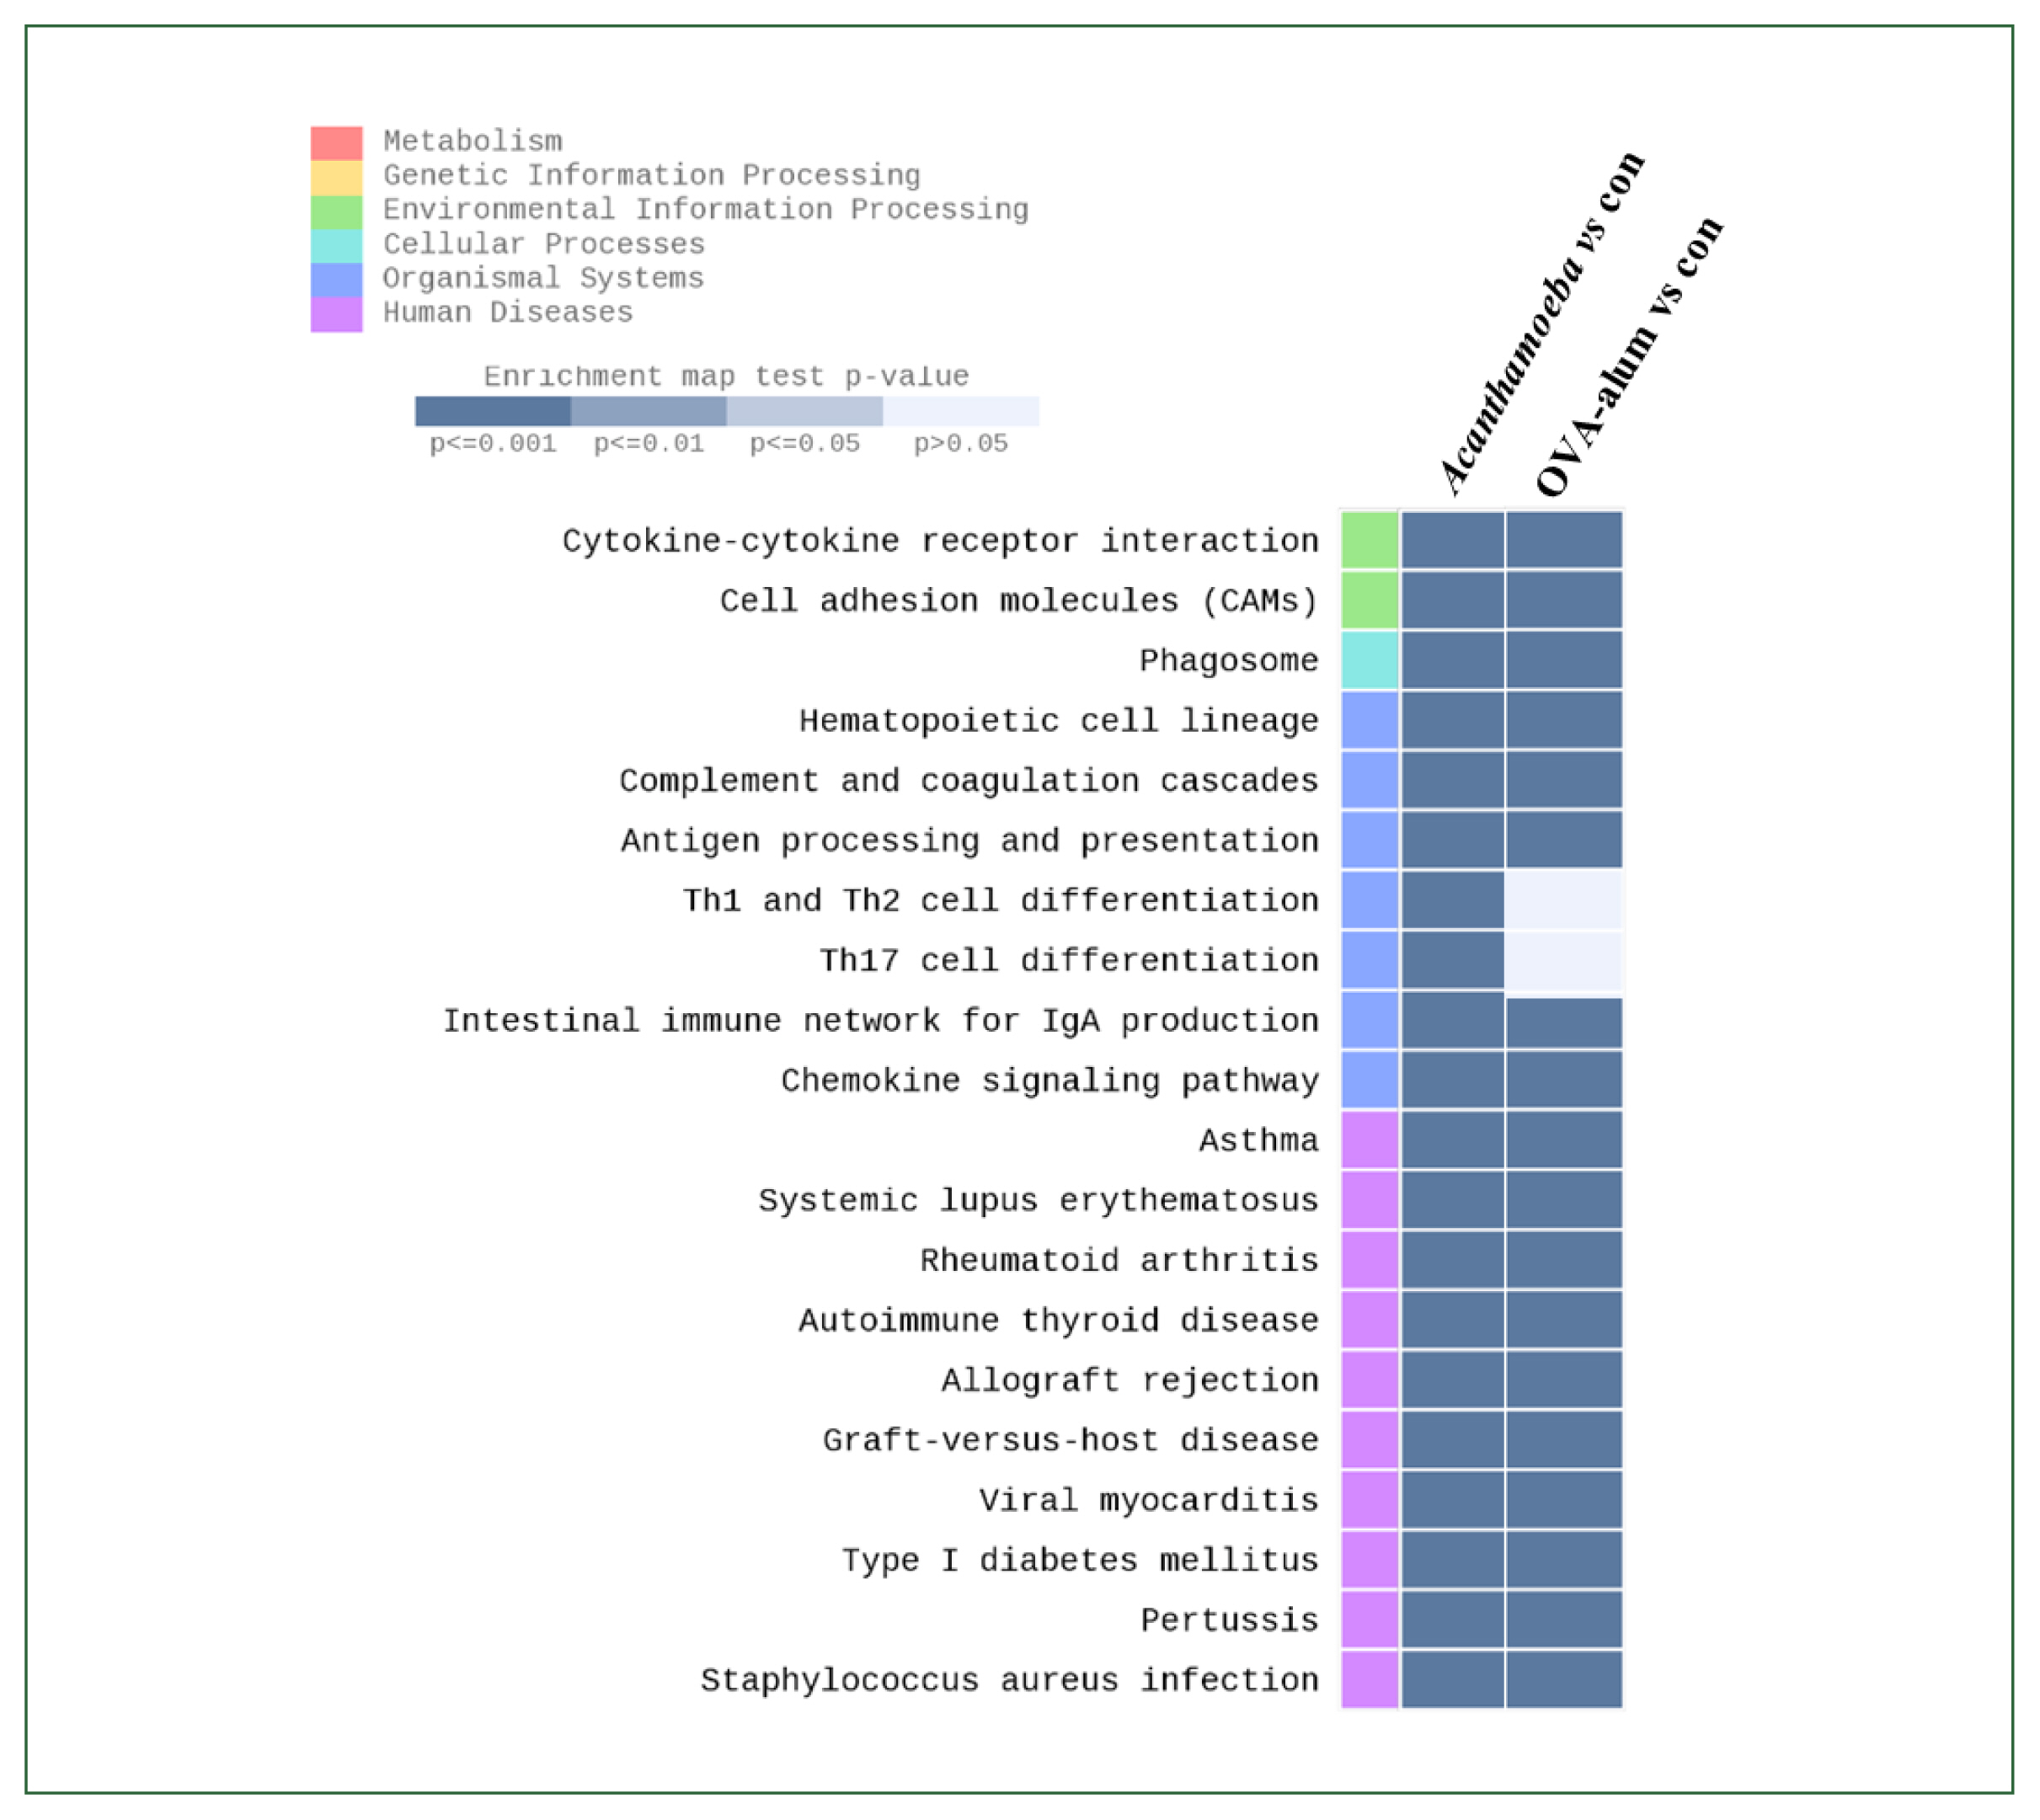
Table 1Comparison of gene expression of 5 genes decreased in the Acanthamoeba-induced model compared to the OVA-alum model
Table 1
|
Gene |
Acanthamoeba/control |
OVA-alum/control |
Acanthamoeba/OVA-alum |
|
Igkv3–10 |
2.295239 |
91.572616 |
−1.607176 |
|
Igkv5–48 |
3.222030 |
69.171140 |
−1.616714 |
|
Igkv3–7 |
1.712344 |
156.341683 |
−1.792142 |
|
Rnase2a |
3.446516 |
251.813357 |
−1.594655 |
|
Ighv1–58 |
2.635699 |
- |
−1.586485 |
References
- 1. Kim MJ, Jo HJ, Quan FS, Chu KB, Kong HH, et al. Identification of essential genes for Acanthamoeba castellanii excystation during encystation and excystation. Parasites Hosts Dis 2024;62(4):399-407. https://doi.org/10.3347/phd.24062
- 2. Kim MJ, Moon EK, Jo HJ, Quan FS, Kong HH. Phagocytosis-associated genes in Acanthamoeba castellanii feeding on Escherichia coli. Parasites Hosts Dis 2023;61(4):397-404. https://doi.org/10.3347/phd.23088
- 3. Siddiqui R, Khan NA. Biology and pathogenesis of Acanthamoeba. Parasit Vectors 2012;5:6. https://doi.org/10.1186/1756-3305-5-6
- 4. Diehl MLN, Paes J, Rott MB. Genotype distribution of Acanthamoeba in keratitis: a systematic review. Parasitol Res 2021;120(9):3051-3063. https://doi.org/10.1007/s00436-021-07261-1
- 5. Loufouma Mbouaka A, Lesiak-Markowicz I, Heredero-Bermejo I, Mazumdar R, Walochnik J, et al. Assessing Acanthamoeba cytotoxicity: comparison of common cell viability assays. Front Microbiol 2023;14:1175469. https://doi.org/10.3389/fmicb.2023.1175469
- 6. Song SM, Kang SA, Park HK, Kim DH, Park SY, et al. Acanthamoeba profilin elicits allergic airway inflammation in mice. PLoS Negl Trop Dis 2018;12(12):e0006979. https://doi.org/10.1371/journal.pntd.0006979
- 7. Łanocha-Arendarczyk N, Baranowska-Bosiacka I, Kot K, Gutowska I, Kolasa-Wołosiuk A, et al. Expression and activity of COX-1 and COX-2 in Acanthamoeba sp.-infected lungs according to the host immunological status. Int J Mol Sci 2018;19(1):121. https://doi.org/10.3390/ijms19010121
- 8. Łanocha-Arendarczyk N, Kolasa-Wołosiuk A, Wojciechowska-Koszko I, Kot K, Roszkowska P, et al. Changes in the immune system in experimental acanthamoebiasis in immunocompetent and immunosuppressed hosts. Parasit Vectors 2018;11(1):517. https://doi.org/10.1186/s13071-018-3108-x
- 9. Moon EK, Xuan YH, Chung DI, Hong Y, Kong HH. Microarray analysis of differentially expressed genes between cysts and trophozoites of Acanthamoeba castellanii. Korean J Parasitol 2011;49(4):341-347. https://doi.org/10.3347/kjp.2011.49.4.341
- 10. Jackson KJ, Kidd MJ, Wang Y, Collins AM. The shape of the lymphocyte receptor repertoire: lessons from the B cell receptor. Front Immunol 2013;4:263. https://doi.org/10.3389/fimmu.2013.00263
- 11. Rosenberg HF. Eosinophil-derived neurotoxin (EDN/RNase 2) and the mouse eosinophil-associated RNases (mEars): expanding roles in promoting host defense. Int J Mol Sci 2015;16(7):15442-15455. https://doi.org/10.3390/ijms160715442
- 12. Park MK, Park HK, Yu HS. Toll-like receptor 2 mediates Acanthamoeba-induced allergic airway inflammatory response in mice. PLoS Negl Trop Dis 2023;17(1):e0011085. https://doi.org/10.1371/journal.pntd.0011085
- 13. Kim SD, Kang SA, Mun SJ, Yu HS, Roh HJ, et al. SCGB1C1 plays a critical role in suppression of allergic airway inflammation through the induction of regulatory T cell expansion. Int J Mol Sci 2024;25(11):6282. https://doi.org/10.3390/ijms25116282
- 14. Sasaki E, Asanuma H, Momose H, Furuhata K, Mizukami T, et al. Nasal alum-adjuvanted vaccine promotes IL-33 release from alveolar epithelial cells that elicits IgA production via type 2 immune responses. PLoS Pathog 2021;17(8):e1009890. https://doi.org/10.1371/journal.ppat.1009890
- 15. Chen X, Wang F, Lin J, Luo S, Li Z, et al. The consistently up-regulated expression of NLRP3 in severe asthma patients from mRNA microarray and ovalbumin-induced mouse model of asthma. J Thorac Dis 2024;16(8):4957-4966. https://doi.org/10.21037/jtd-24-567
- 16. Sarker B, Khare N, Devignes MD, Aridhi S. Improving automatic GO annotation with semantic similarity. BMC Bioinformatics 2022;23(Suppl 2):433. https://doi.org/10.1186/s12859-022-04958-7
- 17. Rodriguez OL, Safonova Y, Silver CA, Shields K, Gibson WS, et al. Genetic variation in the immunoglobulin heavy chain locus shapes the human antibody repertoire. Nat Commun 2023;14(1):4419. https://doi.org/10.1038/s41467-023-40070-x
- 18. Mikocziova I, Greiff V, Sollid LM. Immunoglobulin germline gene variation and its impact on human disease. Genes Immun 2021;22(4):205-217. https://doi.org/10.1038/s41435-021-00145-5
- 19. Faria D, Schlicker A, Pesquita C, Bastos H, Ferreira AE, et al. Mining GO annotations for improving annotation consistency. PLoS One 2012;7(7):e40519. https://doi.org/10.1371/journal.pone.0040519
- 20. Buzzao D, Castresana-Aguirre M, Guala D, Sonnhammer ELL. Benchmarking enrichment analysis methods with the disease pathway network. Brief Bioinform; 2024 25(2):bbae069 https://doi.org/10.1093/bib/bbae069
- 21. Ilyas M, Stapleton F, Willcox MDP, Henriquez F, Peguda HK, et al. Epidemiology of and genetic factors associated with Acanthamoeba keratitis. Pathogens 2024;13(2):142. https://doi.org/10.3390/pathogens13020142
- 22. Subhashini, Chauhan PS, Singh R. Ovalbumin-induced allergic inflammation lead to structural alterations in mouse model and protective effects of intranasal curcumin: a comparative study. Allergol Immunopathol (Madr) 2016;44(3):246-256. https://doi.org/10.1016/j.aller.2016.01.001