Abstract
Piroplasm parasites of the genera Babesia and Theileria are widely distributed in wildlife and are maintained through complex host–vector transmission systems. Rodents play important roles as reservoir hosts for various arthropod-borne pathogens; however, comparative investigations integrating multiple host compartments and host-associated ectoparasites remain limited. In this study, we conducted a nationwide molecular survey of Babesia and Theileria species in wild rodents and mites collected from rodents in Korea. Rodent blood and liver tissues, together with mite pools, were examined using PCR-based detection methods, and spatial and seasonal variation in pathogen detection patterns was evaluated. Babesia microti was detected in both rodent blood and liver tissues, with higher positivity in blood and marked spatial and seasonal heterogeneity. The higher positivity observed in blood was consistent with the intraerythrocytic biology of B. microti, although differences in analytical sensitivity between sample types were not evaluated. Theileria capreoli DNA was detected exclusively at low frequency in mite pools, whereas Theileria luwenshuni DNA was detected at low frequency in both rodents and mite pools. Because mites are not established biological vectors of these Theileria species, detections in mite pools were interpreted as molecular occurrence rather than evidence of transmission or vector competence. Significant regional and seasonal variation was observed in blood and mite samples; however, overall detection frequencies were low, warranting cautious ecological interpretation. This nationwide, multi-compartment assessment highlights the ecological complexity of piroplasm circulation in wildlife systems and underscores the importance of integrated surveillance approaches when interpreting parasite DNA detection in arthropod assemblages.
-
Key words: Babesia microti, Theileria capreoli, Theileria luwenshuni, rodents, mites
Introduction
Piroplasm parasites, including the genera
Babesia and
Theileria, are tick-transmitted hemoprotozoa infecting blood cells of vertebrate hosts. These parasites infect a wide range of vertebrate hosts and are widely distributed in wildlife populations worldwide [
1]. A limited number of
Babesia species have been reported to infect humans and cause babesiosis, whereas
Theileria species are predominantly associated with infections in domestic and wild ungulates [
2]. Among piroplasms,
Babesia microti is one of the most important zoonotic species and is widely recognized as a major cause of human babesiosis globally [
3,
4].
Rodents are widely recognized as important reservoir hosts in the ecology of many vector-borne pathogens due to their broad geographic distribution and frequent exposure to arthropod vectors [
5]. In particular, rodents commonly host immature tick stages such as larvae and nymphs, and seasonal dynamics of tick life stages can influence the maintenance of enzootic transmission cycles of tick-borne pathogens [
6]. Because many piroplasm parasites, including members of the
B. microti group and several
Theileria species, can be maintained through stage-to-stage transmission within tick vectors, infections acquired during immature stages may persist through subsequent developmental stages [
7]. Therefore, investigating piroplasm parasites in rodent populations may provide insights into their ecological dynamics within wildlife-associated transmission systems.
Although ticks are the established biological vectors of
Babesia and
Theileria, the ectoparasite specimens made available for the present study through the nationwide rodent surveillance program of the Korea Disease Control and Prevention Agency (KDCA) consisted of mites rather than ticks. Accordingly, the present study was designed to examine the occurrence of piroplasm DNA in mite samples collected from wild rodents. Mites are common ectoparasites of wild rodents and have also been included in molecular surveillance studies of vector-borne pathogens in rodent populations [
8]. Molecular investigations incorporating vertebrate hosts and their ectoparasites may provide complementary information on pathogen occurrence across host and ectoparasite compartments [
9]. Importantly, mites are not established biological vectors of
Babesia or
Theileria; therefore, detection of piroplasm DNA in mite pools was interpreted as molecular evidence of parasite DNA occurrence and not as evidence of transmission or vector competence.
Despite their ecological importance, most previous investigations of piroplasm infections in wild rodents have primarily focused on single host compartments, typically blood or tissue samples. Studies simultaneously examining multiple rodent sample types and ectoparasites remain limited [
10]. Furthermore, although rodent-associated
Babesia infections have been documented in several geographic regions, comparatively fewer studies have reported
Theileria species in rodent hosts.
In Korea, previous surveillance studies have reported the presence of
B. microti in wild rodents [
11] and various piroplasm species in wildlife and ticks [
12,
13]. Similar findings have also been reported in rodent populations from other geographic regions [
14]. However, systematic nationwide investigations that integrate rodent tissues and ectoparasites collected from rodents within a unified ecological framework remain scarce in Korea. Such integrated approaches are important for understanding how piroplasm parasites circulate among wildlife hosts and their associated arthropod assemblages. Therefore, the present study conducted a nationwide molecular survey of
Babesia and
Theileria species in wild rodents and mites collected from rodents in Korea. Detection patterns were compared across multiple host compartments, including blood and liver tissues, as well as ectoparasite pools, while spatial and seasonal variation in pathogen occurrence was evaluated.
Methods
Ethics statement
All animal-related procedures were conducted in accordance with the ethical guidelines for animal experimentation and were approved by the Institutional Animal Care and Use Committee of the KDCA (approval No. KDCA-093-18). Rodent samples used in this study were collected through nationwide surveillance activities conducted by KDCA. In addition, the study protocol was reviewed and approved by the Institutional Animal Care and Use Committee of Kyungpook National University (approval No. KNU 2022-0441).
Rodent collection
Rodent sampling was conducted at 16 locations across Korea in collaboration with KDCA-affiliated regional monitoring centers. Field collections were performed during the spring and autumn seasons of 2022 and 2023 and during the autumn season of 2024; sampling was not conducted in the spring of 2024 due to fieldwork-related limitations. At each sampling site, multiple representative habitat types were included in the trapping design, including forested areas, waterways, reservoirs, agricultural fields, and paddy fields. A total of 100 Sherman live traps (3×3×9 inches, BioQuip) were deployed at each location, with 20 traps placed within each habitat type at intervals of approximately 3–5 m. Traps baited with peanut butter–coated cookies were set before sunset and collected the following morning. Captured rodents were transported to the laboratory for further processing.
A total of 1,210 rodents were collected from 16 locations across Korea and identified as 10 species (
Table 1). Species identification was performed using standard taxonomic keys [
15] and updated taxonomic references [
16]. Animals were humanely euthanized by CO₂ inhalation, after which blood samples were collected via cardiac puncture for subsequent molecular analyses. Liver tissues were aseptically collected during necropsy and stored at -80°C until DNA extraction.
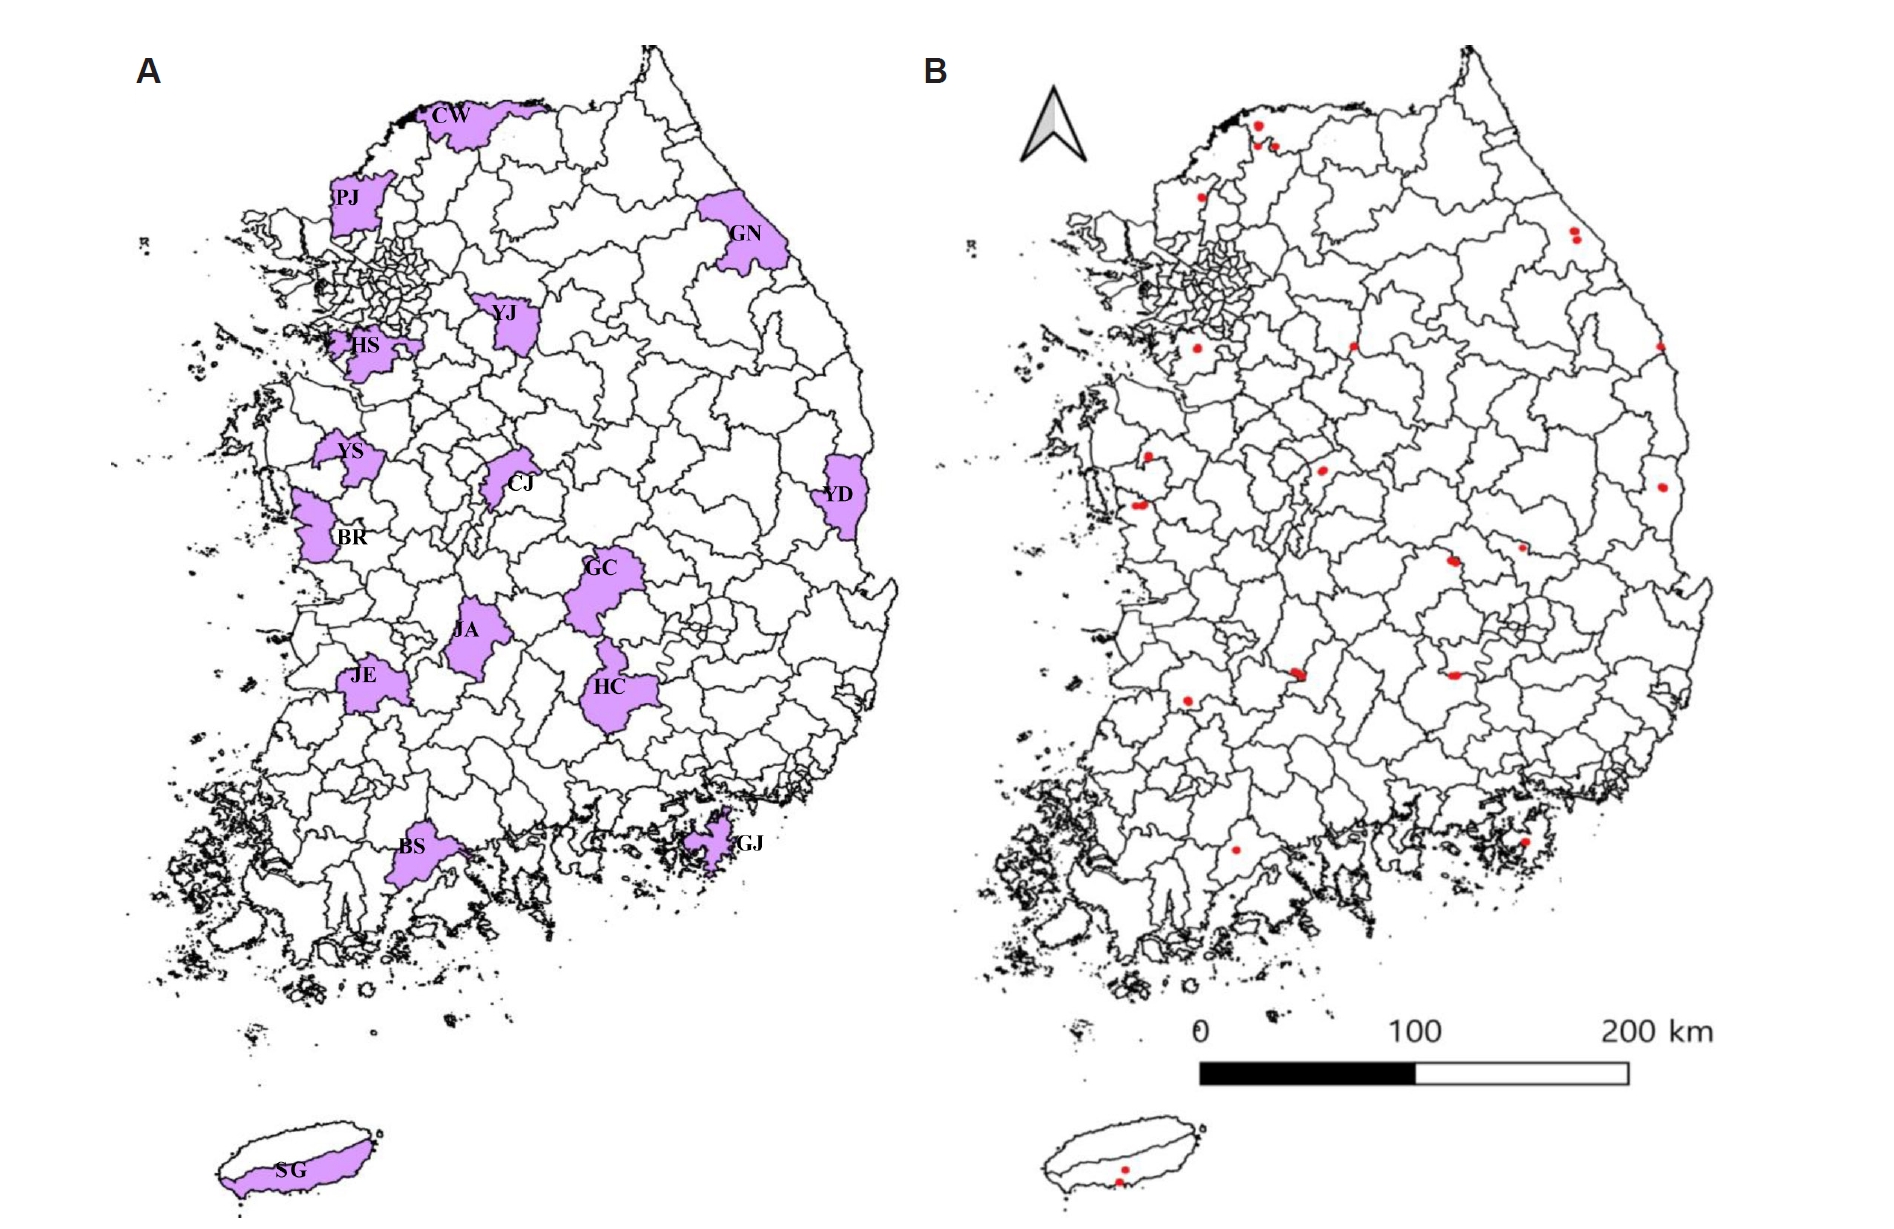
Sampling locations were grouped into 4 geographic regions: Northern (Hwaseong, Paju, Yeoju, Cheorwon, and Gangneung), Central (Cheongju, Boryeong, and Yesan), Southern (Jeongeup, Boseong, Jinan, Geoje, Hapcheon, Gimcheon, and Yeongdeok), and Jeju Island (Seogwipo) (
Fig. 1A,
B). Geographic coordinates of sampling sites were used to generate spatial distribution maps illustrating the regional classification of sampling sites and the distribution of pathogen-positive samples.
External ectoparasites, including mites, were obtained from the bodies of captured rodents during the rodent sampling periods. Mite collection was conducted concurrently with rodent trapping during the spring and autumn seasons of 2022 and 2023. Mite sampling was not performed during 2024 due to fieldwork-related limitations. To recover ectoparasites, each euthanized rodent was suspended by the tail over a rod positioned above a beaker containing water within a Petri dish. This setup allowed ectoparasites to detach naturally from the host and fall into the Petri dish over a 24-h period. Mites present on the water surface were collected using a fine brush and preserved in 70% ethanol until further processing.
The ectoparasite specimens provided by the KDCA for the present study consisted of mites; ticks were not included in the sample set available for molecular analysis. Mites were collected from individual rodents, and mites obtained from each rodent were maintained as a separate sample. At the KDCA, approximately half of the mites collected from each rodent were provided for molecular analyses in the present study, while the remaining specimens were retained as biological resources for long-term preservation. Accordingly, the 12,114 mites analyzed in this study represent the specimens provided by the KDCA rather than the total number of mites originally collected. A total of 649 individual rodents yielded mites for the present analysis, with one mite pool prepared from each rodent. The 12,114 mites were therefore processed as 649 pools containing 1–30 mites per pool (mean±SD, 18.7±11.4 mites per pool). Morphological identification of mite species was not performed; therefore, analyses were conducted at the pooled mite level.
Molecular detection of piroplasms in rodents and mites
Rodent tissue samples and mite pools were mechanically homogenized prior to DNA extraction. Both rodent tissues and mite pools were homogenized using Precellys CK28-R lysing tubes and a Precellys Evolution Homogenizer (Bertin Technologies) according to the manufacturer’s instructions. All samples were processed individually using sterile consumables, and equipment was decontaminated between samples to prevent cross-contamination. Genomic DNA was extracted from the homogenized samples using the Clear-S Quick DNA Extraction Kit (Invirustech) following the manufacturer’s protocol.
A 425-bp fragment of the piroplasm 18S rRNA gene was amplified using the primer pair BJ1 (5′-GTC TTG TAA TTG GAA TGA TGG-3′) and BN2 (5′-TAG TTT ATG GTT AGG ACT ACG-3′), previously described for the detection of piroplasm parasites [
17]. This primer pair broadly amplifies members of the genera
Babesia and
Theileria. PCR amplification was performed using the AccuPower PCR Premix kit (Bioneer). The thermal cycling conditions consisted of an initial denaturation at 94°C for 10 min, followed by 35 cycles of denaturation at 94°C for 1 min, annealing at 55°C for 30 sec, and extension at 72°C for 1 min, with a final extension at 72°C for 5 min. Positive and negative controls were included in each PCR run to ensure the reliability of the assay.
Representative PCR-positive samples were selected for sequencing to include samples from different geographic locations and sampling years, where possible. Bidirectional sequencing was performed by a commercial sequencing service (Macrogen). The obtained nucleotide sequences were compared with reference sequences available in the NCBI GenBank database using BLAST to determine their closest sequence identities. Multiple sequence alignment was performed using Clustal Omega version 1.2.1 (EMBL-EBI). All sequences successfully obtained from the selected representative samples were deposited in GenBank and included in the phylogenetic analyses. Phylogenetic relationships were inferred using MEGA software version 6.0. Evolutionary distances were calculated using the Kimura two-parameter model, and phylogenetic trees were constructed using the maximum likelihood method with 1,000 bootstrap replicates.
Statistical analysis
All statistical analyses were performed using Prism software version 5.04 (GraphPad Software). Associations between categorical variables were assessed using Pearson chi-square test. Fisher exact test was used when expected cell counts were insufficient for the chi-square approximation. Statistical significance was defined as a P-value <0.05.
Geographical analysis
Geographic analyses and map visualization were performed using QGIS software version 3.40 (QGIS Development Team). Geographic coordinates of sampling sites were used to generate spatial distribution maps illustrating the regional classification of sampling sites and the geographic distribution of pathogen-positive rodents and mite samples.
Results
Rodent identification
Rodent sampling across 16 locations in Korea yielded 1,210 individuals, with
Apodemus agrarius as the predominant species (1,018/1,210, 84.1%).
Crocidura spp. represented 10.6% (128/1,210) of captured rodents, followed by
Micromys minutus (27/1,210, 2.2%) and
Craseomys regulus (17/1,210, 1.4%). The remaining species—including
Apodemus peninsulae,
Microtus fortis,
Myodes regulus,
Craseomys rufocanus,
Mogera robusta, and
Rattus norvegicus—each accounted for less than 1% of captured rodents and were recorded only sporadically across sampling years (
Table 1). Liver tissues were obtained from all 1,210 captured rodents for molecular analyses. Blood samples were collected by cardiac puncture; however, rodents from which blood samples could not be obtained were excluded from blood-based analyses, resulting in 947 blood samples.
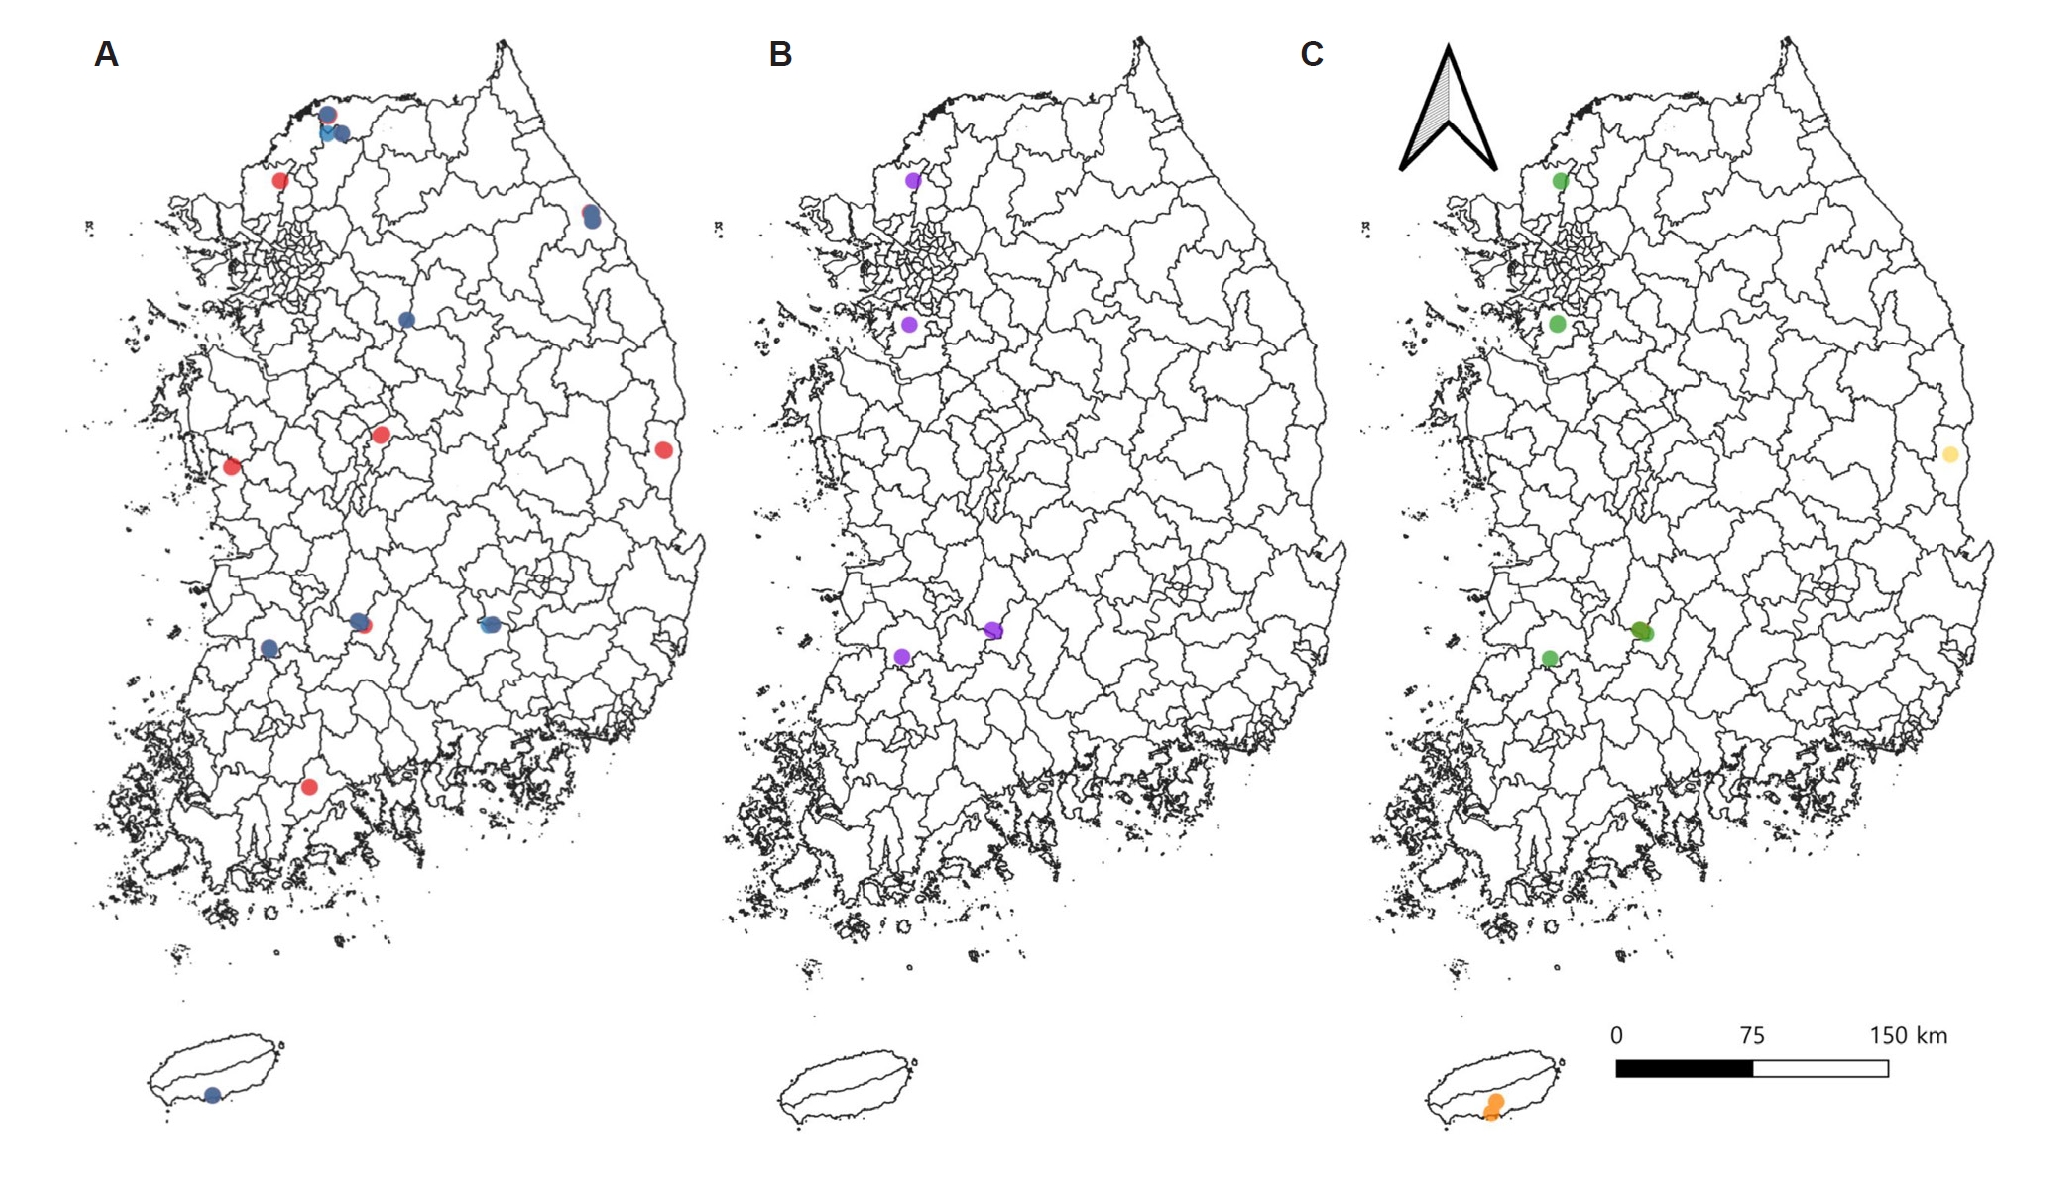
Detection patterns of
Babesia spp. and
Theileria spp. in rodents varied according to geographic region, season, and sample type (liver tissue vs. blood) (
Fig. 2A-
C). For
B. microti, regional comparisons showed significant variation in both liver tissues and blood samples, with stronger spatial variation observed in blood samples (χ²=38.539, df=15,
P=0.0008 for liver tissues; χ²=77.728, df=15,
P<0.0001 for blood samples). Seasonal comparisons showed no significant variation in liver tissues (χ²=2.572, df=1,
P=0.1088), whereas blood samples exhibited a significant seasonal difference (χ²=16.872, df=1,
P<0.0001). Among the 109
B. microti-positive blood samples, 71 (65.1%) were detected in autumn and 38 (34.9%) in spring. The corresponding season-specific detection rates were 16.1% (71/442) and 7.5% (38/505), respectively, with the highest year- and season-specific detection rates observed in autumn 2022 (46/251, 18.3%) and autumn 2023 (12/82, 14.6%). In contrast, detection rates in liver tissues were lower and showed limited seasonal variation (
Table 2).
Detection patterns of
Theileria luwenshuni differed from those observed for
B. microti. No significant regional variation was detected in liver tissues (χ²=15.588, df=15,
P=0.4099), whereas blood samples showed significant regional differences (χ²=31.352, df=15,
P=0.0079). Similarly, seasonal comparisons showed no significant variation in liver tissues (Fisher exact test,
P=1.0000), while blood samples exhibited significant seasonal variation (Fisher exact test,
P=0.0102). Despite statistical significance in certain comparisons, detections occurred sporadically and were limited to specific seasons or years. Detailed detection rates by pathogen, sample type, region, and season are summarized in
Table 3.
A total of 12,114 mites provided by the KDCA were included in the molecular analyses. These mites were obtained from 649 individual rodents and processed as 649 pools, with one pool corresponding to one rodent. The mean pool size was 18.7±11.4 mites (range, 1–30 mites per pool). Mite pools collected from rodents were tested for the presence of
Babesia spp. and
Theileria spp.
Babesia spp. were not detected in any mite pools. In contrast,
Theileria capreoli and
T. luwenshuni were detected in mite pools, with overall detection rates of 0.9% and 1.7%, respectively. For
T. capreoli, regional comparisons of mite pools showed no significant variation (χ²=20.722, df=15,
P=0.1459). However, seasonal comparisons showed a significant difference in detection rates between sampling periods (Fisher exact test,
P=0.0334). Detection patterns of
T. luwenshuni differed from those of
T. capreoli. Regional analysis showed significant variation among sampling areas (χ²=31.867, df=15,
P=0.0067), and seasonal comparisons also indicated significant differences across seasons (χ²=9.564, df=1,
P=0.0020). Detailed detection results for mite pools by pathogen, region, and season are presented in
Table 3.
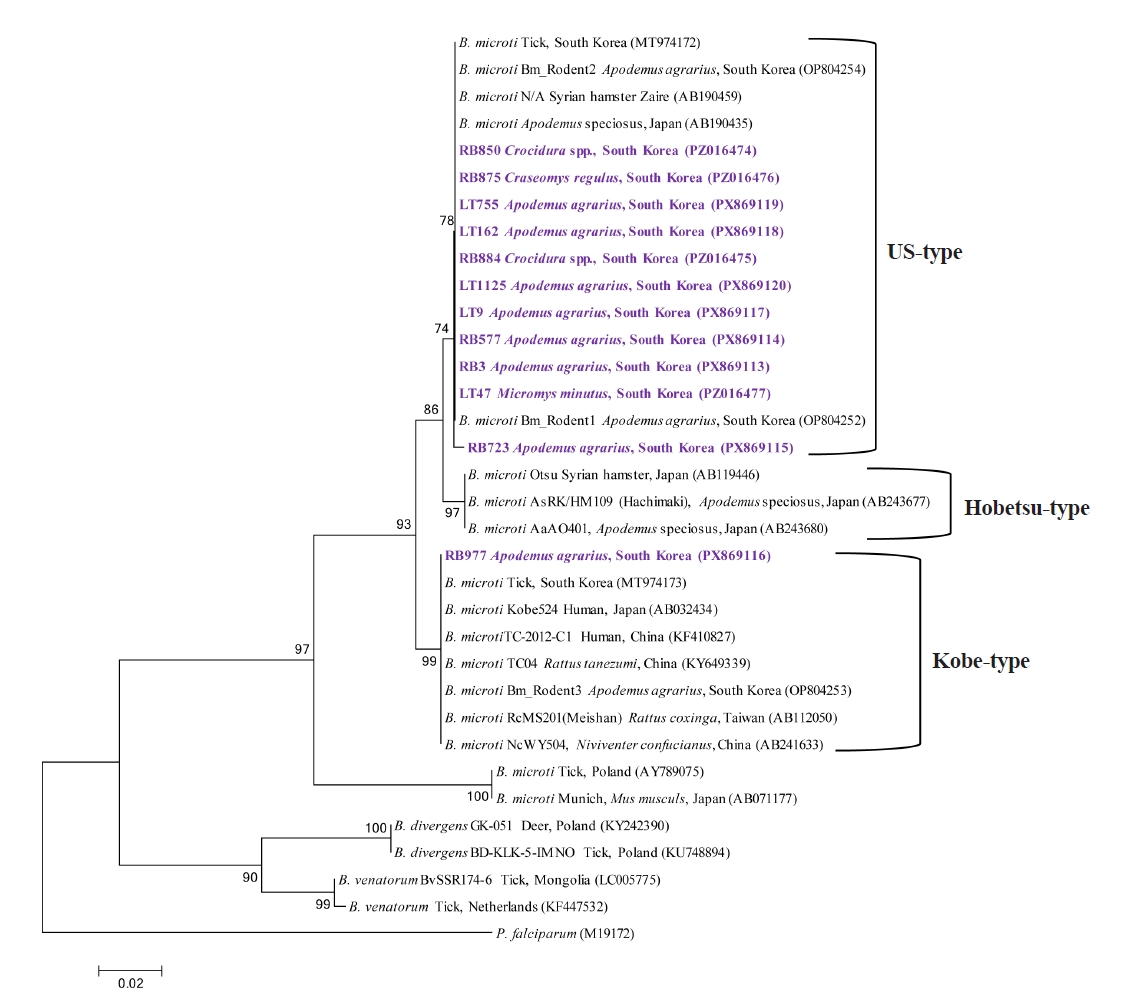
Phylogenetic analysis of the partial 18S rRNA gene showed that
B. microti sequences obtained in this study clustered with reference
B. microti sequences available in GenBank (
Fig. 3). Among the 12 sequences obtained from the selected representative samples, 11 clustered within the US-type lineage, whereas 1 sequence (RB977, PX869116) clustered within the Kobe-type lineage. None of the sequences obtained in this study clustered within the Hobetsu-type lineage. The 12 sequences showed 97.7%–100% nucleotide identity among themselves and shared 96.9%–100% identity with previously reported
B. microti sequences in GenBank. All 12 sequences were deposited in GenBank under accession numbers PX869113–PX869120 and PZ016474–PZ016477.
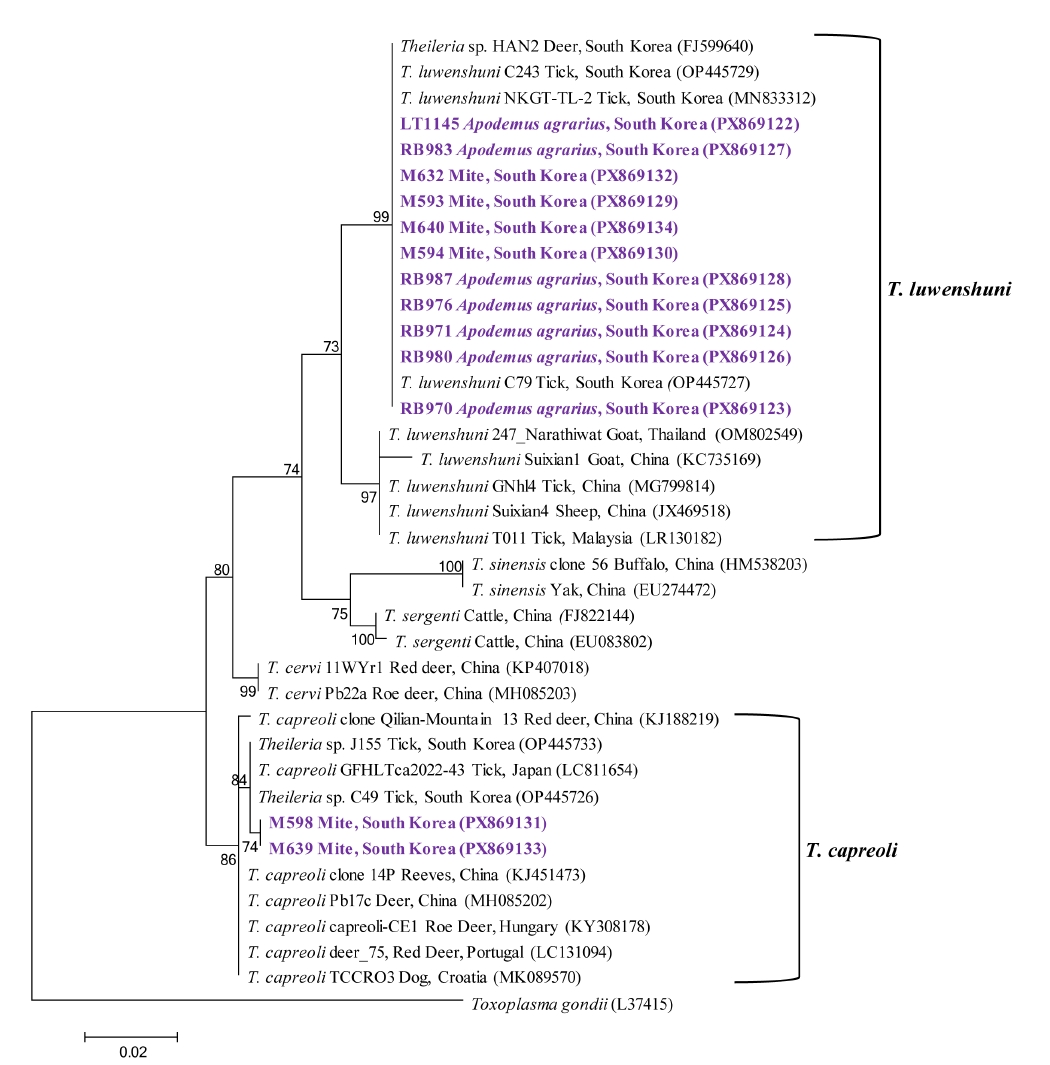
Phylogenetic analysis revealed sequence groups most closely related to
T. capreoli and
T. luwenshuni (
Fig. 4). The 2 sequences related to
T. capreoli showed 100% nucleotide identity with each other and 95.5%–98.3% identity with previously reported
T. capreoli sequences in GenBank. Both sequences were deposited in GenBank under accession numbers PX869131 and PX869133. The remaining 11 sequences were most closely related to
T. luwenshuni, showing 99.7%–100% nucleotide identity among themselves and 96.9%–100% identity with previously reported sequences related to
T. luwenshuni in GenBank. All 11 sequences were deposited in GenBank under accession numbers PX869122–PX869130, PX869132, and PX869134.
Discussion
Babesia and
Theileria species have been reported in a wide range of wildlife hosts, suggesting that these parasites are maintained through complex transmission systems in natural ecosystems [
18]. However, studies systematically comparing piroplasm infections across different host compartments in wild rodents remain limited. In this study, we addressed this knowledge gap by examining the detection of
Babesia and
Theileria in wild rodents nationwide in Korea.
Babesia and
Theileria were detected in wild rodents and mite pools, with detection patterns varying across sample types, regions, and seasons. These findings demonstrate heterogeneous molecular detection patterns across host and ectoparasite compartments within wildlife communities. Interpretation of these findings should consider the uneven species composition of the sampled rodent community. Because the rodent assemblage was dominated by a single host species,
A. agrarius (84.1%), the overall pathogen detection patterns largely reflect infection dynamics within this host. Although detections were observed in several additional rodent species, the relatively small sample sizes for these hosts limit robust interspecific comparisons and warrant cautious interpretation when discussing potential host range expansion.
Among the piroplasm species detected in this study,
B. microti warrants particular attention because of its well-established zoonotic importance.
B. microti is an intraerythrocytic parasite [
19] that is maintained in diverse ecological settings through wild rodents serving as its primary reservoir hosts [
20]. Against this background, examining the detection of
B. microti across different host compartments in wild rodents provides useful context for interpreting its circulation in wildlife-associated systems. In this study,
B. microti was detected in both liver tissues and blood samples of wild rodents, with substantially higher detection frequencies observed in blood samples. The higher detection frequency observed in blood samples is consistent with the intraerythrocytic biology of this parasite, for which circulating blood represents the primary site of infection. In contrast, the sporadic detection of
B. microti DNA in liver tissues may reflect differences in parasite distribution among sample types, as a previous molecular study reported differences in
Babesia detection between liver and spleen tissues [
21].
From a surveillance perspective, these findings suggest that molecular detection of B. microti in wildlife hosts may vary across host compartments, and reliance on a single sample type may underestimate the complexity of parasite circulation in wildlife systems. The stronger spatial and seasonal variation observed in blood samples compared with liver tissues suggests that blood-based detection may be more sensitive to short-term fluctuations in infection dynamics. In contrast, the limited variation observed in liver tissues may reflect lower and more sporadic detection of B. microti DNA in this compartment. Although this difference is consistent with the biological characteristics of B. microti, the higher detection frequency in blood samples may also have improved the ability to detect spatial and seasonal patterns relative to liver tissues. Together, these patterns indicate that the observed spatial and seasonal patterns may differ depending on the sample type used for molecular detection.
B. microti detection frequencies showed significant spatial and seasonal variation across the study area. Although the parasite was detected nationwide, regional heterogeneity was observed, and detection frequencies were consistently higher in autumn than in spring. The specific ecological drivers underlying these patterns could not be determined in the present study; however, they may reflect locally heterogeneous transmission dynamics and seasonal changes in vector activity, as previous studies have demonstrated seasonal patterns in both tick activity and
B. microti transmission in rodent populations [
22,
23]. Detection patterns of
B. microti observed in this study were broadly consistent with those reported in previous rodent blood-based surveys conducted in Korea [
11]. In the earlier study,
B. microti was detected in approximately 10% of blood samples from wild rodents, whereas the overall detection rate in the present study was similar (11.5%). Notably, as in the previous investigation, the highest detection frequency was observed in the Gangneung region, suggesting consistently higher circulation in the eastern part of the country. Phylogenetic analysis identified both US-type and Kobe-type
B. microti among the representative sequences examined in this study. Most of the analyzed sequences clustered within the US-type lineage, whereas one sequence clustered within the Kobe-type lineage. Both genotypes have also been reported previously in Korea [
11], showing that both lineages were represented in the present and previous studies. However, because sequencing was performed on selected representative PCR-positive samples rather than all positive samples, the relative frequency or population-level distribution of these genotypes cannot be inferred from the present dataset.
Beyond these epidemiological consistencies, our findings also expand the recognized host range of
B. microti in wild small mammals in Korea.
A. agrarius was the most frequently captured rodent species in this study, and
B. microti was frequently detected in both liver and blood samples from this species. This rodent species is widely distributed in Korea, and
B. microti infection has previously been reported in this host in the country [
11]. In addition,
B. microti was detected in
M. minutus and
Crocidura spp. Although infections in these species have been documented elsewhere worldwide [
24,
25], the present study represents the first report in Korea. Furthermore,
B. microti was identified in blood samples of
M. robusta,
M. regulus, and
C. regulus, for which, to our knowledge, no previous reports of infection have been documented. These findings suggest that the circulation of
B. microti may not be restricted to traditionally recognized reservoir species but may extend to a broader range of small mammal hosts. This pattern indicates that transmission networks within wild small mammal communities may be more complex than those centered on a single dominant host species. However, because analytical sensitivity was not directly compared between blood and liver samples and the numbers of available samples differed between compartments, these findings should not be interpreted as a formal comparison of diagnostic sensitivity.
Theileria spp. are primarily associated with domestic ungulates and have also been documented in wild ruminants, including roe deer, in which
T. capreoli has previously been identified [
2]. Previous studies have reported the detection of
T. capreoli in wild cervids [
26] as well as in ticks collected from wildlife hosts [
27]. In Korea,
T. capreoli has been reported in Korean water deer [
13] and has also been identified in ticks collected from wildlife [
28], indicating that its circulation in the country is primarily associated with cervid hosts and their ectoparasites. Furthermore, molecular detection of
T. capreoli DNA has been reported in hematophagous insects such as stable flies collected in areas where infected cervids were present [
29]. This observation demonstrates that molecular detection of parasite DNA in blood-feeding arthropods does not by itself establish their role as biological vectors. In the present study,
T. capreoli DNA was detected exclusively in mite pools at a low frequency, whereas no rodent tissue or blood samples tested positive. Given that mites are not established vectors of
T. capreoli, this finding should be interpreted as molecular detection rather than evidence of mite-mediated transmission. In the context of previous detection of
T. capreoli DNA in non-tick blood-feeding arthropods [
30], the present finding further demonstrates that parasite DNA may be detected in arthropod samples outside the recognized tick vectors. Therefore, the significance of this finding lies primarily in documenting the occurrence of
T. capreoli DNA in mite samples and highlighting the need to distinguish molecular detection from evidence of vector competence. Further studies are required to determine the origin and biological relevance of the detected DNA.
T. luwenshuni has primarily been reported in small ruminants in Asian countries. Studies from China and Myanmar have documented its detection in deer and goats [
4,
30], and in Korea it has also been identified in Korean water deer [
13]. In contrast to these reports, the present study identified the parasite in wild rodents, indicating a host association that differs from most previously reported findings. Similar to the compartmental pattern observed for
B. microti,
T. luwenshuni showed a slightly higher detection rate in blood than in liver tissues, although the overall detection frequency was low. This pattern is consistent with the erythrocytic stage of
T. luwenshuni, which has been demonstrated in the peripheral blood of infected hosts [
31]. Among the sample types examined, the highest observed detection frequency of
T. luwenshuni was in mite pools.
Theileria species are primarily transmitted by ixodid ticks [
28], and mites are not established biological vectors of
T. luwenshuni. Although
T. luwenshuni DNA has also been reported in other blood-feeding arthropods, including deer keds [
32], molecular detection in an ectoparasite sample does not demonstrate biological transmission competence. Therefore, the detection of
T. luwenshuni DNA in mite pools should be interpreted as molecular occurrence rather than evidence of mite-mediated transmission. Significant regional and seasonal variation was observed in blood and mite samples, whereas no significant differences were detected in liver tissues; however, given the low overall detection frequency, these patterns warrant cautious ecological interpretation. Further studies are required to determine the ecological and epidemiological significance of
T. luwenshuni DNA detected across host and ectoparasite compartments.
Several limitations of this study should be considered when interpreting the findings. First, the sampled small-mammal population was heavily dominated by A. agrarius, while the numbers of other host taxa were relatively small, limiting robust comparisons of pathogen occurrence among host species. Second, morphological identification of the collected mites was not performed, and mites were analyzed as pools of variable size (1–30 individuals); therefore, the detected piroplasm DNA cannot be attributed to a specific mite species or interpreted as evidence of vector competence. In addition, although each mite pool was prepared from mites collected from a single rodent, identifiers linking individual mite pools to the corresponding rodent blood and liver samples were not retained in the analytical dataset, precluding direct assessment of host–ectoparasite concordance. Third, only representative PCR-positive samples were selected for sequencing based on geographic and temporal representation. Although all sequences generated from these selected samples were deposited in GenBank, the sequencing dataset was not designed for population-level genetic or haplotype analyses. Accordingly, although phylogenetic lineage assignment was possible for the sequenced samples, the relative frequencies of the identified lineages should not be interpreted as reflecting their population-level distribution.
In conclusion, this study provides a nationwide assessment of Babesia and Theileria DNA in wild rodents and mites collected from rodents in Korea, revealing distinct detection patterns across host compartments and ectoparasite assemblages. B. microti showed heterogeneous detection patterns among sampling regions and seasons, particularly in blood samples. T. capreoli DNA was detected exclusively in mite pools, whereas T. luwenshuni DNA was detected at low frequency in both rodents and mite pools. The detection of Theileria DNA in mite pools should not be interpreted as evidence of mite-mediated transmission, because vector competence was not evaluated. These findings highlight the value of integrated host–ectoparasite molecular surveillance while emphasizing the need for cautious interpretation of pathogen DNA detected in arthropod samples.
Notes
-
Author contributions
Conceptualization: Kim B, Seo MG. Data curation: Kim B, Woo HM, Choi JW. Formal analysis: Kim B, Woo HM, Choi JW. Funding acquisition: Seo MG. Investigation: Lee YJ, Choi I. Methodology: Choi I. Project administration: Kang YM, Kwak D. Resources: Seo MG. Software: Choi I. Supervision: Kang YM, Kwak D. Validation: Choi I. Visualization: Choi I. Writing – original draft: Kim B, Seo MG. Writing – review & editing: Seo MG.
-
Conflict of interest
Dongmi Kwak and Min-Goo Seo serve as editors of Parasites, Hosts and Diseases but had no involvement in the decision to publish this article. No other potential conflicts of interest relevant to this study were reported.
-
Funding
This work was supported by the National Research Foundation of Korea (NRF) grant funded by the Korea government (MSIT) (grant No. RS-2022-00165704).
-
Acknowledgments
We give thanks to Dr. Hee Il Lee at Korea Disease Control and Prevention Agency and 16 members of staff at the Regional Center for Vector Surveillance against Climate Change for the collection of samples nationwide.
Fig. 1.Geographic distribution of rodent sampling sites across Korea. (A) Administrative regions where rodent trapping was conducted are highlighted in purple. Abbreviations indicate sampling locations: CW, Cheorwon; GN, Gangneung; YJ, Yeoju; HS, Hwaseong; PJ, Paju; CJ, Cheongju; BR, Boryeong; YS, Yesan; JE, Jeongeup; BS, Boseong; JA, Jinan; GJ, Geoje; HC, Hapcheon; GC, Gimcheon; YD, Yeongdeok; SG, Seogwipo. (B) Red dots indicate the precise geographic coordinates of rodent sampling sites used in this study.
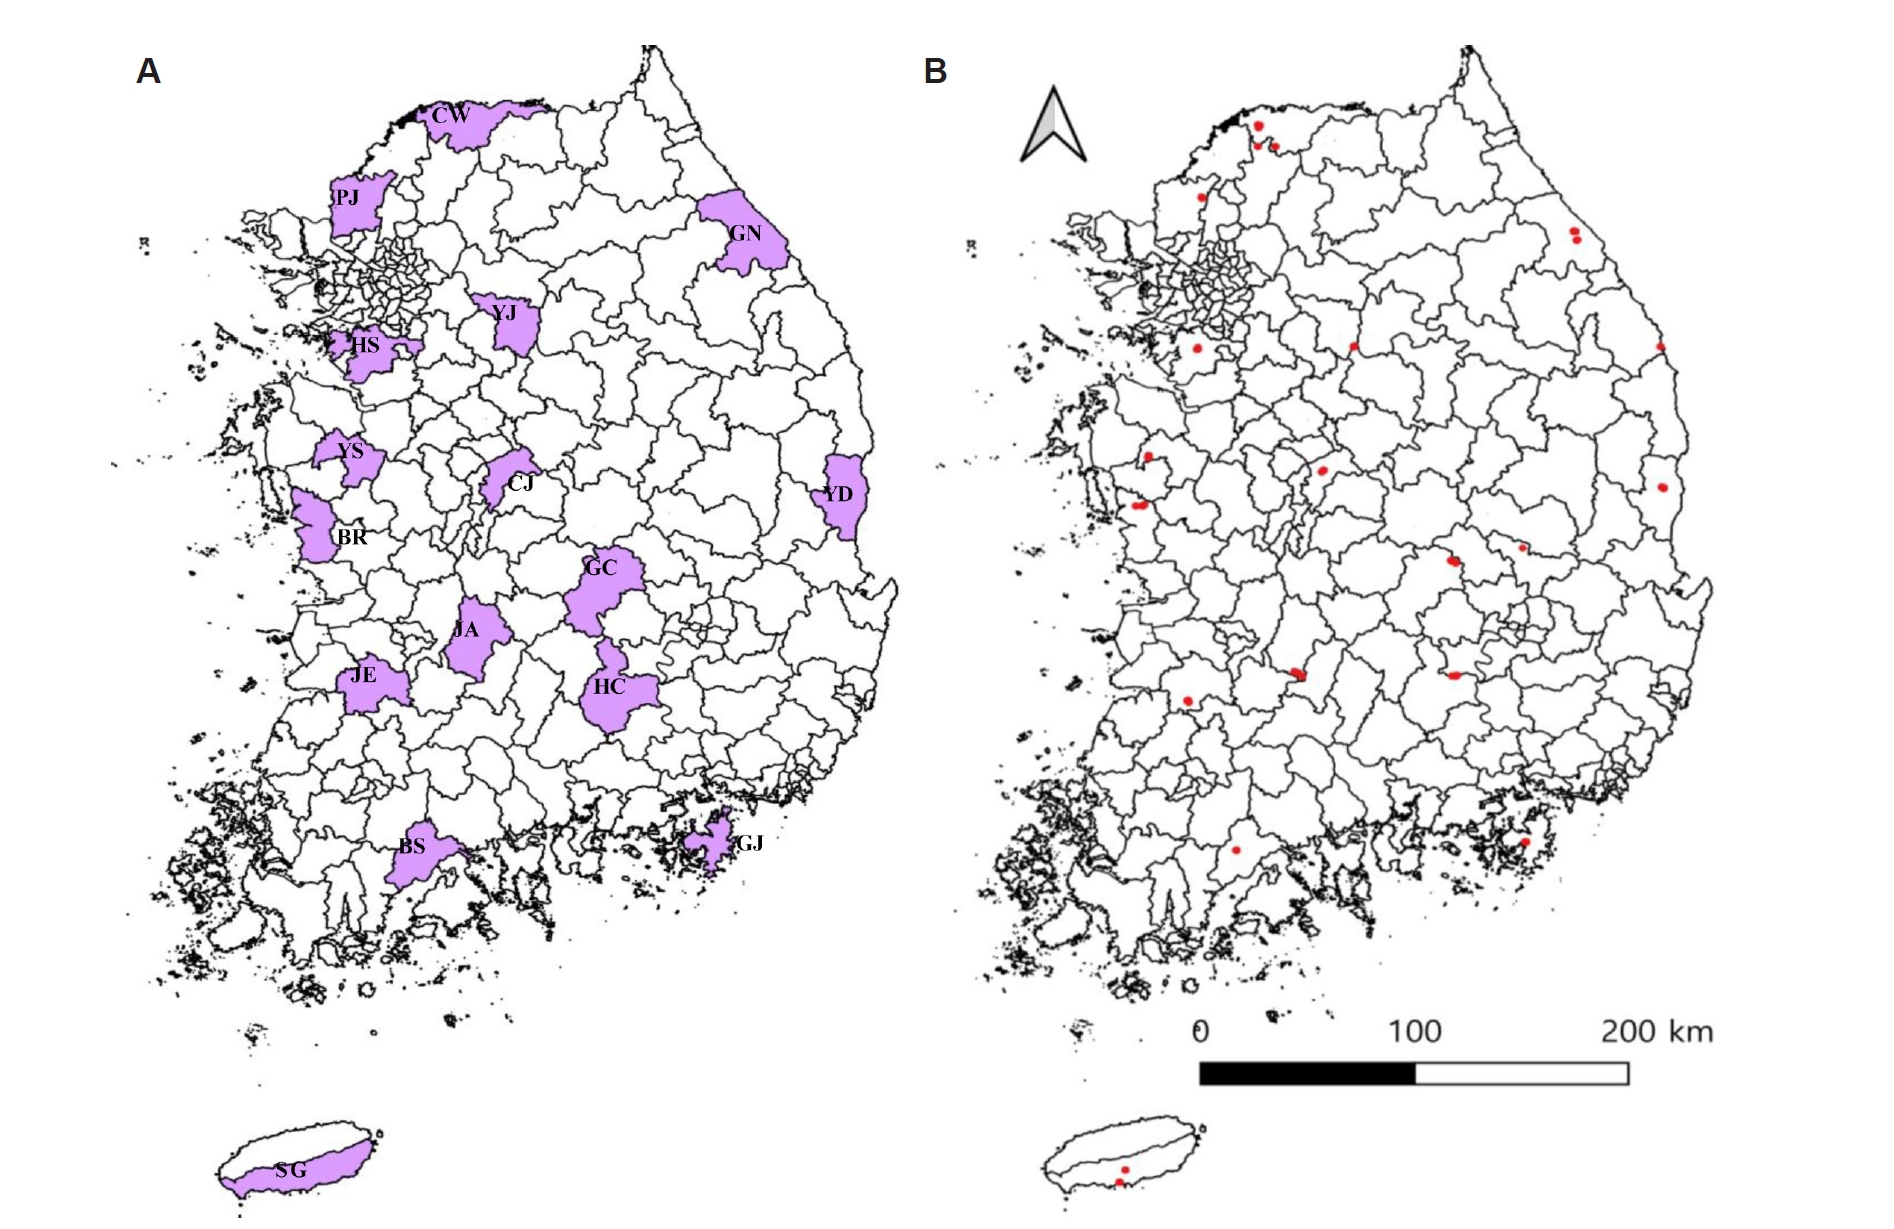
Fig. 2.Geographic distribution of pathogen-positive samples detected in rodents and mites collected from rodents in Korea. (A) Distribution of Babesia microti–positive rodents. Red dots represent B. microti detected in rodent blood samples, and blue dots represent B. microti detected in rodent liver tissues. (B) Distribution of Theileria capreoli–positive mite samples. Purple dots represent T. capreoli detected in mites collected from rodents. (C) Distribution of Theileria luwenshuni–positive samples. Green dots represent T. luwenshuni detected in mites collected from rodents, orange dots represent T. luwenshuni detected in rodent blood samples, and yellow dots represent T. luwenshuni detected in rodent liver tissues.

Fig. 3.Phylogenetic analysis of Babesia microti based on partial 18S rRNA gene sequences. The sequences obtained in this study are indicated in purple, and the GenBank accession numbers are shown in parentheses. The major B. microti lineages (US-type, Hobetsu-type, and Kobe-type) are indicated on the right. Eleven sequences obtained in this study clustered within the US-type lineage, whereas one sequence (RB977, PX869116) clustered within the Kobe-type lineage. Plasmodium falciparum was used as an outgroup. Bootstrap values are shown at the branch nodes based on 1,000 replicates. The evolutionary history was inferred using the maximum likelihood method. The scale bar indicates the number of nucleotide substitutions per site.
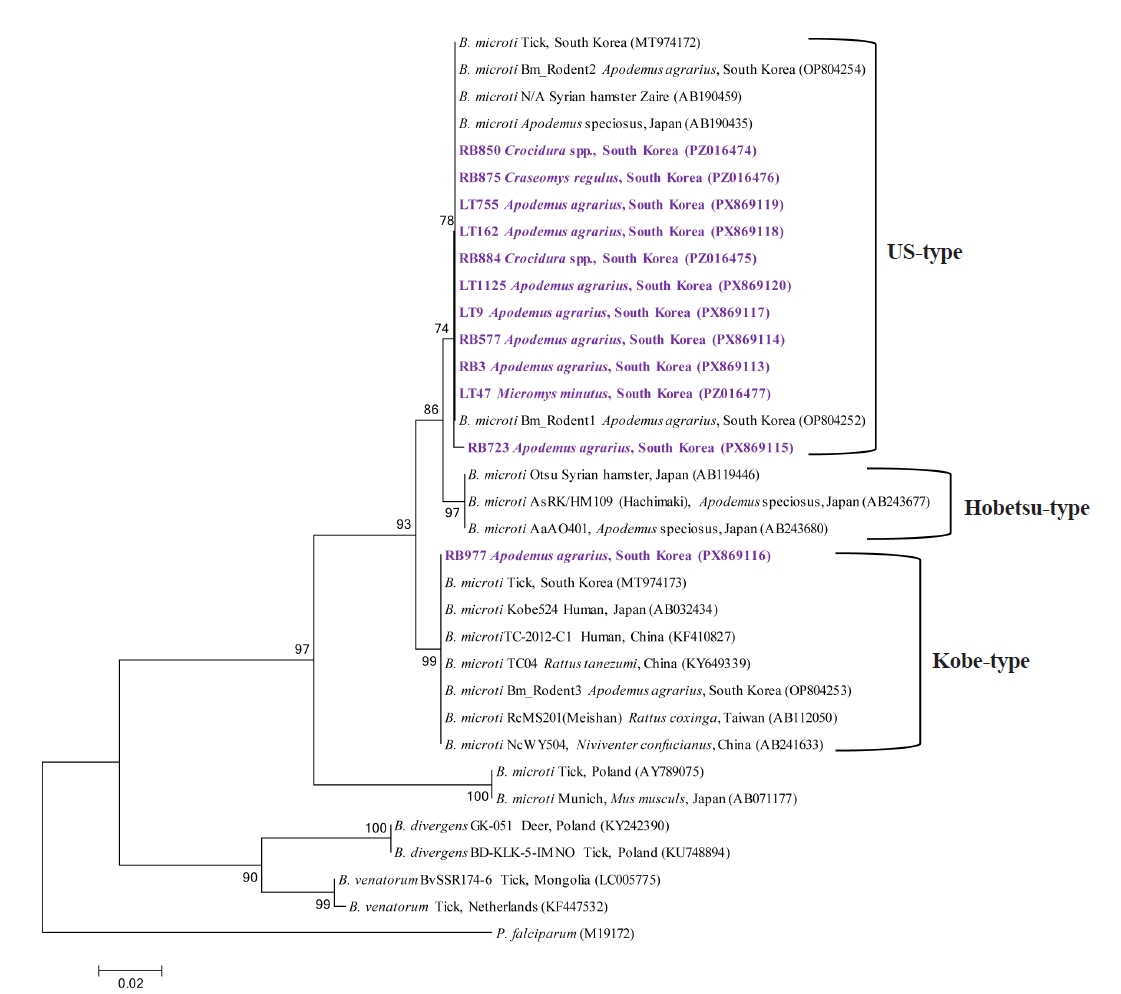
Fig. 4.Phylogenetic analysis of Theileria spp. based on partial 18S rRNA gene sequences. The sequences obtained in this study are indicated in purple, and the GenBank accession numbers are shown in parentheses. Toxoplasma gondii was used as an outgroup. Bootstrap values are shown at the branch nodes based on 1,000 replicates. The evolutionary history was inferred using the maximum likelihood method. The scale bar indicates the number of nucleotide substitutions per site.
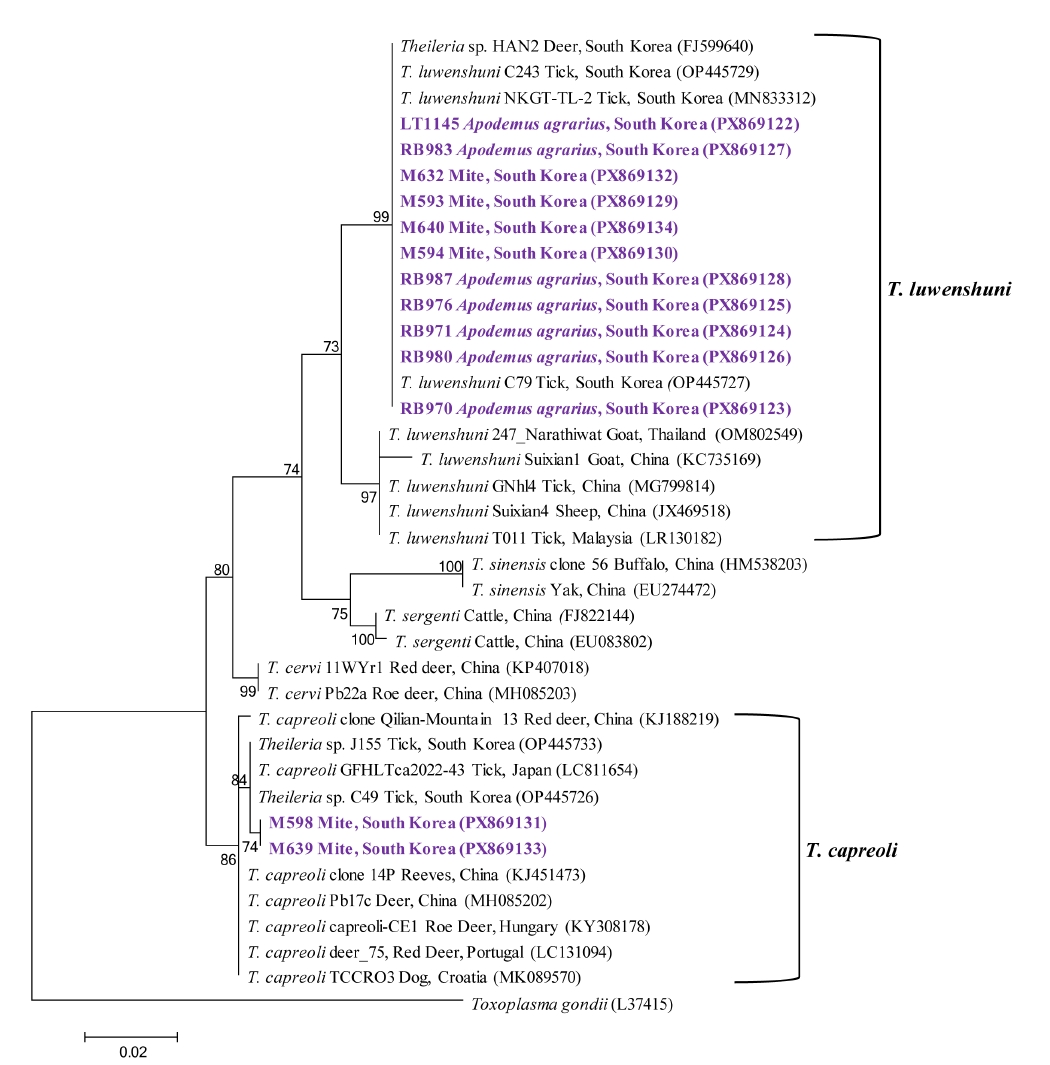
Table 1.Year-specific distribution of captured rodent species in Korea
Table 1.
|
Year |
No. collected |
Apodemus agrarius
|
Apodemus peninsulae
|
Craseomys regulus
|
Craseomys rufocanus
|
Crocidura spp. |
Microtus fortis
|
Micromys minutus
|
Mogera robusta
|
Myodes regulus
|
Rattus norvegicus
|
|
2022 |
540 |
439 (81.3) |
5 (0.9) |
7 (1.3) |
0 (0) |
64 (11.9) |
3 (0.6) |
21 (3.9) |
1 (0.2) |
0 (0) |
0 (0) |
|
2023 |
557 |
485 (87.1) |
0 (0) |
9 (1.6) |
3 (0.5) |
46 (8.3) |
1 (0.2) |
6 (1.1) |
0 (0) |
6 (1.1) |
1 (0.2) |
|
2024 |
113 |
94 (83.2) |
0 (0) |
1 (0.9) |
0 (0) |
18 (15.9) |
0 (0) |
0 (0) |
0 (0) |
0 (0) |
0 (0) |
|
Total |
1,210 |
1,018 (84.1) |
5 (0.4) |
17 (1.4) |
3 (0.2) |
128 (10.6) |
4 (0.3) |
27 (2.2) |
1 (0.1) |
6 (0.5) |
1 (0.1) |
Table 2.Year- and season-specific detection of Babesia microti, Theileria capreoli, and Theileria luwenshuni in rodent blood, liver tissues, and mite pools collected from rodents in Korea
Table 2.
|
Year |
Season |
No. tested |
No. infected (%) |
|
Liver tissue |
Mite pools |
Blood |
Babesia microti
|
Theileria capreoli
|
Theileria luwenshuni
|
|
Liver |
Mite pools |
Blood |
Liver |
Mite pools |
Blood |
Liver |
Mite pools |
Blood |
|
2022 |
Spring |
265 |
127 |
295 |
8 (3.0) |
0 (0) |
21 (7.1) |
0 (0) |
0 (0) |
0 (0) |
0 (0) |
0 (0) |
0 (0) |
|
Autumn |
275 |
199 |
251 |
7 (2.5) |
0 (0) |
46 (18.3)a
|
0 (0) |
0 (0) |
0 (0) |
0 (0) |
0 (0) |
0 (0) |
|
2023 |
Spring |
295 |
172 |
210 |
1 (0.3) |
0 (0) |
17 (8.1) |
0 (0) |
0 (0) |
0 (0) |
0 (0) |
0 (0) |
0 (0) |
|
Autumn |
262 |
151 |
82 |
1 (0.4) |
0 (0) |
12 (14.6) |
0 (0) |
6 (4.0) |
0 (0) |
0 (0) |
11 (7.3) |
0 (0) |
|
2024 |
Autumn |
113 |
0 (0) |
109 |
9 (8.0) |
0 (0) |
13 (11.9) |
0 (0) |
0 (0) |
0 (0) |
1 (0.9) |
0 (0) |
6 (5.5) |
|
Total |
1,210 |
649 |
947 |
26 (2.1) |
0 (0) |
109 (11.5) |
0 (0) |
6 (0.9) |
0 (0) |
1 (0.1) |
11 (1.7) |
6 (0.6) |
Table 3.Spatiotemporal distribution of Babesia and Theileria species in wild rodents and mite pools collected from rodents in Korea
Table 3.
|
Group |
No. tested |
No. infected (%) |
|
Liver tissue |
Mites (pools) |
Blood |
Babesia microti
|
Theileria capreoli
|
Theileria luwenshuni
|
|
Liver |
Mite pools |
Blood |
Liver |
Mite pools |
Blood |
Liver |
Mite pools |
Blood |
|
Regions |
Northern |
Cheorwon |
121 |
1,186 (63) |
93 |
6 (5.0) |
0 (0) |
19 (20.4) |
0 (0) |
0 (0) |
0 (0) |
0 (0) |
0 (0) |
0 (0) |
|
Gangneung |
115 |
488 (37) |
84 |
4 (3.5) |
0 (0) |
23 (27.4) |
0 (0) |
0 (0) |
0 (0) |
0 (0) |
0 (0) |
0 (0) |
|
Yeoju |
102 |
902 (63) |
88 |
2 (2.0) |
0 (0) |
1 (1.1) |
0 (0) |
0 (0) |
0 (0) |
0 (0) |
0 (0) |
0 (0) |
|
Hwaseong |
63 |
1,075 (55) |
32 |
0 (0) |
0 (0) |
0 (0) |
0 (0) |
1 (1.8) |
0 (0) |
0 (0) |
4 (7.3) |
0 (0) |
|
Paju |
68 |
1,279 (56) |
45 |
0 (0) |
0 (0) |
8 (17.8) |
0 (0) |
1 (1.8) |
0 (0) |
0 (0) |
2 (3.6) |
0 (0) |
|
Central |
Cheongju |
49 |
632 (29) |
32 |
0 (0) |
0 (0) |
5 (15.6) |
0 (0) |
0 (0) |
0 (0) |
0 (0) |
0 (0) |
0 (0) |
|
Boryeong |
55 |
451 (23) |
45 |
0 (0) |
0 (0) |
5 (11.1) |
0 (0) |
0 (0) |
0 (0) |
0 (0) |
0 (0) |
0 (0) |
|
Yesan |
52 |
667 (28) |
42 |
0 (0) |
0 (0) |
0 (0) |
0 (0) |
0 (0) |
0 (0) |
0 (0) |
0 (0) |
0 (0) |
|
Southern |
Jeongeup |
60 |
961 (46) |
55 |
6 (10.0) |
0 (0) |
14 (25.5) |
0 (0) |
1 (2.2) |
0 (0) |
0 (0) |
1 (2.2) |
0 (0) |
|
Boseong |
61 |
768 (44) |
58 |
0 (0) |
0 (0) |
3 (5.2) |
0 (0) |
0 (0) |
0 (0) |
0 (0) |
0 (0) |
0 (0) |
|
Jinan |
84 |
754 (48) |
80 |
4 (4.8) |
0 (0) |
12 (15.0) |
0 (0) |
3 (6.3) |
0 (0) |
0 (0) |
4 (8.3)a
|
4 (5.0)a
|
|
Geoje |
65 |
749 (30) |
57 |
0 (0) |
0 (0) |
0 (0) |
0 (0) |
0 (0) |
0 (0) |
0 (0) |
0 (0) |
0 (0) |
|
Hapcheon |
54 |
335 (20) |
45 |
2 (3.7) |
0 (0) |
2 (4.4) |
0 (0) |
0 (0) |
0 (0) |
0 (0) |
0 (0) |
0 (0) |
|
Gimcheon |
48 |
552 (26) |
25 |
0 (0) |
0 (0) |
0 (0) |
0 (0) |
0 (0) |
0 (0) |
0 (0) |
0 (0) |
0 (0) |
|
Yeongdeok |
73 |
966 (56) |
53 |
0 (0) |
0 (0) |
6 (11.3) |
0 (0) |
0 (0) |
0 (0) |
1 (1.4) |
0 (0) |
0 (0) |
|
Jeju Island |
Seogwipo |
140 |
353 (25) |
113 |
2 (1.4) |
0 (0) |
11 (9.7) |
0 (0) |
0 (0) |
0 (0) |
0 (0) |
0 (0) |
2 (1.8) |
|
Seasons |
Spring |
560 |
3,730 (299) |
505 |
8 (1.4) |
0 (0) |
38 (7.5) |
0 (0) |
0 (0) |
0 (0) |
0 (0) |
0 (0) |
0 (0) |
|
Autumn |
650 |
8,384 (350) |
442 |
18 (2.8) |
0 (0) |
71 (16.1) |
0 (0) |
6 (1.7)a
|
0 (0) |
1 (0.2) |
11 (3.1)a
|
6 (1.4)a
|
|
Total |
1,210 |
12,114 (649) |
947 |
26 (2.1) |
0 (0) |
109 (11.5) |
0 (0) |
6 (0.9) |
0 (0) |
1 (0.1) |
11 (1.7) |
6 (0.6) |
References
- 1. Yabsley MJ, Shock BC. Natural history of zoonotic Babesia: role of wildlife reservoirs. Int J Parasitol Parasites Wildl 2012;2:18-31. https://doi.org/10.1016/j.ijppaw.2012.11.003
- 2. García-Sanmartín J, Aurtenetxe O, Barral M, et al. Molecular detection and characterization of piroplasms infecting cervids and chamois in Northern Spain. Parasitology 2007;134:391-8. https://doi.org/10.1017/S0031182006001569
- 3. Vannier E, Krause PJ. Babesiosis in China, an emerging threat. Lancet Infect Dis 2015;15:137-9. https://doi.org/10.1016/S1473-3099(14)71062-X
- 4. Bawm S, Kakisaka K, Thu MJ, et al. First molecular detection of Theileria luwenshuni from goats in Myanmar. Parasitol Res 2018;117:3361-4. https://doi.org/10.1007/s00436-018-6073-6
- 5. Capizzi D, Bertolino S, Mortelliti A. Rating the rat: global patterns and research priorities in impacts and management of rodent pests. Mamm Rev 2014;44:148-62. https://doi.org/10.1111/mam.12019
- 6. Randolph SE. Tick ecology: processes and patterns behind the epidemiological risk posed by ixodid ticks as vectors. Parasitology 2004;129 Suppl:S37-65. https://doi.org/10.1017/s0031182004004925
- 7. Gray J, von Stedingk LV, Gürtelschmid M, Granström M. Transmission studies of Babesia microti in Ixodes ricinus ticks and gerbils. J Clin Microbiol 2002;40:1259-63. https://doi.org/10.1128/jcm.40.4.1259-1263.2002
- 8. Kim B, Lee YJ, Kwak D, Seo MG. Nationwide survey of vector-borne diseases in rodents and mites in Korea: Anaplasma, Ehrlichia, and Rickettsia. Animals (Basel) 2024;14:2950. https://doi.org/10.3390/ani14202950
- 9. Obiegala A, Pfeffer M, Pfister K, Karnath C, Silaghi C. Molecular examinations of Babesia microti in rodents and rodent-attached ticks from urban and sylvatic habitats in Germany. Ticks Tick Borne Dis 2015;6:445-9. https://doi.org/10.1016/j.ttbdis.2015.03.005
- 10. Sonenshine DE, Roe RM. Biology of ticks. 2nd ed. Oxford University Press; 2014.
- 11. Kim HJ, Han B, Lee HI, Ju JW, Shin HI. Current status of Trypanosoma grosi and Babesia microti in small mammals in the Republic of Korea. Animals (Basel) 2024;14:989. https://doi.org/10.3390/ani14070989
- 12. Kim TY, Kim SY, Kim TK, et al. Molecular evidence of zoonotic Babesia species, other than B. microti, in ixodid ticks collected from small mammals in the Republic of Korea. Vet Med Sci 2021;7:2427-33. https://doi.org/10.1002/vms3.581
- 13. Kim B, Chae SJ, Lee YJ, et al. Nationwide geographical and temporal distribution of tick-borne diseases in Korean water deer (Hydropotes inermis argyropus). Animals (Basel) 2025;15:1499. https://doi.org/10.3390/ani15101499
- 14. Troskie M, Matthee S, Penzhorn BL, Jansen R, Oosthuizen M. Occurrence of tick-borne haemoparasites in South African rodent species and evidence of Babesia microti-like sequence variants in two Rhabdomys species. Int J Parasitol Parasites Wildl 2025;26:101051. https://doi.org/10.1016/j.ijppaw.2025.101051
- 15. Brooks JE, Rowe FP. Rodents: training and information guide. World Health Organization; 1987.
- 16. Burgin CJ, Colella JP, Kahn PL, Upham NS. How many species of mammals are there? J Mammal 2018;99:1-14. https://doi.org/10.1093/jmammal/gyx147
- 17. Casati S, Sager H, Gern L, Piffaretti JC. Presence of potentially pathogenic Babesia sp. for human in Ixodes ricinus in Switzerland. Ann Agric Environ Med 2006;13:65-70.
- 18. Alvarado-Rybak M, Solano-Gallego L, Millán J. A review of piroplasmid infections in wild carnivores worldwide: importance for domestic animal health and wildlife conservation. Parasit Vectors 2016;9:538. https://doi.org/10.1186/s13071-016-1808-7
- 19. Goethert HK. What Babesia microti is now. Pathogens 2021;10:1168. https://doi.org/10.3390/pathogens10091168
- 20. Beck R, Vojta L, Curković S, et al. Molecular survey of Babesia microti in wild rodents in central Croatia. Vector Borne Zoonotic Dis 2011;11:81-3. https://doi.org/10.1089/vbz.2009.0260
- 21. Liu Y, Niu J, Cui J, Rao H, Yu J. Prevalence and molecular detection of Babesia microti in rodents in Southeastern Shanxi, China. PLoS One 2024;19:e0306181. https://doi.org/10.1371/journal.pone.0306181
- 22. Hussein HS. Ixodes trianguliceps: seasonal abundance and role in the epidemiology of Babesia microti infection in north-western England. Ann Trop Med Parasitol 1980;74:531-9. https://doi.org/10.1080/00034983.1980.11687381
- 23. Turner CM. Seasonal and age distributions of Babesia, Hepatozoon, Trypanosoma and Grahamella species in Clethrionomys glareolus and Apodemus sylvaticus populations. Parasitology 1986;93:279-89. https://doi.org/10.1017/s0031182000051453
- 24. Mardosaitė-Busaitienė D, Radzijevskaja J, Balčiauskas L, Paulauskas A. Babesia microti in rodents from different habitats of Lithuania. Animals (Basel) 2021;11:1707. https://doi.org/10.3390/ani11061707
- 25. Chen XR, Ye LI, Fan JW, et al. Detection of Kobe-type and Otsu-type Babesia microti in wild rodents in China's Yunnan province. Epidemiol Infect 2017;145:2704-10. https://doi.org/10.1017/s0950268817001686
- 26. Li Y, Chen Z, Liu Z, et al. Molecular identification of Theileria parasites of northwestern Chinese Cervidae. Parasit Vectors 2014;7:225. https://doi.org/10.1186/1756-3305-7-225
- 27. Fernández N, Revuelta B, Aguilar I, et al. Babesia and Theileria identification in adult ixodid ticks from Tapada Nature Reserve, Portugal. Pathogens 2022;11:222. https://doi.org/10.3390/pathogens11020222
- 28. Alkathiri B, Ahn K, Lee H, et al. Molecular epidemiology of Theileria species in ticks and its potential threat to livestock in the Republic of Korea. Acta Trop 2023;238:106780. https://doi.org/10.1016/j.actatropica.2022.106780
- 29. Hornok S, Takács N, Szekeres S, et al. DNA of Theileria orientalis, T. equi and T. capreoli in stable flies (Stomoxys calcitrans). Parasit Vectors 2020;13:186. https://doi.org/10.1186/s13071-020-04041-1
- 30. Li Y, Liu J, Liu Z, et al. Report of Theileria luwenshuni and Theileria sp. RSR from cervids in Gansu, China. Parasitol Res 2015;114:2023-9. https://doi.org/10.1007/s00436-015-4439-6
- 31. Wang BH, Du LF, Zhang MZ, et al. Genomic characterization of Theileria luwenshuni strain cheeloo. Microbiol Spectr 2023;11:e0030123. https://doi.org/10.1128/spectrum.00301-23
- 32. Lee SH, Kim KT, Kwon OD, et al. Novel detection of Coxiella spp., Theileria luwenshuni, and T. ovis endosymbionts in deer keds (Lipoptena fortisetosa). PLoS One 2016;11:e0156727. https://doi.org/10.1371/journal.pone.0156727


 , You-Jeong Lee